Journal of Information Systems Engineering and Business Intelligence Vol. 4, No. 1, April 2018 Available online at: http://e-journal.unair.ac.id/index.php/JISEBI
Evaluation of Software Quality to Improve Application Performance Using Mc Call Model Inda D Lestantri 1)*, Rosini 2) 1)
Informatika Department, Faculty of Information Technology, Yarsi University Letjen Suprapto Street, Jakarta, Indonesia 1)
[email protected]
2)
Library Science Departement, Faculty of Information Technology, Yarsi University Letjen Suprapto Street, Jakarta, Indonesia 2)
[email protected]
Article history:
Abstract
Received 14 September 2017 Revised 30 January 2018 Accepted 26 March 2018 Available online 28 April 2018 Keywords: Application McCall Operation Testing Usability
The existence of software should have more value to improve the performance of the organization in addition to having the primary function to automate. Before being implemented in an operational environment, software must pass the test gradually to ensure that the software is functioning properly, meeting user needs and providing convenience for users to use it. This test is performed on a web-based application, by taking a test case in an e-SAP application. E-SAP is an application used to monitor teaching and learning activities used by a university in Jakarta. To measure software quality, testing can be done on users randomly. The user samples selected in this test are users with an age range of 18 years old up to 25 years, background information technology. This test was conducted on 30 respondents. This test is done by using Mc Call model. Model of testing Mc Call consists of 11 dimensions are grouped into 3 categories. This paper describes the testing with reference to the category of product operation, which includes 5 dimensions. The dimensions of testing performed include the dimensions of correctness, usability, efficiency, reliability, and integrity. This paper discusses testing on each dimension to measure software quality as an effort to improve performance. The result of research is e-SAP application has good quality with product operation value equal to 85.09%. This indicates that the e-SAP application has a great quality, so this application deserves to be examined in the next stage on the operational environment. I. INTRODUCTION
In a survey conducted by Deloitte Consulting on 64 companies listed in Fortune 500, 25% of companies surveyed stated that they had experienced a sharp performance decline in the period after implementation [1]. Although already through the requirements and design phase, in fact, the software failure is high enough. Many factors cause software failure. Factors that cause software failure include mismatch between design and implementation[2]. The results contained in the design related to the excavation of user needs. Excavation of user needs to be obtained from communication. While on the implementation related to how it works. Pouring more user needs on the ability to design. While software developers or programmers focus more on technical implementation capabilities. Another factor that causes failure is the separation of tasks separately between developers and software testers with little communication[3]. These factors are the factors that cause failure, where this happens because the developer is more likely to focus on product development. *
Corresponding author
ISSN 2443-2555 (online) 2598-6333 (print) © 2018 The Authors. Published by Universitas Airlangga. This is an open access article under the CC BY license (http://creativecommons.org/licenses/by/4.0/) doi: http://dx.doi.org/10.20473/jisebi.4.1.18-24
Inda D Lestantri & Rosini Journal of Information Systems Engineering and Business Intelligence, 2018, 4 (1), 18-24
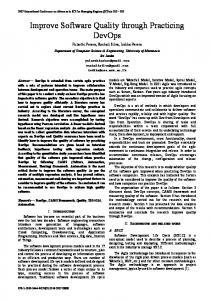
There are many ways to avoid software failure [4][5][6], As one of the efforts to reduce the failure is the development of software by focusing on the user [7]. To be able to focus on the user then need to approach by developing a good design, which centered on the user. Good design creation is not enough once created. Making this design is done from the beginning to ensure that the interface created is in accordance with the needs of the user. Good design requires repetitive testing[8]. This test is done to ensure that the designs are made well enough and meet the usability rules. The usability test is also applied to the e-SAP application. E-SAP is one application developed by a university in Jakarta, in order to monitor the teaching and learning process. This application was developed as an effort to improve the quality of services to the academic field and improve the performance of academic administration. Testing on this e-SAP application is done repeatedly. At the stage of usability testing performed on 30 respondents with backgrounds in the field of information technology. The goal of this testing is to measure the quality of the eSAP application. The test results are used as feedback for improvement and enhancement of the quality of the e-SAP application, prior to testing on its operational environment (beta testing). This test includes five dimensions tested, are dimensions correctness, effectiveness, reliability, integrity, and usability. This test is done by spreading the questioner. Previous research related to usability testing has been done. Among them is research conducted by [9] entitled "Evaluation of Academic Information System Usability Usability Based on ServQual and Webqual Combination Case Study: SISAKAD Polytechnic XYZ". This research uses combination method of ServQual and Webqual. The results of this study are objective and subjective aspects that get good and satisfactory results, which means that the academic information system service XYZ campus accepted by the user. Other studies conducted by [10] about design and Usability Evaluation of Application of computer management, using the ISO standard 9241-11, which refers to the three-dimensional, covers effectiveness, efficiency, and satisfaction. This research was conducted to improve laboratory services. Other usability-related research conducted by [11]. This research aims to test the application of Palembang Guide., which is used to support the implementation of the Asian Games XVIII by using the System Usability Scale (SUS). The results of the study stated that the application of Palembang Guide worth it used to support the activities of the Asian Games XVIII. Other studies related to usability is also done by [12] entitled "Objective aspects and subjective aspects in the quality testing of the Website of the University of Sahid Surakarta. This test is done by using the McCall method with 5 dimensions. Dimensions tested are efficiency, reliability, maintainability, usability, compatibility. The results of these tests suggest that of all the dimensions tested, the quality of Sahid University website is quite good, with a total product value of 71.75%. Another study was conducted by [13]. Topics of research on review on UML star software. Testing is also done using the McCall method. The results revealed that not all dimensions in starUML fulfilled the requirement. So users need to reconsider the use of starUML. In this study software evaluation is also done by the McCall method. The dimensions tested are partially different from those of previous studies. The results of this study to see whether eSAP deserve to be accepted by users. So users will refer other users to use it. II. METHODS This type of research is a quantitative research. The quantitative approach is chosen because based on the data distributed through questionnaires to users offline. The questionnaire is prepared using a 5-point Likert scale (1 means strongly disagree, 2 means agree, 3 means hesitation, 4 means agree, and 5 means strongly agree). The statements used in the questionnaire were adapted from previous research conducted by [14]. The sample of this study is students with age range 19-25 years at University X, randomly and background understanding of technology. The number of valid respondents is 30 people. The research instrument used is closed questionnaire using a Likert scale and compiled by asking questions according to research dimension. There are five dimensions measured in this study. That is the dimensions of correctness, usability, efficiency, reliability, and integrity. Correctness is the ability of software products to perform its functions in accordance with the requirements specification. The correctness dimension is a major factor in determining software quality. If a software cannot meet the correctness dimension, then the software may be deemed to fail and can not be used by the user. Usability is related to the ability required to learn, operate, input and interpret the output of a program. Efficiency is closely related to the quality of code algorithms used in software development. Reliability describes the size of a software's resistance to risk and potential failure. This factor can be determined by calculating the probability value of the error-free software operation at a given time and in a particular environment. Integrity focuses on the security of the software. The results of the questionnaire obtained then processed using SPPS 20.0 software by first testing through the validity and reliability test. The flow diagram of usability testing research on e-SAP can be seen in Figure 1.
19
Inda D Lestantri & Rosini Journal of Information Systems Engineering and Business Intelligence, 2018, 4 (1), 18-24
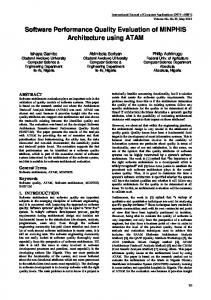
McCall developed the method by classifying software requirements into software quality factors. The model consists of 11 factors of quality. The McCall structure is developed to pay attention to quality factors, these quality factors can affect the use of software in its operational environment.The model of this research flow is illustrated in Figure 2. From the research model is made hypothesis as follows are correctness has a significant positive effect on product quality, integrity has a significant positive effect on product quality, efficiencies has a significant positive effect on product quality, reliability has a significant positive effect on product quality and usability has a significant positive effect on product quality.
Figure 1. The flow diagram of the research on usability testing
Figure 2. Research Model
III. RESULTS A. Test Validity Validity comes from the word validity which means the extent to which the accuracy of a measuring instrument [15]. [16] states that the validity test is used to measure whether or not a valid questionnaire. A questionnaire is said to be valid if the question on the questionnaire is able to reveal something that will be measured by the questionnaire. Questions that are not valid, they will not be used in the questionnaire. Invalid data was removed. In this test data used is the only valid value. Testing is done by comparing Cronbach's Alpha if item deleted with Cronbach's alpha.The questionnaire is said to be valid if the Cronbach’s Alpha coefficient value is obtained > 0.60 [16]. The test results on each indicator are said to be valid if Cronbach's Alpha if item deleted > Cronbach's Alpha. The result of validity test can be seen in Table 1.
20
Inda D Lestantri & Rosini Journal of Information Systems Engineering and Business Intelligence, 2018, 4 (1), 18-24
B. Test Reliability According [16] reliability is a tool to measure a questionnaire which is an indicator of the variables. A questionnaire is said to be reliable if one's response to a statement is consistent or stable over time. Reliability measurement can basically be done in two ways. First, the repeated measure, the question asked to the respondent repeatedly at different times. Second, one shot, the measurement is only once and then the result is compared with another question [17]. Reliability value standard =0,6. The questionnaire is said to be reliable if the Cronbach’s Alpha coefficient value is obtained > 0.60 [16]. The result of reliability test can be seen in Table 2. TABLE 1. RESULT OF VALIDITY TEST Dimensions
Indicators
Cronbach’s Alpha if Item Deleted
Cronbach’s Alpha
Descriptions
Correctness
C1 C2 C3 C4 C5 E1 E5 E3 E4 E5 R1 R2 R3 R4 R5 I1 I2 I3 I4 I5 U1 U2 U3 U4 U5
0,852 0,856 0,853 0,822 0,833 0,654 0,669 0,618 0,688 0,606 0,885 0,879 0,893 0,868 0,897 0,801 0,799 0,747 0,795 0,807 0,676 0,692 0,609 0,667 0,635
0,6
Valid Valid Valid Valid Valid Valid Valid Valid Valid Valid Valid Valid Valid Valid Valid Valid Valid Valid Valid Valid Valid Valid Valid Valid Valid
Efficiency
Reliability
Integrity
Usability
TABLE 2. RESULT OF RELIABILITY TEST Dimensions
Correctness Efficiency Reliability Integrity Usability
Cronbach’s Alpha
N of items
Descriptions
0,867 0,697 0,906 0,825 0706
5 5 5 5 5
Reliable Reliable Reliable Reliable Reliable
From Table 2, it can be seen that the dimensions of Correctness have Cronbach's alpha value 0.867, Efficiency dimension has the Cronbach's alpha value 0.697, dimension Reliability has the Cronbach's alpha value 0.906, dimensional Integrity have alpha Cronbach's value of 0.825, and dimensions of usability has value Cronbach's alpha value 0.706.The Cronbach's alpha value of all dimension items is greater than 0.6, so it can be inferred that all dimensions of the questionnaire can be trusted as a variable measuring instrument.
21
Inda D Lestantri & Rosini Journal of Information Systems Engineering and Business Intelligence, 2018, 4 (1), 18-24
The level of effectiveness and efficiency is measured by using the user's success rate (percentage of user success) that is the percentage of tasks correctly completed by the user [18]. To measure the success rate of users in each dimension can be used the following formula:
Dimension(%) = total multiplication x100% maximum score
(1)
Total multiplication results obtained from the multiplication of the scale by the number of respondents, while the maximum score obtained from multiplying the number of respondents with the total problem per dimension and the highest scale. Table 3 is the image summary data questioner for correctness dimension. From Table 3, it can be seen respondent taken that qualify in providing answers, on each item of the question. The Respondent provides value is empty, is not considered valid, and is not counted in the assessment. C1, C2, C3, C4, and C5 is grain questions on correctness dimension. TABLE 3. SUMMARY DATA DIMENSION OF CORRECTNESS No.
Respondent
1 2 3 4 5 6 7 8 9 10 11 12 13 14 15 16 17 18 19 20 21 22 23 24 25 26 27 28 29 30
Lecturer Lecturer Lecturer Lecturer Lecturer Student Student Lecturer Student Student Staff Lecturer Lecturer Student Student Staff Lecturer Student Lecturer Lecturer Lecturer Lecturer Lecturer Lecturer Student Student Student Student Staff Lecturer
C1 5 5 5 4 5 5 4 5 4 4 5 4 4 3 5 5 5 4 4 4 4 4 4 5 4 4 4 4 5 5
Correctness C2 C3 C4 5 5 5 5 5 5 4 5 5 4 5 5 5 5 5 5 5 5 4 5 4 3 4 4 4 4 4 4 5 5 5 5 4 4 4 3 3 3 4 3 4 3 5 5 5 5 5 5 5 5 5 4 5 4 5 5 4 4 4 4 4 5 4 4 4 4 4 4 5 4 4 4 5 5 4 4 4 4 4 4 4 4 4 4 5 5 5 5 5 4
C5 5 5 5 5 5 5 4 4 4 4 5 3 4 4 5 5 5 5 5 5 4 4 4 4 5 4 4 4 5 4
Using the formula in the equation (1), and referring to Table 3, for dimensions of correctness can be obtained as follows: the total score was 662.The total score of dimensions, derived from sum score given by the participant. The maximum score a dimension, in the dimension of correctness, derived from the number of respondent x amount of grain test x score highest. The maximum score on the correctness dimension of 750. Using the equation 1, obtained results 662/750 * 100%. The value dimension of correctness is 88.3%. In the same way, we do the processing of data on the dimensions of efficiency, reliability, integrity, and usability. From the above equation, we get the result of correctness dimension value, equal to 88.3%. Value dimension of efficiency equal to 83,5%, value of reliability dimension is 86%, usability dimension value equal to 86,5% and value of dimension of integrity equal to 81,1%.
22
Inda D Lestantri & Rosini Journal of Information Systems Engineering and Business Intelligence, 2018, 4 (1), 18-24
Measurement of software quality according to McCall is grouped into 3 categories, such as product operation category. The measurement of product operation is calculated using the formula: OperationProduct(%) = (C+U+E+I+R) x100% 5 Where : C is Correctness, U is Usability, E is Efficiency, I is Integrity, R is Reliability
(2)
With reference to the equation (2) obtained the value of the Quality of Product as follows : OP(%) = (88,3+83,5+86+86,5+81,1) x100% 5
(3)
From the calculation results obtained operation product value of 85.09%. This shows that the software we tested has good quality in terms of dimensions of correctness, usability, efficiency, reliability, and integrity. From the test in the e-SAP application shows that the correctness has a significant positive effect on product quality, the integrity has a significant positive effect on product quality, the reliability has a significant positive effect on product quality and usability has a significant positive effect on product quality. IV. DISCUSSION According to McCall measurement of product operation quality is influenced by 11 factors, i.e. efficiency, correctness, usability, reliability, integrity, maintainability, flexibility, testability, reusability, interoperability, and portability. In this research, software measurement is done on 5 factors, i.e. correctness, efficiency, usability, reliability, and integrity. From the explanation above can be seen that the dimensions of correctness, usability, efficiency, integrity, and reliability have an influence on product quality. Evaluation to measure software quality needs to be done in order to improve software performance. Evaluation of software quality measurement can be done gradually. Software quality measurements can be performed in a development environment in order to gain feedback on software functionality before the software is tested in an operational environment. If at the time of measuring the quality of the software in the operational environment to get good results, the software can continue further testing, beta testing. Beta testing is used to test the software in accordance with the operating environment conditions. Further research that can be developed from this research is to analyze the relationship between software quality with an improvement of organizational performance. What is the quality of software that affects organizational performance? To improve application performance can be done by measuring software quality. Software quality measurements can be performed at an alpha testing stage before beta testing. I. CONCLUSIONS Tests have been performed on e-SAP applications covering five dimensions, are correctness, efficiency, reliability, integrity, and usability. The result of each dimension.The result of correctness dimension value, equal to 88.3%. Value dimension of efficiency equal to 83,5%, value of reliability dimension is 86%, usability dimension value equal to 86,5% and value of dimension of integrity equal to 81,1%. The result of this research is e-SAP application has good quality with product operation value equal to 85%. The dimension of correctness, usability, efficiency, integrity, and reliability have a significant positive effect on product quality. The software can continue further testing, beta testing. Beta testing is used to test the software in accordance with the operating environment conditions. To improve application performance can be done by measuring software quality. Software quality measurements can be performed at an alpha testing stage before beta testing. REFERENCES [1] James A Hall and Tommie Singleton, Information Technology Auditingand Assurance, 2nd ed.: Thomson Learning, 2007. [2] Richard Heeks, "Information Systems and Developing Countries: Failure, Success, and Local Improvisations," The Information Society, vol. 18, no. 2, 2002. [3] M. Pikkarainen, J. Haikara, O. Salo, P. Abrahamsson, and J. Still, "The impact of agile practices on communication in software development," Empirical Software Engineering, vol. 13, no. 3, 2008. [4] Timo OA Lehtinen, Mika V. Mäntylä, Jari Vanhanen, Juha Itkonen, and Casper Lassenius, "Perceived causes of software project failures – An analysis of their relationships," Information and Software Technology, vol. 56, no. 6, pp. 623-643, 2014.
23
Inda D Lestantri & Rosini Journal of Information Systems Engineering and Business Intelligence, 2018, 4 (1), 18-24
[5] Manuel Brhel, Hendrik Meth, Alexander Maedche, and Karl Werder, "Exploring principles of user-centered agile software development: A literature review," Information and Software Technology, vol. 61, pp. 163-181. [6] Indra Kharisma Raharjana and Army Justitia, "Pembuatan Model Sequence Diagram dengan Reverse Engineering Aplikasi Basis Data pada Smartphone untuk Menjaga Konsistensi Desain Perangkat Lunak," JUTI: Jurnal Ilmiah Teknologi Informasi, vol. 13, no. 2, 2015. [7] Mark Keil, Paul E. Cule, Kalle Lyytinen, and Roy C. Schmidt, "A framework for identifying software project risks," Communications of the ACM, vol. 41, no. 11. [8] Mica R. Endsley and Debra G. Jones, Designing for Situation Awareness: An Approach to User-Centered Design. Boca Raton: CRC Press, 2004. [9] Agus Hermanto, Fridy Mandita, and Supangat, "Evaluasi Usabilitas Layanan Sistem Informasi Akademik Berdasarkan Kombinasi ServQual dan Webqual Studi Kasus : SIAKAD Politeknik," Journal of Information Systems Engineering and Business of Intelligence, vol. 3, no. 1, pp. 33-39, April 2017. [10] W E Senjaya, T Witono, and N Alkhala, "Testing Perancangan dan Usability Aplikasi Pengelolaan Laboratorium Komputer," Journal of Information Systems Engineering and Business Intelligence, vol. 3, no. 2, pp. 101-106, Oktober 2017. [11] Usman Ependi, Febriyanti Panjaitan, and Hutrianto Hutrianto, "Sistem Usability Scale Antarmuka Palembang Guide Sebagai Media Pendukung Asian Games XVIII," Journal of Information System Engineering and Business of Intelligence, vol. 3, no. 2, pp. 80-86, Oktober 2017. [12] Triyanto and A Charolina, "Pengujian Kualitas Website Universitas Sahid Surakarta Menggunakan Metode McCall," Gaung Informatika, vol. 4, no. 2, Juli 2011. [13] Ni Made Satvika Iswari, "Review Perangkat Lunak StarUML Berdasarkan Faktor Kualitas McCall," Jurnal ULTIMATICS, vol. 7, no. 1 , pp. 72-81, Juni 2015. [14] Erni Dwi Pratiwi, "Faktor yang Mempengaruhi Niat Menggunakan Instagram dengan The Theory Of Reasoned Action Menggunakan Amos 21," Jurnal Teknik Komputer AMIK BSI, vol. 2, no. 1, pp. 68-77, Februari 2016. [15] Saifudin Azwar, Reliabilitas dan Validitas, 4th edition. Yogyakarta: Pustaka Pelajar, 2012. [16] Imam Ghozali, Aplikasi Multivariate Dengan Program SPSS. Semarang: Universitas Diponegoro, 2009. [17] Suhar Janti, "Analisis Validitas dan Reliabilitas dengan Skala Likert Terhadap Pengembangan Si/Ti dalam Penentuan Pengambilan Keputusan Penerapan Strategic Planning pada Industri Garmen," in Conference Proceedings, Yogyakarta, November 2014, pp. 155-160. [18] J Nielsen. (2001) Success Rate: The Simplest Usability Metric. [Online]. http://ww.nngroup.com/articles/success-rate-the-simplest-usabilitymetric/
24