Institute of Mathematics and Computing Science. Makerere University ... Software visualization is the use of interactive computer graphics, typography, graphic ...
Evaluation of Software Visualization Tools: Lessons Learned Mariam Sensalire and Patrick Ogao Faculty of Computing and IT Makerere University Kampala, Uganda
Alexandru Telea Institute of Mathematics and Computing Science University of Groningen the Netherlands
Abstract Many software visualization (SoftVis) tools are continuously being developed by both researchers as well as software development companies. In order to determine if the developed tools are effective in helping their target users, it is desirable that they are exposed to a proper evaluation. Despite this, there is still lack of a general guideline on how these evaluations should be carried out and many of the tool developers perform very limited or no evaluation of their tools. Each person that carries out one evaluation, however, has experiences which, if shared, can guide future evaluators. This paper presents the lessons learned from evaluating over 20 SoftVis tools with over 90 users in five different studies spread on a period of over two years. The lessons covered include the selection of the tools, tasks, as well as evaluation participants. Other discussed points are related to the duration of the evaluation experiment, its location, the procedure followed when carrying out the experiment, as well as motivation of the participants. Finally, an analysis of the lessons learned is shown with the hope that these lessons will be of some assistance to future SoftVis tool evaluators.
1
Introduction
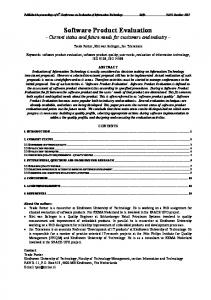
Software comprehension is a necessary but difficult activity for many people working with large amounts of source code [Rajlich and Wilde 2002]. When trying to understand large programs, it is not easy to get the complete picture just by browsing through the code, as a lot of information can be easily missed [Keown 2000]. This includes a variety of information, such as object-oriented inheritance hierarchies, specific usage of class methods, and the presence (or absence) of certain design patterns. In order to ease this process, many aiding tools have been suggested. Among these, software visualization (SoftVis) tools occupy a prominent place. In this context, we refer to a tool as being a SoftVis tool following the definition of software visualization from [Price et al. 1993]: Software visualization is the use of interactive computer graphics, typography, graphic design, animation, and cinematography to enhance the interface between the software engineer or the computer science student and their programs. In order to determine how effective a SoftVis tool is, it is advisable for it to be evaluated [Di Lucca and Di Penta 2006; Knight 2001; Shneiderman and Plaisant 2006]. There is large consensus in the software visualization and also in the broader information visualization community that a lack of proper evaluation that can demonstrate the effectiveness of tools is detrimental to the development of the field [Koschke 2003; Reiss 2005; Lorensen 2004]. Results from the evaluation can be used to feed the iterative development process [Di Lucca and Di Penta 2006] as shown by Figure 1, thus increasing the chances of tools to be effective in practice. We call here a SoftVis tool effective if it enables its users to achieve results in an easier and faster way compared to the traditional method of doing the same task [Knight 2001; Hundhausen et al. 2002]. When carrying out SoftVis tool evaluations, a lot of information in generated by the tool evaluators. This includes the task completion duration, the accuracy of the responses, the users’ views of the tools, as well as tool aspects that may need improvements. De-
Figure 1: Software Visualization Tool Cycle
spite the availability of all this information, the experiences gained throughout the evaluation process, as well as the lessons learned during the execution of the evaluation process itself, are rarely reported; emphasis is mainly being put on the results of the evaluation, not the process itself [Murphy et al. 1999]. Sharing of such process experiences can however be very helpful in improving future studies [Pfleeger 1995; Storey 1998]. In this paper, the lessons learned from evaluating over 20 SoftVis tools in five different studies with over 90 developers in total, are shared with the hope that they can guide future tool evaluators. The focus here is on the important aspects that influence the quality (or lack thereof) of the evaluation process itself, rather than on how to design a specific evaluation for a specific tool or task (e.g. program comprehension or maintenance). The rest of this paper is organized as follows. Section 2 reviews previous work in the area of SoftVis tool evaluation as well as ealier advice on how the process should be carried out. This section also shows how the previous work differs from what is presented in this paper. Section 3 then details the lessons learned while evaluating over 20 SoftVis tools with a large group of software developers. Section 4 relates our learned lessons with the field of software comprehension, and Section 5 relates our results with the field of empirical software engineering. Section 6 outlines the limitations of the approach used in this paper. Finally, Section 7 concludes the paper with directions for future research.
2 Previous Work Several studies have described both SoftVis tool evaluations as well as points on how to improve the evaluation process itself. Since it is not possible to review all these studies, we focus here mainly on those which detail the evaluation process itself (and the lessons learned from this process). Indeed, we are not interested in evaluating a specific visualization tool or set of tools. Rather, our interest here is to understand which are the factors that influence the evaluation process itself. Pacione [Pacione et al. 2003] evaluated five dynamic SoftVis
tools in relation to program comprehension questions. In that study, a lot of emphasis was put on the tools as well as the results of the evaluations, clearly showing how each tools preformed in relation to the criteria used. Despite this, there was little information on the evaluation procedure, the challenges faced, as well as recommendations on how to carry out a similar evaluation. Several such studies exist, targeting specific tools. While valuable for those interested in the effectiveness of the evaluated tools, they are less useful for those interested in setting up new evaluations for a different set of SoftVis tools. Using empirical studies to determine what programmers need from a tool, and thereby support tool design, is addressed in detail in [Sillito 2006; Sillito et al. 2008]. Our work here differs from such research in that we are mainly interested in aspects of how to set up a good SoftVis tool evaluation in general rather than how to set up an evaluation that determines which features make a tool good. Bassil and Keller [Bassil and Keller ] also carried out an evaluation of seven commercial as well as academic tools using the taxonomy of Price, in which the level to which the tools measured against the taxonomy was shown. The authors were the main evaluators; information on the challenges faced during the evaluation was not explicitly shared. There are other researchers that made various suggestions related to improving experiments. Ellis and Dix [Ellis and Dix 2006] suggested many ways in which information visualization evaluations can be improved. These included evaluating for the sake of discovery as opposed to proving that one’s system is the best; measuring variables that contribute to the aim of the evaluation; evaluating the whole tool as opposed to only its best features; and balancing between qualitative and quantitative evaluations. These recommendations were made after reviewing 65 papers that described new visualization techniques and finding that less than 20% of the authors had carried out evaluations. This trend was also observed earlier by Tory and M¨oller [Tory and Moller 2004], who noted that very few papers published in IEEE TVCG had a ‘human factor’ component, as shown by Figure 2, yet humans are important both in the design as well as evaluation of visualization tools.
Figure 2: Papers from the IEEE Transactions on Visualization and Computer Graphics (TVCG) deemed to evaluate human factors One of the reasons for this low percentage could be the lack of guides on how these evaluations can be carried out effectively and efficiently. As such, it is important for those that do evaluate their tools to share their experiences. This is the main goal of this paper. On the other hand, Kraemer et al [Kraemer 2008] mention several lessons learned in carrying out various evaluations and empirical studies. Some of these included encouraging the use of interviews and think-aloud studies to obtain feedback on site as opposed to surveys; noting that observational studies are time consuming,
but are fruitful; and showing a set of advantages of think-out-loud protocols, e.g. the variety of information that is generated from this method, leading to many possible ways to analyze the data. Along our interests, the main lessons learned from Kraemer et al [Kraemer 2008] are considering surveys, interviews, observational studies and think-aloud studies. These lessons were gained from carrying out studies in program visualization, algorithm animation, visualizing software engineering diagrams (with a focus on concurrency), as well as various database web interfaces and tools. In this paper, our emphasis is strictly on SoftVis tools. Shneiderman [Shneiderman and Plaisant 2006] suggested multidimensional, in-depth, long-term case studies as the way forward when carrying out information visualization tool evaluations. This procedure involves identifying 3..5 domain experts that can take part in the evaluation which can run from several weeks to months. In this period, the experts would use the tools under study. At the end of the period, they would provide feedback. Next, the feedback would be used to improve the tools. The work presented in this paper builds on Shneiderman’s model, but restricts it to the narrower context of SoftVis tools only. O’Brien et al [O’Brien et al. 2005] take a broader perspective and observe how to empirically study software practitioners. They advise against certain negative trends that could take places within the studies. Some of these include setting up experiments that were not naturalistic in nature, as well as not combining qualitative as well as quantitative evaluations. While the work in [O’Brien et al. 2005] targets program comprehension in general, we (again) restrict ourselves to SoftVis tools in this paper.
2.1
Input studies
Three studies were carried out previously by the authors of this paper over a period of two years. In the first study, expert programmers were exposed to three Softvis tools and asked to carry out some comprehension and maintenance tasks related to objectoriented software [Sensalire and Ogao 2007b]. Afterwards, their feedback was collected on what could be improved in the tools; the results categorized into a model of desirable requirements for the evaluated tools. In the second evaluation, the model generated from the first study was compared against ten SoftVis tools in order to see the level to which they measured up to the model [Sensalire and Ogao 2007a]. The participants were expert software developers. The results from the evaluation were recorded as well and used to refine the model. The third evaluation study we performed was specific to SoftVis tools that support corrective maintenance [Sensalire et al. 2008]. In this third study, fifteen Softvis tools, picked to match the model from [Sensalire and Ogao 2007b; Sensalire and Ogao 2007a], were evaluated by industrial experts in order to determine which of the provided features were desirable for the users. This third study also served as a validation of the predictive power of the tool selection model. These three studies were guided by the first two authors and involved software developers at their site (Kampala, Uganda). A second source of information are our studies carried out in the area of visualizing software evolution. Here, we used the CVSgrab [Voinea and Telea 2006] visualization tool and a number of text-based tools such as TortoiseSVN [TortoiseSVN 2009], to examine the evolution of several large open-source repositories, the most important being KDE Office and Mozilla. The users were CVSgrab’s own developers, and over 45 students from two different generations at the University of Groningen, the Netherlands, who had no prior exposure to this visualization tool. A number of specific tasks were given to the users (for details, see [Telea 2008]. The results, summarized as 20-page reports, were gathered and analyzed. From the users’ feedback, lessons were distilled as to the success of setting up this experiment. this fourth study was guided by the last author and involved students at his site (Groningen, the
Netherlands). A third source of information are our studies carried out in the area of UML metric-and-diagram visualizations. Here, we used an own UML viewer, modified to allow display of software metrics, to accomplish a number of program understanding and design quality assessment tasks [Byelas and Telea 2009a; Byelas and Telea 2006; Byelas and Telea 2009b]. This fifth study involved around 35 participants from both the academia and the software industry, and was spread, in its different phases, over a period of approximately two years in the framework of an academic-industry research project [Trust4All 2007]. The aim of the study was, first, to assess the understandability of novel methods to visualize software metrics combined with UML architecture diagrams, and secondly to assess the effectiveness of the combined solution in performing a number of program comprehension tasks supporting adaptive and perfective maintenance. The study took place at the University of Eindhoven, the Netherlands. The three studies outlined above had some overlap in the subjects involved in them. There was no overlap with the subjects involved in these first three studies and those of the latter two studies, and no overlap between the subjects in study 4 and study 5. The only overlap between the latter two was the participation of the evaluator (the last author). Interestingly, there were strong correlations from the lessons learned from all above tool evaluation studies, even though there is arguably a great difference between the culture of the programmers involved (Uganda vs the Netherlands; and industry vs academia), the types of visualization tools being evaluated (IDE-based tools for corrective maintenance; UML architecture and metric tools; and repository visualization tools), and the types of tasks aimed at. These lessons learned are presented next in Section 3 with the aim of helping future researchers who intend to carry out similar studies.
3
Lessons Learned
After analyzing the results of the four studies outlined in Sec. 2.1, gathered from user written and oral feedback, as well as the observations of the evaluators themselves (the authors), we structured the lessons learned along ten dimensions. Each dimension is described in one of the following sections. Below, we only outline points which were strongly exhibited in all the four studies performed, and which are relevant to the majority of the evaluated tools and involved users.
3.1
Tool selection
When carrying out evaluations, the first step is usually deciding which SoftVis tools to evaluate. It is important that the tool selection is done with a clearly predefined motive, as it may not be possible to evaluate all the SoftVis tools that exist. Different types of motives will determine different styles, and set-ups, of the evaluation process, as follows. If the motive is to evaluate techniques, like in [Telea 2008], then tools that use each of the techniques under evaluation may need to be chosen and later measured against each other. If the motive is to evaluate the effectiveness of a software visualization tool for a software engineering task, strictly looking at the visualization tool is definitely not enough. The effectiveness of such a tool is strongly influenced by the amount of integration thereof in an entire workflow, which implies evaluating the communication with other established tools [Koschke 2003]. In this case, we noticed that it only makes sense to evaluate tools that have comparable amounts of integration within the same workflow and toolset, as developers experience using weakly-integrated tools as highly disruptive [Sensalire and Ogao 2007b; Sensalire and Ogao 2007a]. Finally, when comparing functionally identical tools, with the aim of selecting a ‘winner’, the focus should be on the tool itself and less on the integration
aspects [Telea 2008]. While this is feasible, with some effort, the insights gained from such an evaluation are naturally limited to the set of tools being compared. Finally, we noticed the important impact the tool audience has. It is risky to compare tools whose target audience differs, e.g. tools targeted towards novice users such as Jeliot [Kannusmaki et al. ] against tools aimed at professional developers such as CodeProAnalytix. From the reactions of the involved participants in our four studies, we noticed that this, first and foremost, causes confusion for the users themselves, as they have trouble positioning themselves in a clear way against the tool (as novices, or professionals, respectively).
3.2
Participants
While many people may volunteer for the evaluation, it is essential to get a pre-study screening procedure that is in line with the objectives of the study. This ensures that participants that will be helpful to the evaluation at hand are selected. For a counter-example, in a related study on visualizing annotations on UML diagrams [Byelas and Telea 2009a], we involved a wide range of users including fresh graduates, PhD students, seasoned researchers, and professional developers with over 10 years of experience. After that study, we had to post-filter results based on the developer experience, as several of those delivered by the inexperienced developers were suboptimal and would have biased the study’s results. In [Sensalire and Ogao 2007b], studying SoftVis tool integration with IDEs such as Visual Studio was important, so accepting participants with limited knowledge of that IDE would greatly affect the results of the study. Precious time will be spent trying to bring the participants knowledge to an acceptable level instead of carrying out the core experiment. Pre-selection can be done with the aid of a questionnaire that asks about the knowledge of the willing participants [Sensalire and Ogao 2007b; Sensalire and Ogao 2007a]. We found this method better than pre-selection based on the professional level (years of experience in the field). People with identical amounts of experience years can have widely different skills, as it was evident in the software evolution study [Telea 2008]. Finally, it is very important to use tool evaluators that are similar, or identical, to the final target group of the tool. It may not be appropriate to use students for a tool that is targeting industrial practitioners [Ellis and Dix 2006; Byelas and Telea 2009a], as they may not have the background to provide useful feedback. For this reason, our evaluations described in [Sensalire and Ogao 2007b; Sensalire and Ogao 2007a] involved only industrial participants. However, in other cases, the tasks to be completed are more focused and easier to understand even by users with limited experience, such as the repository visualization study [Telea 2008]. If developers with a wide experience-level spread are involved, a post-study classification, or weighting, of the results based on the experience, is a good correction factor [Byelas and Telea 2009a].
3.3
Tool exposure
To be able to get the most out of the experiment, the participants should be allowed sufficient time to study and understand the SoftVis tools that they are going to use. In one of our experiments, the participants were given 15 minutes to study the tools before carrying out their tasks [Sensalire et al. 2008]. More than half of the evaluators later complained that the tool exposure duration was too short and advised longer exposure durations days before the actual evaluation, a point also noted by Plaisant et al. in a different context [Plaisant 2004]. The learning phase does not need to be contiguous, but has to be of sufficient duration. For the tools we evaluated in our four studies, a learning phase of at least a few hours, spread over maximally a week, seems to be sufficient. Spreading the learning phase is also helpful for highly experienced IT person-
nel that have very busy schedules. They require flexibility in order to learn the tool at their own time without the perceived pressure. Novices may even need a longer tool learning phase. This was also noted by Marcus et al. [Marcus et al. 2005] who had students perform poorly during the evaluations due to their low tool exposure duration. The advantage with students, however, is that they are more willing to ask when they do not understand and are more comfortable with slightly longer training durations. In [Telea 2008], the learning phase for the involved over 45 students was of roughly four full days, spread over a period of 6..8 working days. Overall, it is not advisable to expect the participants to learn the tool minutes before the experiment. This is very hard and does not also reflect the real life scenarios. An exception to this would be cases where the objectives of the evaluation require short durations for learning the tools, like in [Byelas and Telea 2009a], where the learning phase was approximately 20-30 minutes, due to the simplicity of the demanded task. We also strongly encourage on reporting the learning phase duration in publications involving user studies, as an added measure of the confidence in the evaluation’s results.
3.4
Task selection
Tasks are an essential part of tool evaluations. There are many ways in which these tasks can be selected. Regardless of the method used, however, the tasks should be reflective of the scenario being simulated in order for the evaluation to be helpful. An example would be a case where a tool is being measured for its ability to answer software maintenance questions. We see several axes along which task selection can be carried out, thereby influencing the purpose of evaluation, as follows. Task author: users vs owners The tasks can be generated by the tool user or tool owner. By the owner, we mean here the person that is interested in the evaluation results, be it the tool builder or a third party like a researcher interested in tools usability. If tasks are generated by the users, e.g. software maintainers, then these will naturally include questions that they are usually faced with during their work. These tasks/questions can be given to additional tool participants along with the tools and then observed to see if they can indeed answer them, as long as the participants share the same working environment and goals as the original task author. This was the scenario taken in [Telea 2008], where we pre-selected the tasks from earlier discussions with KDE developers [Voinea and Telea 2008]. The chief advantage of this method is that a positive evaluation is a very strong signal in terms of usability. Alternatively, tasks can be generated by the tool owners. When this method is used, it is advisable for either these tasks or their solutions to be validated by the domain experts, as done e.g. in [Voinea and Telea 2008]. Failure to do this may pose the risk of generating tasks that are either irrelevant, too simple or too difficult for the target participants, or biased to reflect the tool under evaluation. This may in turn affect the evaluation by reducing its ability to reflect the reallife scenario. This type of task generation seems predominant in research papers where authors aim to gather a-posteriori evidence for the design choices of their proposed tools. Task type: discovery vs maintenance There are numerous types of tasks in software engineering where SoftVis tools can help, and thereby many ways to classify SoftVis tools [Diehl 2006]. Within our tool evaluations, we have found a marked difference between tasks involving program discovery and program maintenance. By program discovery we denote the subset of comprehension activities that enable one to get familiar with an unknown code base. We noticed that programmers that maintain their own code, usually for long periods of time, have much less need for tools that support generic discovery activities such as showing the overall structure of the software or presenting evolution trends. The needs here go towards detailed support for precise, fine-grained activities
like debugging, refactoring or optimization. In contrast, tools that support discovery activities have a different aim: enable the user to get familiar with a wide range of aspects of a given system. Setting up evaluations for tools in the two classes (discovery and maintenance) is also different. For discovery, it is harder to quantify the effectiveness of a tool (how can one measure if a tool is effective in discovering if it is not known what one is looking for?) For maintenance, it is easier to measure a tool’s effectiveness, as the tasks are more precise, so one can quantify e.g. the duration or precision of a task’s completion using a given tool. We also noticed that the above two task selection dimensions correlate with the two types of participants (see Sec. 3.8 further): professionals are interested in defining the tasks to be supported and focus more on maintenance and less on discovery; tools supporting discovery and tasks generated by tool owners are mostly evaluated in academic and research environments. We believe, although we do not have hard evidence, that there is a direct correlation between the task selection (when defining tool evaluations) and the perceived value of the tool evaluation. In terms of the lean development philosophy [Poppendieck and Poppendieck 2006], the value of a SoftVis tool evaluation would be different for industrial users and academic groups. For industrial users, the value is in obtaining measurable improvement in supporting an ongoing software engineering activity. For academic groups, the value is often in obtaining evidence supporting a novel tool design. The two notions of value should meet (a tool is valuable when it measurably supports a valuable task). However, many SoftVis tool evaluations, including ours for a large extent, entirely cover the above implication.
3.5
Experiment duration
It has been advised in the past that tools be studied over long periods of time, e.g. months, in order to fully assess their capabilities [Shneiderman and Plaisant 2006]. From our studies, however, we have noticed that there are certain durations beyond which most tool participants become reluctant to continue as the benefit of carrying on with the evaluation becomes less obvious for them. This is manifested during the process of recruiting evaluators, with many asking the duration of the experiment. We have noticed, for example, that expert programmers or industrial participants are not comfortable with very long durations [Sensalire and Ogao 2007b; Sensalire and Ogao 2007a; Byelas and Telea 2009a]. For our studies, 2-3 hour experiments were generally encouraged by this group excluding the time taken to learn the tool. Researchers in the past who have worked with students have managed to use longer experiment durations. Lattu et al. [Lattu and Tarhio 2000] were able to train two sets of students for 52 hours and a second group for 12 hours as part of the evaluation. This training was done in form of introductory programming courses both at university and high school. In [Telea 2008], the total study duration tool 2-3 weeks per participant. Similar results are shown by Haaster et al. [Van Haaster and Hagan 2004]. Overall, experiments involving only students can be set up in line with the students’ course contents, so longer durations are possible. This is harder, or even unachievable, for industrial participants.
3.6
Experiment location
One of the factors that can affect a tool evaluation is the location of the experiment. In our previous studies, we have had both labbased experiments as well as ”mobile” evaluations that could be taken to the evaluators location [Sensalire and Ogao 2007b; Sensalire and Ogao 2007a]. We have observed that when working with experts, preference is given to their workplace. The inconvenience on the participant is reduced as they can continue with their usual work immediately after the experiment. In order to entice industrial users to participate in rigid experiment set-ups located in labs, the
incentives given to them may need to be higher than for the in-place set-ups. Previous researchers who have worked with students have used university premises [Lattu and Tarhio 2000; Lawrence et al. 1994; Van Haaster and Hagan 2004; Telea 2008]. This is mainly due to the nature of the experiment setups as explained in Section 3.5. Finally, in mixed academic-research studies such as [Byelas and Telea 2009a], using the project meetings to schedule the experiments proved very convenient. All in all, we hypothesize that locations that provide the least bother, and least time consumption, for the participants are the ideal ones for such tool evaluations.
3.7
Experiment input
Depending on the motive of the evaluation (Sec. 3.1), there are many ways in which the actual experiment can be carried out. These may include measuring a tool’s ability to solve a program comprehension task or comparing several SoftVis tools. In all our experiments, the input was a given system’s source code, except for [Byelas and Telea 2009a], where the input was a set of UML diagrams. When source code is analyzed, this code should be reflective of the tool’s target in order for realistic results to be achieved. As Hundhausen [Hundhausen et al. 2002] noted, however, there are tools developed whose authors are not sure of the targeted group, a phenomenon termed as system roulette. When evaluating such systems, it can be challenging to decide the type of code to be used for the input. Regardless of this, care should be taken to ensure that the code selected does not bias the experiment in any way. Examples of this bias include using code that some participants have prior knowledge of, experimenting with very simple code for a tool that should be targeting large scale code, or conversely. For example, our studies described in [Voinea and Telea 2008; Sensalire and Ogao 2007b; Sensalire and Ogao 2007a] all targeted small-to-middle size code bases (under 10 KLOC), while the repository evolution study in [Voinea and Telea 2008] targeted large repositories of millions of LOC. As such, issues such as optimization, speed of processing, and stability were mentioned as essential by the subjects involved in the repository study, whereas none of these were mentioned by the users involved in the other studies we performed, given the much smaller size of the input datasets.
3.8
Participants motivation
Motivation is an important element of SoftVis tools evaluations and should thus be planned and taken into account for when organizing such a study. Depending on the group that one is working with, different forms of motivation may be used. When working with professionals, one should keep in mind that this group already holds jobs that are paying them on an hourly or monthly basis. As such, motivation may need to be equated to tangible benefits at the study’s outcome. These may be in terms of learning to use a tool that will provide measurable benefits in the regular work activities after the study is completed, or possibly also financial incentives. In our studies, we tried both types of motivation [Voinea and Telea 2008; Sensalire and Ogao 2007a], and we cannot say that one motivation type is definitely more successful than the other one. There is, however, another group of professionals who have some experience in academia. These include PhD holders who are in industry, as well as academic staff that also double as consultants or developers. Some of our industrial participants in [Byelas and Telea 2009a] were in this category. This group is at times willing to take part in studies for the sake of gaining knowledge and may require less or no additional motivation. However, for all industrial users, we noticed that a clear added value for the participants must be present in the study set-up to motivate them to take part. Motivation for students differs considerably. In previous experiments [Marcus et al. 2005], students were motivated using extra
credits for their course project. Experiments which were structured in form of course work did not have major motivation hurdles, as the students had to complete the course as part of their programs [Telea 2008]. However, from our experience, we noticed that this ‘implicit’ motivation of students does also usually imply a less critical attitude towards the tools involved in the study, as they do not identify themselves strongly with future tool users. Regarding motivation, an essential point in doing evaluations of software visualization tools, or other software engineering tools for that matter, regards correlating the tool’s provisions with the users’ needs. It may sound obvious that any tool evaluation will be validated in measuring how well a tool actually satisfied a concrete need of a concrete user. However, to be able to quantify that, the users should have some concrete stakeholding in the analyzed software. This correlates with the above user categories: Professionals would rarely give a truly positive evaluation of a tool unless that solves problems on their own software. One may think that to be less true for students. In our experiments, we had both categories: professionals used the evaluated visualization tools on software they were actively working on, and expressed clearly that tool usability has to be proved on that software, not a third-party one. For the students, we used a mixed population: some of our participants were active KDE developers (so knew the software under study), whereas the others were not familiar with the visualized systems. As a global comment, we noticed clearly that users familiar with a code base will be significantly more strict when evaluating a visualization tool (as they have very specific questions and wishes) than users unfamiliar with the code. This opens the question: is it, then, meaningful to let users evaluate a SoftVis tool on input code in which they have no explicit interest? From our experience, the answer is that this is possible, but only when the SoftVis tool addresses general program comprehension tasks. In that case, it makes sense to evaluate the tool on ’unknown’ code bases. However, if the tool’s claims are of different nature, e.g. support maintenance, refactoring, or assessing code quality, for example, then it is necessary for the tool to be evaluated by users holding a stake in, thus familiar with, the tool’s input.
3.9
Evaluators relationship with the tools
In many cases, the tool developers are in a better position to evaluate their tools since they are very familiar with it, as it was the case in e.g. [Voinea and Telea 2008]. The learning curve is practically zero in such cases, and there is high confidence in the quality of the results obtained. However, there are some dangers with this route. Apart from the problem of bias from the evaluators side, if participants know that the evaluator developed the tool, they will be generous with compliments while minimizing criticism. We noticed this effect relatively strongly in [Telea 2008]. This, in turn, can create false positives about either the technique or the tool being looked at thus reducing its chances of being improved. In order to get the most objective results, its advisable for the evaluator to be as detached as possible from the tool being evaluated. This can be done by letting a different person supervise the evaluation of the tool or not informing the participants who developed the technique or tool under evaluation. This was the route taken in [Byelas and Telea 2009a]. In that study, we noticed no difference in the qualitative output of the participants between participants who knew the (non-disclosed) developers of the studied technique and those who had no relation whatsoever with the developers. In our other studies involving student populations [Telea 2008], the tool under evaluation was originally developed by the main course lecturer, also one of the authors of this paper. To eliminate bias, we used a slightly different version of the tool, and presented it under a different name and provided it from a third party. Although it was relatively easy for the participants to determine the connec-
tion of the tool with the course lecturer, and thus generate positive bias, this was apparently not the case. All 45 student reports, with no single exception, contained clearly critical observations on the ineffectiveness of the evaluated tool with respect to certain tasks. However, we found an important element in student evaluations to be the decoupling of the evaluation itself from the success of completing the task. From previous tool evaluations done with student populations, we found that students are either positively or negatively biased when the assignment’s goal is the completion of the task, depending on the student’s success in completing, or failing to complete, that task. In [Telea 2008], we found that this bias can be eliminated by structuring the assignment in terms of describing the results of a number of actions done with the tool, and asking the users to comment on their findings (whatever those are), rather than stressing on obtaining some results with the tool, and asking the students to describe those results.
3.10
Analysis of results
As a final point learned during the five tool evaluation studies we performed, there is a lot of data that a study can generate, and the evaluator has to interpret. In order for this evaluation to be beneficial to a potential adopter of the evaluated tools, or to the developers of the tools, the results should be analyzed in direct relation to the objective of the study (the task). If visualization techniques are the ones being analyzed, the results should clearly indicate which of the analyzed techniques is better than the other and also offer potential reasons why. This is very important as many practitioners are only concerned about the results as opposed to the procedure itself. Here, tool integration is less crucial than when one evaluates a tool’s effectiveness for solving a given task, which is discussed below. However, the relation of a visualization tool and software engineering task is rarely a direct one, the tool being effective for that task only as part of a tightly integrated toolset and workflow, as outlined already in Sec. 3.1. In that case, we see no other reliable and generic solution than to spend the added effort to achieve this integration prior to the evaluation. This is the road we have taken, for example, in [Telea 2008], where the repository visualization tool is tightly integrated with the software configuration management (SCM) system used (CVS or Subversion) and also with several software quality metric tools. A similar route was taken in [Byelas and Telea 2009a; Byelas and Telea 2006], where the targeted UML visualization tool can be used as a drop-in replacement for other similar UML tools such as Poseidon.
4
Comparison of lessons learned with software comprehension studies
Software visualization is a supplementary method in the field of software comprehension. This section compares work in the area of evaluating software comprehension tools in order to see how it relates with what has been presented for software visualization. The need for tool evaluation was noted to be important for software comprehension with a call on tool evaluators to share their best practices in order to aid other research groups carrying out similar studies [Di Penta et al. 2007]. Our best practices for SoftVis tool evaluation presented here are in line with the recommendation made by Di Penta [Di Penta et al. 2007]. In a related study, Di Lucca et al. [Di Lucca and Di Penta 2006] identified the factors that affect the settings of software comprehension experiments. These included the variables measured for the experiment, the subjects used, the experimental design, the instrumentation as well as the packaging of the experiment. These factors were identified in an effort to have a working session where best practices would be identified in relation to each area identified. While Di Lucca’s proposal was in software comprehension, we see most of the factors named there appearing in the evaluation of SoftVis tools too, as detailed earlier
in Sec. 3.
5 Comparison of lessons learned with empirical software engineering research In a comprehensive review of software engineering research by Sjoberg et al., a vision was presented on what empirical studies in this field should cater for in the future period of 2020-2025 [Sjøberg et al. 2007]. In Table 5, we outline the main elements of this review and how they compare to our own lessons learned from evaluating SoftVis tools. We see a strong coherence between the proposal of Sjoberg et al. and our own conclusions. Zannier et al. [Zannier et al. 2006] noted that, while the quantity of evaluations in software engineering had increased throughout the years, there was still need to improve on their quality. Among the issues noted was the lack of a study hypothesis, which is in line with our focus on study motive from Sec. 3.1; the low levels of replication presented by studies; and a lack of information pertaining to the study process itself. By detailing several dimensions on the lessons learned from several SoftVis tool evaluations, we hope to enhance the chances for a tool evaluation methodology that increases the chance of result comparison and result replication.
6 Limitations We do not, in any way, suggest that the evaluations carried out by the authors were perfect. As outlined at several instances in Sec. 3, our evaluations have meaningful, extrapolable, results only within specific conditions, were carried out on just 20 SoftVis tools, and involved only around 90 users. The lengthiest evaluations, around 2-3 weeks, involved chiefly student participants. However, in presenting the lessons learned in Sec. 3, we limited ourselves to the common denominator over which strong consensus from nearly all participants existed. As such, we believe these points to be important, and valid, for a wide range of evaluations of SoftVis tools in general. In this work, the only tool evaluations that we could study in detail, were the ones in which we were involved as evaluators. This is, on the one hand, hard to avoid, as it is very difficult to be aware of all the preconditions and details of a tool evaluation process done by a third party, if these are not all explicitly reported in the respective publications. Also, the number of SoftVis tool evaluations which are comparable in the sense mentioned in Sec. 3, i.e. share comparable aims, tasks, types of users, learning curves, and experiment durations, is relatively small. To strengthen the lessons learned mentioned in this paper, we plan to further search for such studies in the literature and enhance (or possibly invalidate) the conclusions drawn here based on such additional evidence.
7 Conclusions In this paper, we presented a number of lessons learned that target the context of organizing evaluations of software visualization (SoftVis) tools. Based on our previous experience from five studies that covered over 20 tools, over 90 participants from both industry and academia, and were spread over a period of two years, we distilled several dimensions which are important to consider both when organizing a tool evaluation, and also when interpreting the results of such a study. These dimensions cover areas ranging from tool and task selection, choosing and training of participants, and analyzing the results from the evaluation. Although the five studies involved in this paper targeted different types of users, tools, and tasks, we saw several strongly correlated points concerning the evaluation organization, which suggest their wider validity for SoftVis tools evaluations in general. Future research may include showing a different perspective of the evaluations in order to present the respective lessons learnt. This can include areas such as lessons learned in evaluating SoftVis tools
Software engineering study targets (Sjoberg et al.) There is a strong emphasis on building on previous research results, including those from other disciplines Research method and design elements are carefully selected and combined, based on an in-depth understanding of their strengths and weaknesses. Researchers are trained in using a large set of research methods and techniques. Replications and triangulation of research designs are frequently used means for achieving robust results. Empirical evaluation is mainly based on high quality studies conducted by researchers with no vested interest in the study outcome. New technology is compared with relevant alternative technology used in the software industry. The scope is systematically and explicitly defined and re ported; it is relatively narrow to begin with and then gradually extended through replications.
Relation to lessons learned in SoftVis Comparisons made with similar fields of software (comprehension and engineering). Sec. 4 and Sec. 5 relate to this target In Sec. 3.3, tool exposure is promoted supplemented by Sec. 3.7 where the evaluation procedure is well elaborated Follows the need for sharing evaluation experiences as was done in this paper in order to aid replication Sec. 3.9 encourages and shows how tool detachment can be achieved by tool evaluators Comparison of SoftVis tools was advocated for in Sec. 3.7 Sec. 3.10 raises a case for systematic reporting of the results in relation to the scope of the study
Table 1: Future of empirical studies in software engineering (adapted from Table 3 (Quality of empirical studies) from Sjoberg et al) vs lessons presented in this paper. The wording in the left column follows Sjoberg et al. The right column has been modified to show how the material from Sjoberg et al. relates to the work presented in this paper
for software evolution, software maintenance as well as education in software engineering. By analyzing tool evaluations for more specific, narrower, areas, more specific criteria that influence such evaluations can be elicited, thereby helping the organization and comparison of such tool evaluations in the future.
References BASSIL , S., AND K ELLER , R. A Qualitative and Quantitative Evaluation of Software Visualization Tools. In Proceedings of the Workshop on Software Visualization, 33–37. B YELAS , H., AND T ELEA , A. 2006. Visualization of areas of interest in software architecture diagrams. In Proc. SoftVis, ACM, 105–114. B YELAS , H., AND T ELEA , A. 2009. Towards visual realism in drawing areas of interest on software architecture diagrams. J. Visual Languages and Computing 20, 2, 110–128. B YELAS , H., AND T ELEA , A. 2009. Visualizing metrics on areas of interest in software architecture diagrams. In Proc. PacificVis, IEEE, 201–209. D I L UCCA , G., AND D I P ENTA , M. 2006. Experimental settings in program comprehension: Challenges and open issues. In 14th IEEE International Conference on Program Comprehension, 2006. ICPC 2006, 229–234. D I P ENTA , M., S TIREWALT, R., AND K RAEMER , E. 2007. Designing your next empirical study on program comprehension. In Proceedings of the 15th IEEE International Conference on Program Comprehension, IEEE Computer Society Washington, DC, USA, 281–285. D IEHL , S. 2006. Software Visualization: Visualizing The Structure, Behaviour, And Evolution Of Software. Springer. E LLIS , G., AND D IX , A. 2006. An explorative analysis of user evaluation studies in information visualisation. In Proceedings of the 2006 AVI workshop on BEyond time and errors: novel evaluation methods for information visualization, ACM New York, NY, USA, 1–7.
H UNDHAUSEN , C., D OUGLAS , S., AND S TASKO , J. 2002. A meta-study of software visualization effectiveness. Journal of Visual Languages and Computing 13, 3, 259–290. K ANNUSMAKI , O., M ORENO , A., M YLLER , N., AND S UTINEN , E. What a novice wants: students using program visualization in distance programming course. In Program Visualization Workshop, 126. K EOWN , L. 2000. Virtual 3d worlds for enhanced software visualisation. Master’s thesis, University of Canterbury, Department of Computer Science. K NIGHT, C. 2001. Visualisation effectiveness. In 2001 International Conference on Imaging Science, Systems, and Technology (CISST 2001), 249–254. KOSCHKE , R. 2003. Software visualization in software maintenance, reverse engineering, and re-engineering: a research survey. Journal of Software Maintenance: Research and Practice 15, 2, 87–109. K RAEMER , E. 2008. Designing, conducting, and analyzing empirical studies. Electronic Communications of the EASST 13. L ATTU , M., AND TARHIO , J. 2000. How a visualization tool can be used: Evaluating a tool in a research and development project. In 12th workshop of Psychology of Programming Interest Group. L AWRENCE , A., BADRE , A., AND S TASKO , J. 1994. Empirically evaluating the use of animations to teach algorithms. In IEEE Symposium on Visual Languages, 1994. Proceedings., 48–54. L ORENSEN , B. 2004. On the death of visualization: Can it survive without customers? In Proc. NIH/NSF Fall 2004 Workshop on Visualization Research Challenges, NIH/NSF Press. M ARCUS , A., C OMORSKI , D., AND A S ERGEYEV, A. 2005. Supporting the evolution of a software visualization tool through usability studies. Proceedings of 13th International Workshop on Program Comprehension, 307– 316. M URPHY, G., WALKER , R., AND BANLASSAD , E. 1999. Evaluating emerging software development technologies: lessons
learned from assessing aspect-oriented programming. Transactions on Software Engineering 25, 4, 438–455.
IEEE
O’B RIEN , M., B UCKLEY, J., AND E XTON , C. 2005. Empirically studying software practitioners-bridging the gap between theory and practice. In Software Maintenance, 2005. ICSM’05. Proceedings of the 21st IEEE International Conference on, 433– 442. PACIONE , M., ROPER , M., AND W OOD , M. 2003. A comparative evaluation of dynamic visualization tools. Proceedings of the 10th Working Conference on Reverse Engineering (WCRE),Victoria, BC,Los Alamitos, pp. 80-89, CA: IEEE CS Press,, 80–89.
S TOREY, M. 1998. A cognitive framework for describing and evaluating software exploration tools. PhD thesis, Simon Fraser University. T ELEA , A. 2008. Software evolution assessment study. In www. cs.rug.nl/\˜alext/Assignment, Univ. of Groningen, the Netherlands. T ORTOISE SVN. 2009. The TortoiseSVN repository browser. In tortoisesvn.tigtis.org. T ORY, M., AND M OLLER , T. 2004. Human factors in visualization research. IEEE Transactions on Visualization and Computer Graphics Vol 10, No.1.
P FLEEGER , S. 1995. Experimental design and analysis in software engineering. Annals of Software Engineering 1, 1, 219–253.
T RUST 4A LL . 2007. The Trust4All ITEA research project. In www.win.tue.nl/trust4all.
P LAISANT, C. 2004. The challenge of information visualization evaluation. Proceedings of the working conference on Advanced visual interfaces, 109–116.
VAN H AASTER , K., AND H AGAN , D. 2004. Teaching and learning with BlueJ: an Evaluation of a Pedagogical Tool. In Information Science+ Information Technology Education Joint Conference, Rockhampton, QLD, Australia.
P OPPENDIECK , M., AND P OPPENDIECK , T. 2006. Implementing Lean Software Development: From Concept to Cash. AddisonWesley.
VOINEA , L., AND T ELEA , A. 2006. CVSgrab: Mining the history of large software projects. IEEE, 197–205.
P RICE , A., BAECKER , R., AND S MALL , I. 1993. A principled taxonomy of software visualization. Journal of Visual Languages and Computing 4(3):211-266. R AJLICH , V., AND W ILDE , N. 2002. The role of concepts in program comprehension. The InternationalWireless Industry Consortium, 271–278. R EISS , S. P. 2005. The paradox of software visualization. In Proc. VISSOFT, IEEE, 59–63. S ENSALIRE , M., AND O GAO , P. 2007. Tool users requirements classification: how software visualization tools measure up. In Proceedings of the 5th international conference on Computer graphics, virtual reality, visualisation and interaction in Africa, ACM New York, NY, USA, 119–124. S ENSALIRE , M., AND O GAO , P. 2007. Visualizing object oriented software: towards a point of reference for developing tools for industry. In 4th IEEE International Workshop on Visualizing Software for Understanding and Analysis, 2007. VISSOFT 2007, 26–29. S ENSALIRE , M., O GAO , P., AND T ELEA , A. 2008. Classifying desirable features of software visualization tools for corrective maintenance. In Proceedings of the 4th ACM symposium on Software visuallization, ACM New York, NY, USA, 87–90. S HNEIDERMAN , B., AND P LAISANT, C. 2006. Strategies for evaluating information visualization tools: multi-dimensional indepth long-term case studies. In Proceedings of the 2006 AVI workshop on BEyond time and errors: novel evaluation methods for information visualization, ACM New York, NY, USA, 1–7. S ILLITO , J., M URPHY, G., AND DE VOLDER , K. 2008. Asking and answering questions during a programming change task. IEEE Trans. Soft. Eng. 34, 4, 434–451. S ILLITO , J. 2006. Asking and Answering Questions During a Programming Change Task. PhD thesis. S JØBERG , D., DYB A˚ , T., AND J ØRGENSEN , M. 2007. The future of empirical methods in software engineering research. In Proc. Intl. Conf. on Software Engineering (ICSE), IEEE, 358–378.
VOINEA , L., AND T ELEA , A. 2008. Visual querying and analysis of large software repositories. Empirical Software Engineering. Z ANNIER , C., M ELNIK , G., AND M AURER , F. 2006. On the success of empirical studies in the international conference on software engineering. In Proceedings of the 28th international conference on Software engineering, ACM New York, NY, USA, 341–350.