Dental Materials
Evaluation of the adaptation of zirconia-based fixed partial dentures using micro-CT technology Márcia Borba(a) Walter Gomes Miranda Jr.(b) Paulo Francisco Cesar(b) Jason Allan Griggs(c) Álvaro Della Bona(a)
(a)
(b)
(c)
Graduate Program in Dentistry, Dental School, Universidade de Passo Fundo - UPF, Passo Fundo, RS, Brazil. Department of Biomaterials and Oral Biochemistry, Dental School, Universidade de São Paulo - USP, São Paulo, SP, Brazil. Department of Biomedical Materials Science, Dental School, University of Mississippi Medical Center - UMMC, Jackson, MS, USA
Abstract: The objective of the study was to measure the marginal and internal fit of zirconia-based all-ceramic three-unit fixed partial dentures (FPDs) (Y-TZP - LAVA, 3M-ESPE), using a novel methodology based on micro-computed tomography (micro-CT) technology. Stainless steel models of prepared abutments were fabricated to design FPDs. Ten frameworks were produced with 9 mm² connector cross-sections using a LAVATM CAD-CAM system. All FPDs were veneered with a compatible porcelain. Each FPD was seated on the original model and scanned using micro-CT. Files were processed using NRecon and CTAn software. Adobe Photoshop and Image J software were used to analyze the crosssectional images. Five measuring points were selected, as follows: MG - marginal gap; CA - chamfer area; AW - axial wall; AOT - axio-occlusal transition area; OA - occlusal area. Results were statistically analyzed by Kruskall-Wallis and Tukey’s post hoc test (α = 0.05). There were significant differences for the gap width between the measurement points evaluated. MG showed the smallest median gap width (42 µm). OA had the highest median gap dimension (125 µm), followed by the AOT point (105 µm). CA and AW gap width values were statistically similar, 66 and 65 µm respectively. Thus, it was possible to conclude that different levels of adaptation were observed within the FPD, at the different measuring points. In addition, the micro-CT technology seems to be a reliable tool to evaluate the fit of dental restorations. Descriptors: Computer-Aided Design; Denture, Partial, Fixed; Ceramics.
Declaration of Interests: The authors certify that they have no commercial or associative interest that represents a conflict of interest in connection with the manuscript.
Corresponding Author: Márcia Borba E-mail:
[email protected]
Submitted: Mar 25, 2013 Accepted for publication: Jun 11, 2013 Last revision: Jun 27, 2013
396
Introduction The use of ceramic materials to produce large frameworks, such as those in three- and four-unit fixed partial dentures (FPDs), has been enabled by the introduction of CAD-CAM technology (computer-aided design–computer-aided manufacturing) in dentistry and by the development of high fracture toughness zirconia-based ceramics.1 Yttria partially stabilized tetragonal zirconia (Y-TZP) was initially introduced in the medical field as a hip implant material, due to its excellent mechanical performance and biocompatibility. 2 In the dental clinic, Y-TZP ceramic is indicated as a framework material for crowns and large FPDs in both the anterior and posterior areas of the mouth.1 Y-TZP frameworks are produced using CAD-CAM technology, by
Braz Oral Res., (São Paulo) 2013 Sep-Oct;27(5):396-402
Borba M, Miranda Jr. WG, Cesar PF, Griggs JA, Della Bona A
milling partially or densely sintered pre-fabricated blocks. Milling densely sintered blocks produced by hot isostatic pressure (HIP) has the advantage of ensuring better adaptation of the final crown. However, milling hard structures is time-consuming and causes excessive wear of the milling burs. On the other hand, using partially sintered blocks increases the efficiency of the milling process. In such cases, the CAD-CAM system should produce larger restorations to compensate the sintering shrinkage, and to ensure adequate fit of the crown. 3-5 The literature reports mean failure load values between 981 and 3480 N for three-unit Y-TZP FPDs,6-9 and values ranging from 706 to 1262 N for four-unit Y-TZP FPDs.10,11 In addition, clinical studies have showed low failure rates for Y-TZP restorations, i.e., about 2% to 6% after three to five years. The main causes of these clinical failures are secondary caries, loss of retention and chipping of the porcelain veneer.12,13 For this reason, restoration fit is an important factor for restoration prognosis, insofar as poor marginal adaptation results in dissolution of the luting agent and favors microleakage of bacteria and their byproducts, thus increasing tooth susceptibility to inflammation of the vital pulp, secondary caries, and marginal discoloration.14-16 The CAD-CAM technique uses a series of processing steps, such as scanning, software designing, milling and sintering, which may interfere with the precision of fit of the restoration. Although the sintering shrinkage of restorations obtained from partially sintered blocks can be compensated by milling enlarged restorations, it is not as yet clear whether this compensation is effective for the production of FPDs with long spans.4,17 In addition, previous studies reported that the internal adaptation of CAD-CAM restorations is poorer, compared with marginal adaptation.3,5,17 This finding represents a relevant clinical problem, insofar as wide internal gaps have been associated with decreased fracture strength and loss of retention of the restoration.18 There is no standard methodology to measure the marginal and internal adaptation of indirect restorations. Different techniques and tools are available to evaluate the restoration adaptation.19-22 Recently, a methodology involving micro-computed
tomography (micro-CT) was proposed as a reliable and non-destructive technique to evaluate the internal and marginal adaptation of dental restorations. However, there are only few studies that use this methodology for this purpose in the dental field.5,23,24 The objective of this study was to measure the marginal and internal fit of zirconia-based all-ceramic three-unit FPDs, using a novel methodology based on micro-CT technology. The study hypothesis was that the gap width is similar at all measuring points.
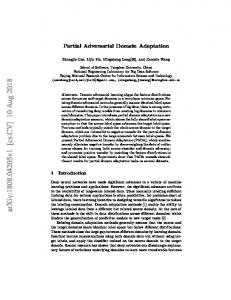
Methodology Fixed partial denture A stainless steel model simulating prepared abutment teeth was constructed with the following characteristics: • 4.5 mm height, • 6° taper and • 120° chamfer as the finish line.5,7 The distance between the centers of the dies was 16 mm, corresponding to the distance between a lower second premolar and a lower second molar (10 mm span). An artificial gingiva was produced with acrylic resin (JET, Clássico, São Paulo, Brazil), and a polyvinyl siloxane impression of the model was taken (AquasilTM, Dentsply, Petrópolis, Brazil) using the double impression technique. A working die was made with type IV special CAD/CAM stone (CAM-base, Dentona AG, Dortmund, Germany). The stone die was digitized by the LavaTM Scan non-contact, optical scanning system, and the FPD framework was designed by LAVATM Scan ST Design System (3M ESPE, St. Paul, USA). A uniform 20 µm cement spacer was used. The frameworks were milled with the LAVATM CNC 500 Milling Machine using LAVA Zirconia Frame pre-sintered Y-TZP material (Y-TZP - 3M ESPE, St. Paul, USA). The frameworks were sintered using the LAVATM Furnace 200 (3M ESPE, St. Paul, USA). Ten frameworks were produced with 9 mm² connector crosssections (Figure 1). After milling, a bonding agent (Effect Bonder, Vita Zahnfabrik, Bad Sackingen, Germany) was ap-
Braz Oral Res., (São Paulo) 2013 Sep-Oct;27(5):396-402
397
Evaluation of the adaptation of zirconia-based fixed partial dentures using micro-CT technology
plied to the framework and sintered according to the cycle recommended by the manufacturer. Vita VM9 porcelain (Vita Zahnfabrik, Bad Sackingen, Germany) was used to veneer the frameworks with a uniform thickness of approximately 1.2 mm around the crowns and pontic, and 0.6 mm around the connectors. The porcelain thickness was ascertained at 7 pre-determined points using a digital caliper, and polishing burs were used to ensure uniform thickness. A final porcelain glaze cycle was performed according to the instructions of the manufacturer.
Micro-CT scanning Each FPD was seated on the original stainless steel model and scanned by the SkyScan 1172 micro-CT system equipped with a 10 megapixel camera (Skyscan, Aartselaar, Belgium). The scanning parameters were: • accelerating voltage of 100 kV, • current of 100 µA, • exposure time of 2950 ms per frame, • Al + Cu filter, and • rotation step at 0.4° (180° rotation). The x-ray beam was irradiated perpendicular to the preparation long axis, and the image pixel size was 17 µm. The x-ray projections were reconstructed using SkyScan’s volumetric reconstruction software (Nrecon). Reconstructed slices were saved as a stack of BMP-type files. Beam hardening correction of 80% and ring artifact correction of 7 were used for the reconstruction. The scanning procedure was performed without cementation of the FPDs.
Gap measurements
Figure 1 - Zirconia framework on the metal dies.
CTAn software (Skyscan, Aartselaar, Belgium) was used to obtain cross-sectional images through the center of the die (x-axis), in the mesiodistal and buccolingual directions (Figure 2). This software
B
A
Figure 2 - Cross-sectional images through the center of the die (x-axis), in the mesiodistal (A) and buccolingual directions (B).
398
Braz Oral Res., (São Paulo) 2013 Sep-Oct;27(5):396-402
Borba M, Miranda Jr. WG, Cesar PF, Griggs JA, Della Bona A
Table 1 - Mean, median, minimum, maximum and standard deviation (SD) values of gap width for the measurement points (µm), and coefficient of variation (CV). Location
Mean
Median*
Min
Max
SD
CV (%)
1. MG
47
42
d
21
99
16
35
2. CA
69
66
c
30
147
21
30
3. AW
65
65
c
25
107
16
25
4. AOT
104
105b
33
188
30
29
5. OA
133
125
75
226
35
26
a
*Values followed by the same small letter in the column are statistically similar (p ≥ 0.05).
• OA - occlusal area: 500 µm from the axio-occlusal angle in the direction of the center of the occlusal plateau. Figure 3 - Measuring locations: (1) MG; (2) CA; (3) AW; (4) AOT; (5) OA.
made it possible to choose a region of interest (ROI) and the desired number of slices for the region selected. As a result, the number of slices could be standardized for all specimens, and the same slice— corresponding to the center of the crown, in both buccolingual and mesiodistal directions—was analyzed for each crown. These images were transferred to Adobe Photoshop software to delimit the internal space between the die and the crown, and Image J software was used to perform the measurements. All measurements were performed by a single examiner. The presence of small radiographic artifacts precluded the use of any automatic tool. Therefore, all measurements were taken manually, and the measuring points were standardized to minimize errors. Five measuring points were selected5 (Figure 3): • MG - marginal gap: perpendicular measurement from the internal surface of the crown to the margin of the die;25 • CA - chamfer area: 800 µm occlusal to the margin of the die; • AW - axial wall: internal adaptation at the midpoint of the axial wall; • AOT - axio-occlusal transition area: transition from the occlusal plateau to the axial wall;
Results from different measuring points were analyzed statistically using Kruskal-Wallis one-way analysis of variance on ranks and Tukey’s test, at a significance level of 5%, since data failed the normality test.
Results Mean, median, minimum, maximum and standard deviation values (all in µm), as well as coefficient of variation (%) of the gap width for the different measuring points, are shown in Table 1. There were significant differences between gap dimensions obtained for the different measurement points (p