Evaluation of the Early Literacy Intervention Grant Program Preliminary Report Jonathan Plucker, Ph.D. Director
Terry Spradlin, M.P.A. Associate Director
Amy Kemp, Ph.D. Research Associate
Young Chang, Ph.D. Research Associate
Katie Bodack Graduate Research Assistant
Michael Holstead Graduate Research Assistant
509 East Third Street Bloomington, Indiana 47401 http://www.ceep.indiana.edu
Jonathan A. Plucker, Ph.D. Director
812-855-4438 800-511-6575 Fax: 812-856-5890
[email protected]
Table of Contents 1
History of the Early Literacy Intervention Grant Program........................1 1.1
2
3
Overview of the 2007-2008 Grant Program ........................................................2
Summary of Implementation Surveys .......................................................7 2.1
Grant Coordinator Generalized Responses..........................................................8
2.2
Generalized Teacher Responses ..........................................................................13
2.3
Grant Coordinator and Teacher Responses Specific to Literacy Models ............18
Summary of Baseline Data ........................................................................27 3.1
Baseline Data for Early Reading Skills ...............................................................27
4
References .................................................................................................65
5
Appendix A: Grant School Information ....................................................67
6
Appendix B: Sample Questionnaire ..........................................................79
Center for Evaluation and Education Policy
i
Table of Contents
ii
Center for Evaluation and Education Policy
List of Figures FIGURE 1. Percent Kindergarten Students at Benchmark, Strategic or Intensive.......................................... 30 FIGURE 2. Waterford: Percent Kindergarten Students at Benchmark, Strategic or Intensive........................ 31 FIGURE 3. Read Well: Percent Kindergarten Students at Benchmark, Strategic or Intensive ....................... 32 FIGURE 4. Successmaker: Percent Kindergarten Students at Benchmark, Strategic or Intensive ................. 33 FIGURE 5. Voyager Passport: Percent Kindergarten Students at Benchmark, Strategic or Intensive ............ 34 FIGURE 6. Percent First Grade Students at Benchmark, Strategic or Intensive............................................. 35 FIGURE 7. Waterford: Percent First Grade Students at Benchmark, Strategic or Intensive........................... 36 FIGURE 8. Read Well: Percent First Grade Students at Benchmark, Strategic or Intensive .......................... 37 FIGURE 9. Successmaker: Percent First Grade Students at Benchmark, Strategic or Intensive .................... 38 FIGURE 10. Voyager Passport: Percent First Grade Students at Benchmark, Strategic or Intensive............... 39 FIGURE 11. Triumphs: Percent First Grade Students at Benchmark, Strategic or Intensive ........................... 40 FIGURE 12. Percent Second Grade Students at Benchmark, Strategic or Intensive ........................................ 41 FIGURE 13. Waterford: Percent Second Grade Students at Benchmark, Strategic or Intensive ...................... 42 FIGURE 14. Read Well: Percent Second Grade Students at Benchmark, Strategic or Intensive...................... 43 FIGURE 15. Successmaker: Percent Second Grade Students at Benchmark, Strategic or Intensive................ 44 FIGURE 16. Voyager Passport: Percent Second Grade Students at Benchmark, Strategic or Intensive .......... 45 FIGURE 17. Percent Kindergarten Students Still Developing/Developed........................................................ 48 FIGURE 18. Waterford: Percent Kindergarten Students Still Developing/Developed ..................................... 49 FIGURE 19. Voyager Passport: Percent Kindergarten Students Still Developing/Developed.......................... 50 FIGURE 20. Fundations: Percent Kindergarten Students Still Developing/Developed.................................... 51 FIGURE 21. Percent First Grade Students Still Developing/Developed........................................................... 52 FIGURE 22. Waterford: Percent First Grade Students Still Developing/Developed ........................................ 53 FIGURE 23. Reading Recovery: Percent First Grade Students Still Developing/Developed........................... 54 FIGURE 24. Voyager Passport: Percent First Grade Students Still Developing/Developed............................. 55 FIGURE 25. Fundations: Percent First Grade Students Still Developing/Developed....................................... 56 FIGURE 26. EIR: Percent First Grade Students Still Developing/Developed .................................................. 57 FIGURE 27. Percent Second Grade Students Still Developing/Developed ...................................................... 58 FIGURE 28. Waterford: Percent Second Grade Students Still Developing/Developed.................................... 59 FIGURE 29. Reading Recovery: Percent Second Grade Students Still Developing/Developed ...................... 60 FIGURE 30. Voyager Passport: Percent Second Grade Students Still Developing/Developed ........................ 61
Center for Evaluation & Education Policy
iii
List of Figures
FIGURE 31. Fundations: Percent Second Grade Students Still Developing/Developed .................................. 62 FIGURE 32. EIR: Percent Second Grade Students Still Developing/Developed.............................................. 63
iv
Center for Evaluation & Education Policy
List of Tables TABLE 1.
Number and Percent of Schools Submitting Assessment Data .................................................... 28
TABLE 2.
Number of Schools and Students at Each Grade Level with DIBELS Data ............................... 29
TABLE 3.
Number of Schools and Students with DIBELS Data by Program .............................................. 29
TABLE 4.
Comparison of DIBELS Data for ELIGP Students and Expected Achievement ......................... 46
TABLE 5.
Number of Schools and Students for Whom IRDA Data Were Submitted.................................. 47
TABLE 6.
Number of Schools and Students Participating in the Most Common Early Literacy Programs. 47
TABLE 7.
Comparison of IRDA Data for ELIGP Students ......................................................................... 63
TABLE 8.
Summary of Funded Schools and Grade Levels .......................................................................... 67
TABLE 9.
Demographic Information for All Programs ................................................................................ 71
TABLE 10. Compliance Table ......................................................................................................................... 75
Center for Evaluation & Education Policy
v
List of Tables
vi
Center for Evaluation & Education Policy
1 History of the Early Literacy Intervention Grant Program There is little debate that the most essential skill for academic success is the ability to read. It follows that students must learn to read before they can read to learn. Despite the broad acceptance of the importance of print literacy, many students remain below grade level in their reading skills. Although the 2007 results from the National Assessment for Educational Progress indicate that Grade 4 reading scores in Indiana were two scale score points above the national average (222 to 220), 67 percent of Hoosier students had reading scores at or below a basic level of proficiency at this grade level.1 To improve the literacy skills of students in preschool through Grade 2 who are at risk for future academic failure due to poor reading skills, the Indiana Early Literacy Intervention Grant Program (ELIGP) was established in 1997. The grant program was a component of a statewide reading and literacy initiative advanced by the Indiana Department of Education (IDOE) and Dr. Suellen Reed, State Superintendent of Public Instruction. This preliminary report provides an overview of the ELIGP during the 2007-08 school year and identifies the grant schools and the early literacy intervention programs implemented by these schools. Student-level data are included where possible, including baseline assessment outcomes. Finally, program implementation information was gathered
1. Analysis of Indiana’s Mathematics and Reading Scores on the 2007 National Assessment of Educational Progress. (2007). Focus on Indiana. Bloomington, IN: Center for Evaluation and Education Policy.
Center for Evaluation and Education Policy
1 of 80
History of the Early Literacy Intervention Grant Program
from the grant coordinators and the classroom teachers in the funded schools through qualitative procedures.
1.1 Overview of the 2007-2008 Grant Program From its inception, the ELIGP has emphasized local school decision making in choosing literacy interventions that are funded by the state of Indiana through a competitive grant process. Schools interested in receiving ELIGP funds must complete a detailed application describing what early literacy intervention they chose to use and how it would be implemented; the applications are then reviewed and assessed on their proposed implementation. The grant also funds professional development activities for school personnel that are directly related to the literacy intervention. As a part of the grant application for the 2007-08 school year, applicants have also agreed to administer a fall and spring assessment to determine if program implementation is proceeding as planned, to identify any implementation challenges that may need to be addressed, and to submit student literacy achievement data for state compliance and evaluation. The Center for Evaluation and Education Policy (CEEP) has monitored and evaluated the ELIGP since the 1997-98 school year, and preliminary data for 2007-08 school year program implementation are presented here. In total, the Early Literacy Intervention Grant Program (ELIGP) dispersed $2,630,238.00 among 106 schools in 51 school corporations for the classroom literacy intervention portion of the grant. In some cases, schools received a specified amount of funding directly, while in other cases, districts were awarded a lump sum, which was then dispersed to their individual schools. The average ELIGP award was $27,980.00 and the range per award was from $8,013.00 to $71,470.00. A total of 55 ELIGP schools funded in 2007-08 had also been funded in the 2006-07 program. According to data from the grant coordinator surveys, in total, almost 600 classrooms were affected by ELIGP funding, ranging from one to 19 classrooms in a given school. 2 of 80
Center for Evaluation and Education Policy
History of the Early Literacy Intervention Grant Program
Of the 81 grant coordinators, representing 91 schools, that completed the online implementation surveys, 9,644 students were projected to be impacted by the literacy interventions. The per school average number of students participating in the literacy intervention was 106. Grant recipients reported using funding to affect as few as four to as many as 2,098 students (the maximum value included students in an entire school corporation). Estimates of targeted students included 771 pre-K students, 3,633 kindergarten students, 3,249 Grade 1 students, and 2,023 Grade 2 students. Since schools were allowed to choose from a wide variety of literacy interventions, an exhaustive review of each is not efficient for this preliminary report. The eight programs which schools chose and for which the most data was received are reviewed in this report. The programs are Waterford, Early Interventions in Reading, Voyager Passport, Fundations, Triumphs, Reading Recovery, Successmaker, and Read Well. The Waterford Early Reading Program affected the most schools and the most students, 34 and 4,883, respectively. These numbers are taken from the literacy skills data received, rather than from grant coordinator projections. See Table 8 for the list of grant schools and programs. Some schools targeted one grade in their interventions, while others targeted up to four grades, pre-Kindergarten through Grade 2. Seven schools targeted pre-K students, 72 targeted kindergarten students, 79 included Grade 1 students, and 67 targeted Grade 2 students. For a complete list of grant recipients, grade levels targeted, programs, assessments, and funding received, see Table 8. Grant recipients were located throughout the state and ranged from rural to metropolitan locales. For funded schools, the average passing rate for Grade 3 students on the English/ Language Arts component of ISTEP+ during the 2007-08 school year was 74%, with a range of 21% to 95%. In comparison, the state average was 76%. On average, 43% of the students received free and reduced lunch at the funded schools, according to data from the 2006-07 school year. The student body of the vast majority of schools was composed of white students, with an average of 79%. Black students were the next most frequent
Center for Evaluation and Education Policy
3 of 80
History of the Early Literacy Intervention Grant Program
racial/ethnic group, making up 10% of the funded schools’ populations, followed by about equal percentages of Hispanic and multiracial students. For information concerning the characteristics of individual schools, see Table 9. Schools proposed literacy programs in their grant application that would meet the needs of their students. Method of assessment also varied. The use of either the Dynamic Indicators of Basic Early Literacy Skills (DIBELS) or the Indiana Reading Diagnostic Assessment (IRDA) was recommended before the schools received their grant money; however, they were free to choose another assessment. Out of all the grant schools, a total of 39 schools planned on using DIBELS, 47 planned to use IRDA, and 7 indicated they planned on using both DIBELS and IRDA. Some schools used a combination of assessments, but schools were only required to submit one type of data. A total of 9 other assessment instruments were used by 13 other schools, with some schools using multiple assessments. The Reading Recovery Program
Although this report focuses on the way funds were spent on literacy interventions of a school’s choice, a large portion of ELIGP funding is disbursed each year to fund continuing professional development for teachers using the Reading Recovery program. Reading Recovery is a short-term literacy intervention designed for low-achieving first-graders who are having difficulty learning how to read and write. A specially trained Reading Recovery teacher provides half-hour lessons each school day for 12 to 20 weeks to students on a one-on-one basis. As soon as a student is able to meet grade-level expectations and demonstrates the ability to work independently in the classroom, the lessons are discontinued. Nationwide, approximately 75% of students who complete the Reading Recovery program successfully meet grade-level expectations in reading and writing. Professional development is an important aspect to Reading Recovery. Purdue’s Center for Literacy Education and Research (CLEAR) serves as the training center for Reading Recovery in Indiana. University Trainers provide year-long training to Teacher Leaders, 4 of 80
Center for Evaluation and Education Policy
History of the Early Literacy Intervention Grant Program
who return to their districts in order to train the individual teachers. In general, each teacher generally serves 8-10 children per year for half of the day. The portion of ELIGP funding allotted to Reading Recovery helps pay for teacher training and continued professional development in Reading Recovery.
Center for Evaluation and Education Policy
5 of 80
History of the Early Literacy Intervention Grant Program
6 of 80
Center for Evaluation and Education Policy
2 Summary of Implementation Surveys Funded schools were asked to respond to a series of questions concerning the progress of implementation of the literacy intervention of their choice. Grant coordinators and the teachers that were actually implementing features of the intervention in their classrooms completed an online survey during the month of October, 2007 (see Appendix B for a sample survey). Grant coordinators were principals, teachers, Title I Coordinators, literacy coaches, and superintendents. The grant coordinator questionnaire elicited overall information concerning what grade levels were targeted, how many students were affected, what assessment tool they chose to use, and if they made any changes to the program implementation since the completion of their grant proposals approved by the IDOE. They completed sections of the survey concerning how students were grouped for intervention delivery; staffing and professional development, such as how many teachers were trained and what training methods were used; how closely they followed the schedule outlined in their grant proposals; and what challenges they faced in implementing their chosen programs. Teachers answered questions concerning progress of implementation, specifically in their classroom. Details regarding what specific early literacy skills were targeted and the instructional methods they used to deliver intervention to students were solicited. Teachers were asked if they had prior experience implementing the literacy intervention, how they were trained so far during the grant year, level of preparedness, parent involvement strategies, and any challenges they personally faced regarding implementation of the intervention strategy. Responses from the grant coordinators and teachCenter for Evaluation and Education Policy
7 of 80
Summary of Implementation Surveys
ers are organized by generalized responses applicable to the ELIGP and specific responses applicable to their literacy models. Included are brief summaries of survey results for eight programs: the five most frequently selected programs selected by those using DIBELS as their assessment and the five most frequently selected programs by those using IRDA as their assessment instrument (three of the programs were common to schools using either assessment).
2.1 Grant Coordinator Generalized Responses Literacy Program/Intervention Information The following data were compiled using the responses from grant coordinators concerning their role in the literacy intervention, school funding information, student grouping during the intervention, staff professional development, and challenges regarding implementation of the current literacy program. Of the 81 grant coordinators that completed online surveys, slightly more (57%) indicated that they were responsible for supervising someone else on the school-level that oversees implementation rather than directly overseeing implementation themselves. Sixty-nine percent (69%) of grant coordinators reported that their school has received ELIGP funding in the past. Of those that had received funding, most (55%) of the responders had received the grant for less than two years. When schools were asked to compare whether they were using funding in a similar way as they had in the past, the most frequent response was that to a great extent, the literacy efforts this year were a continuation or supplement to past programming. Grant coordinators reported allocating funds to a variety of places, including purchasing instructional materials, professional development, improving technology, hiring personnel, and encouraging parent involvement. The most commonly reported areas to which funding was allocated included hiring personnel and purchasing instructional resources, while encouraging parent involvement was least likely to be chosen as a response. Of the
8 of 80
Center for Evaluation and Education Policy
Summary of Implementation Surveys
schools that received the grant for the first time this year, funds were used a little differently. The greatest areas to which funding was given were purchasing instructional materials, receiving professional development, and acquiring technology. A total of 32% of grant coordinators that completed the survey reported major changes to their school’s implementation plan. Included in these changes were decreasing the amount of students participating in the intervention and changing timelines as outlined in the grant application. The funding disbursement arrangement was cited multiple times as a possible factor contributing to these setbacks. For example, one grant coordinator commented: “The school did not receive the requested amount in the grant application. Due to the smaller grant award, the school will only be able to purchase two Waterford concurrent licenses, Level 1 only. The teachers will use the software to provide intervention to students most significantly behind grade level in reading.”
On a Likert-item rating scale of 1 to 10, 1 indicating the timeline had not at all been followed and 10 indicating the timeline was followed exactly, the average score of 7 indicated that schools somewhat to mostly followed their timeline. The most common occurring scores were ratings of 9 or 10. Nevertheless, the range of scores was from 1 to 10, demonstrating that schools vastly differed in how closely they were able to follow their timeline due to various challenges they faced. Grant coordinators reported how fully the primary features of the program had been implemented so far this academic year, as of the end of October, 2007. On a Likert-item scale of 1 to 10, 1 indicating none of the primary features had been implemented and 10 indicating all program features had been fully implemented, responses again widely differed and ranged from 1 to10. The average response was a score of 6, indicating some to all of the program features had been implemented. The most commonly reported response was a rating of 10.
Center for Evaluation and Education Policy
9 of 80
Summary of Implementation Surveys
In an attempt to gain a better understanding of the structure of funded schools’ intervention programs, this year the survey included a question concerning how interventions were delivered to students. Thirty-seven percent (37%) of the responding grant coordinators indicated all students within a given classroom were affected by ELIGP funds. An equal number of respondents, 30 out of 81 grant coordinators, reported targeting students in groups within the classroom. Seventeen percent indicated that they used mixed or multiple strategies to target students for intervention. The least common answer was that students are targeted for intervention one-on-one, and only 9% of respondents selected this choice.
Personnel and Training Grant coordinators indicated that the person responsible for overseeing overall implementation was usually a literacy coach who served as the intervention leader. Thirty-two percent (32%) of grant coordinators who completed the survey reported this response. The second most common response (30%) was that a regular classroom teacher serves as the leader of ELIGP instruction. Grant coordinators were also asked how the grant award had been used in regards to teacher training and the number of personnel participating. Most grant coordinators reported that pre-kindergarten students and teachers were not participating in the ELIGP intervention. Seventy-two percent of those that targeted kindergarteners and completed the survey reported that almost all of the kindergarten teachers at their school were involved. A similar trend was true for Grade 1 and Grade 2 teachers. Of the schools targeting Grade 1 students, 67% indicated that almost all of their first grade teachers were included in implementation, and 61% of schools targeting Grade 2 students indicated that almost all of their second grade teachers were involved with ELIGP.
10 of 80
Center for Evaluation and Education Policy
Summary of Implementation Surveys
Teachers were trained in different ways, but the most widely reported response was that professional development was provided by another teacher or coach (53% of grant coordinators chose this response). A total of 48% percent of grant coordinators indicated that coaching or one-on-one modeling was a means of training. From these response trends, it appears that informal training occurred between colleagues on the school level. Twentyseven of the responding 81 grant coordinators received opportunities to network with teachers from other schools using the same program. Twenty-six percent (26%) of grant coordinators indicated that self-training occurred, whether it was via video, software, internet, books, or CD’s. A total of 20% percent of respondents reported that no training had occurred yet this year, as of the end of October, 2007. These training methods were not mutually exclusive, and often grant coordinators indicated that more than one method was used together to most adequately prepare teachers for program implementation. The implementation reports only inquired about training that occurred this year with funding from the ELIGP. Grant coordinators rated teachers implementing the intervention on a scale ranging from not at all prepared to extremely well prepared (1 to 10). On average they were classified as somewhat prepared, giving a score of 7 on the Likert-scale across responding schools, with the most common occurring score being an 8. In total, 72% of grant coordinators rated teachers’ level of preparedness to implement the intervention to be at or above a score of 7.
Challenges Schools faced a variety of challenges with their early literacy intervention. For example, inexperience with their chosen literacy model, unforeseen setbacks with implementation timelines, and issues with student assessment were some of the cited challenges. One of the most common issues was technology, and 36% of grant coordinators indicated this
Center for Evaluation and Education Policy
11 of 80
Summary of Implementation Surveys
was a challenge. Technology challenges sometimes contributed to setbacks in implementation timing. One grant coordinator explained: “Our building's infrastructure had to be rewired in order for the computers to run quickly. They were originally too slow to run nine licenses at one time. Due to problems with technology, we were not able to install our software as quickly as we had planned. Without the software installed we couldn't receive training. However, we have all been trained and the program will begin implementation on Monday, October 29, 2007.”
The area of training and staffing was another of the most common issues in implementation. From their responses, 35% of grant coordinators viewed professional development as a challenge. Time to train the staff was regarded as the primary issue. “Training for teachers in using the new student assessment tool takes time and practice. Finding opportunities for meaningful professional development is difficult, especially during the first part of the year.”
Along these lines, finding time to actually deliver the interventions to students also presented difficulties. With so much packed into one school day, grant coordinators expressed frustration with the logistics of delivering the interventions to the students in need of additional instruction. “We are always looking for time outside the regular reading core block to pull students for small groups. We are always looking for more time in the school day to support students with interventions like this one.” “Scheduling time for 45 minutes in addition to our 90 minutes of uninterrupted language arts time is difficult at times. The assessments are timely to administer, score, and input with 27 students in a classroom.”
Regardless of the challenges mentioned above, a large number of grant coordinators, 58%, indicated that the problems had been resolved or that they were more effectively
12 of 80
Center for Evaluation and Education Policy
Summary of Implementation Surveys
planning for the future as a result. Resolutions to challenges included hiring additional personnel to assist with the interventions. “We would like to have more time to implement small group interventions for our lowest performing students. Having additional staff with this grant has been beneficial in providing quality instructional time. We can always use more with these students!”
Some schools also tried to make the best use of their existing resources, such as the knowledge of already trained individuals or resources from previous years. “We have utilized trained individuals in our building to assist us in the training of others that need it! As for materials, we continue to pursue the needed items and make due with what we have.” “We are waiting for the installation of additional Waterford Programs. We are currently using all stations from last year's grant and will be up and running by November I am told by our technology department.”
2.2 Generalized Teacher Responses Literacy Program/Intervention Information Teachers and other educators that were responsible for directly implementing the chosen intervention also completed an online survey. A total of 224 teachers completed the surveys from 73 schools. As a whole, teachers were somewhat inexperienced with delivering early literacy instruction through ELIGP. Forty-three percent (43%) of teachers reported that they had never provided ELIGP instruction prior to this school year. Twenty-seven percent of teachers reported having one year of prior experience, while 17% reported three or more years of experience.
Center for Evaluation and Education Policy
13 of 80
Summary of Implementation Surveys
Just as the grant coordinators had been asked, teachers were asked to indicate how ELIGP instruction was provided to students. The most frequently chosen response from teachers was that all students in a given classroom are targeted. In total, 45% of teachers that completed the survey and answered this question chose this response. Twenty-six percent (26%) of respondents reported that a small group strategy was used. A similar number (about 13%) indicated that students receive one-on-one instruction or receive ELIGP instruction through mixed strategies. Teachers also were asked which of the main areas of early literacy (phonics, phonemic awareness, fluency, vocabulary, and comprehension) were targeted. They were permitted to select as many of these skills as they targeted in their classroom with ELIGP instruction. Nearly all respondents indicated that phonics and phonemic awareness were directly addressed in their intervention. Eighty-four percent of teachers reported that vocabulary was a focus of intervention, and an equal number (178 of 224 teachers) indicated that fluency and comprehension were addressed. On the survey, teachers indicated what instructional methods they used, including scripted lessons, paired reading, and ability grouping, as part of their ELIGP instruction. They were permitted to select as many methods that they thought applied to their delivery of ELIGP instruction. Small group instruction and frequent student assessment were the two most frequent strategies chosen to deliver ELIGP instruction (66%). Computer assisted instruction and scripted lessons were reported by an equal number of teachers (122 of 224 teachers). Echo reading and one-on-one instruction were both reported to be used by about half of the teachers.
Training With regards to how they were trained, many teachers participating in ELIGP instruction received an introduction this year to their school’s literacy program. A total of 19% of
14 of 80
Center for Evaluation and Education Policy
Summary of Implementation Surveys
teachers reported attending an on-site initial certification training conducted by the program developer, and 39% received an initial training session provided by a teacher-leader or coach within the school. Around 22% of teachers reported receiving one-on-one coaching or learning through modeling. A similar number of teachers reported self-training via video, computer software, Internet, or books. Some teachers also had opportunities to network with teachers from other schools using the same literacy program (16%). Twenty-five percent (25%) of responding teachers indicated that they have not participated in any training yet this year, as of the middle of November, 2007, and 13% indicated that they have no professional development this year because they had already been trained. There was great variability in how prepared teachers felt to implement the ELIGP program or intervention this year. Teachers rated themselves on a scale ranging from 1 to 10, not at all prepared to extremely well prepared. On average they classified themselves as somewhat prepared, giving a score of 6 on the Likert-scale. The most frequent response was a rating of 8, but almost as many teachers gave themselves a rating of 1, 20% and 17%, respectively.
Parent Involvement Teachers indicated on the survey that they had reached out to parents to play an active role in improving the literacy skills of their students. Communication between school and home was one way in which teachers tried to involve parents. Sending books home to parents to read with their children was reported by 71% of teachers, and distributing progress reports was a practice of 70% of teachers that completed the survey. A total of 55% of teachers indicated that they made efforts to explain assessment results to parents. Parent back-to-school nights and newsletters were both reported by about 65% of teachers. Parent training and literacy contracts with students were not reported as much as the aforementioned strategies, with 23% and 11% of teachers reporting these practices,
Center for Evaluation and Education Policy
15 of 80
Summary of Implementation Surveys
respectively. Many teachers reported that these strategies for involving parents were ongoing, and they planned to continue using these methods throughout the school year.
Challenges The most commonly reported challenge that teachers faced dealt with logistical issues, such as time and physical space to deliver ELIGP instruction. Thirty percent (30%) of responding teachers cited logistics as a challenge to implementation. For some, there was insufficient time to work the program into their already busy classroom schedules. Some teachers commented on the need to prioritize on these days: “Sometimes we are unable to get the entire class through the program due to specials or scheduled activities in the day. Those days I make sure that my targeted students are on the computer, and that if anyone gets left off, it's those that are reading above grade level.” “Currently we have a half day Kindergarten program so it is difficult to get everything accomplished in the short time we have. So we have to pick and choose the best lessons for the day.”
Delays in program implementation due to a variety of causes, such as server problems and the late receipt of materials, were reported commonly as well. The severity of the problem and length of the delay differed across schools. One teacher commented on the technology difficulties that her school experienced: “Our technology department has delayed installing the software due to the new file server being backordered. Once the server and software are installed we are ready to implement the program.”
Delays in receiving materials impeded some teachers’ ability to begin implementation. Teachers stated that they received materials later in the year than they would have liked for appropriate planning. 16 of 80
Center for Evaluation and Education Policy
Summary of Implementation Surveys
“I have not received all of my materials. I am unable to begin the program with my students until I have everything I need. The materials have been ordered and should be here within the next week or so. I will begin the program when the materials arrive. I am excited about using the program. I believe this program will be a tremendous benefit to my students.”
Intervention materials presented challenges for some, even if they were received in a timely manner. Learning new strategies well enough to deliver intervention to students effectively was reported to be difficult. Training and staffing were mentioned as challenges by a quarter of teachers that completed the survey. “Learning new programs is a challenge. Because we are implementing several literacy programs that are "new" to us, it has been a bit challenging to get it all done. I am working to teach each program/intervention with fidelity. I am pleased to say that I am already seeing results from our efforts.”
Some teachers felt the need to tailor the school’s chosen intervention or program to match with their students’ areas of concern. Teachers rated the extent to which they had needed to modify the literacy program/intervention to meet student needs, on a scale of 1 to10, ranging from not at all to a lot The average response was a 4, indicating that teachers or interventionists needed to make some alterations to standard program delivery. Technology was mentioned by teachers to be a significant challenge. Adapting to new technology and updates in older technology were some of the specific issues that got in the way of ELIGP instruction. For more technical issues, consulting with the schools technology experts was necessary. “The network for the computers continually freezes and has difficulty maintaining its course. This problem is in the process of being fixed.”
Center for Evaluation and Education Policy
17 of 80
Summary of Implementation Surveys
“Technology is always a challenge. There is nothing I can do to ensure the availability of servers. My students complete their individualized lessons on Waterford daily, unless technology prohibits it.”
Resolutions to personal difficulties adapting to technology included taking time out to better familiarize oneself with the program. “The technology this year is different so I need to take the time to look through the changes. That way I will know how to implement them into my classroom.”
2.3 Grant Coordinator and Teacher Responses Specific to Literacy Models This section will not be an exhaustive review of the grant coordinator and teacher responses but will include any differences in responses between programs. A comparison of programs is necessary as the various chosen programs employ different strategies and materials to improve literacy skills. For example, the Waterford Early Reading Program utilizes a software component for students to use. Challenges concerning computer availability and software issues occurred, whereas for those using Voyager Passport the same challenges may not have arisen. The discussion begins with the eight programs for which the most student data was turned in. Again, the purpose of this section is only to highlight differences, if any, between responses organized by individual programs and overall responses including all programs.
Waterford Literacy Program/Intervention Information
Schools using Waterford as their method of ELIGP instruction more often delivered services to students on a class-wide basis than the average of schools using any of the pro-
18 of 80
Center for Evaluation and Education Policy
Summary of Implementation Surveys
grams. Around 56% of grant coordinators using Waterford reported this strategy of delivery, whereas only 37% of grant coordinators reported class-wide delivery overall. Another difference in the method of program/intervention implementation that teachers reported was the use of computer-assisted instruction. Students’ use of computers to deliver parts of the intervention is a main component of the Waterford program. About 89% of teachers implementing Waterford mentioned using computer-assisted instruction as compared to 55% of teachers that reported using this strategy overall. For those using Waterford, more often the leader of ELIGP instruction was a classroom teacher. Half of the grant coordinators implementing Waterford reported a teacher served as the head of the intervention as opposed to 30% of overall grant coordinators. Training
More teachers using Waterford reported that training had not occurred yet for them this year. A total of 40% of teachers using Waterford had not had training at the time of survey completion, while 25% of teachers overall had not yet experienced training this school year. Challenges
One trend that was evident last year was that the grant coordinators implementing Waterford cited more technology issues than the schools that were using different literacy programs and interventions. This did not seem to be the case this year. Only four of the 37 grant coordinators that made comments concerning their challenges to implementation mentioned technology. However, teachers working directly with the intervention detailed their challenges using the technology effectively. Of the 14 teachers that cited technology difficulties, 13 were implementing Waterford.
Center for Evaluation and Education Policy
19 of 80
Summary of Implementation Surveys
Delays in program implementation were a common challenge by both grant coordinators and teachers implementing Waterford. Over half of grant coordinators that used Waterford reported obstacles to implementation due to various delays, such as funding, technology, or receiving materials. This trend occurred with teachers as well. About half of the Waterford teachers reported delay in their program or having no program yet at the time of survey completion, the end of October, 2007.
Early Interventions in Reading Literacy Program/Intervention Information
All but one of the schools using Early Interventions in Reading (EIR) as their program had received ELIGP funds in the past. Funding most often went towards technology and personnel for these schools. Intervention delivery often occurred in the form of small groups (70%) according to grant coordinators using EIR, while overall, 37% of grant coordinators reported use of this strategy. Regarding areas of literacy intervention, according to teachers, vocabulary was less often a main area of intervention for those using EIR (58%) compared to 84% of teachers overall. Ratings of how well schools followed the implementation timeline as outlined in the grant applications were about 3 points greater than the average response of all grant coordinators. Challenges
Logistical issues, time and physical space, were reported more frequently by grant coordinators using EIR (50%) than were reported overall (14%). No teachers or grant coordinators using EIR reported technology problems.
20 of 80
Center for Evaluation and Education Policy
Summary of Implementation Surveys
Voyager Passport Literacy Program/Intervention Information
Grant coordinators using Voyager Passport reported using ELIGP funding for materials and professional development more often than grant coordinators of all programs. Grant coordinators in schools using Voyager Passport with at least one year of experience reported purchasing instructional materials 86% of the time and using funds for professional development 86% of the time. In comparison, grant coordinators with at least one year of experience using their intervention, regardless of program, reported purchasing materials in 47% of cases and seeking professional development about one-third of the time. Another difference was in the area of intervention delivery. Grant coordinators in schools using Voyager Passport reported using a class-wide strategy less often than overall grant coordinators (14% compared to 37%, respectively). More often, grant coordinators of Voyager Passport programs reported using small groups to deliver intervention (86% compared to 37% of overall grant coordinators). Fewer teachers using Voyager Passport reported using computer-assisted instruction (18%), compared to 55% of teachers overall. All teachers using the Voyager Passport program reported using frequent assessment, scripted lessons, and small group instruction. Training
More grant coordinators of schools using Voyager Passport reported receiving on-site training by a program developer. Six out of seven (86%) grant coordinators reported this compared to about 30% of overall grant coordinators. Twenty out of the 22 teachers that completed the survey reported being trained by a teacher or coach within the school. One-on-one coaching or modeling and consultation with the model developer were more frequently used in Voyager Passport schools than as reported by grant coordinators overall. Also, culturally competent instruction was more of a focus, reported by 23% of VoyCenter for Evaluation and Education Policy
21 of 80
Summary of Implementation Surveys
ager Passport teachers versus 5% of teachers overall. Grant coordinators reported successfully implementing the primary features of the Voyager Passport program to a greater extent than overall grant coordinators regardless of program. Challenges
Grant coordinators using Voyager Passport reported challenges with fitting the intervention into the curriculum and with student assessment more often than overall grant coordinators. Grant coordinators in schools using Voyager Passport reported curricular issues 29% of the time compared to 10% of overall grant coordinators. Student assessment challenges were reported from 29% of grant coordinators using Voyager Passport, while 14% of overall grant coordinators reported this challenge. More teachers using Voyager Passport reported the use of frequent student assessment (100%) than overall teachers (66%), which perhaps contributed to more challenges with student assessment.
Fundations Literacy Program/Intervention Information
The grant coordinator implementing Fundations indicated that the funding would primarily be spent on instructional materials, whereas overall, across all programs, only 47% of grant coordinators indicated grant monies were allotted to materials. Teachers implementing Fundations reported that intervention was delivered to students on a class-wide basis more often than the frequency across programs. A total of 70% of teachers using Fundations reported using a class-wide method to deliver intervention, whereas overall, 45% of teachers reported this type of intervention delivery. Regarding instructional methods, a greater number of teachers using Fundations utilized echo reading as part of their ELIGP instruction than was reported by teachers across all programs. A total of 72% of teachers using Fundations selected echo reading as an
22 of 80
Center for Evaluation and Education Policy
Summary of Implementation Surveys
instructional strategy, while only half of the teachers across all programs indicated they used echo reading. Responses regarding challenges that schools using the Fundations program faced were mostly consistent with overall trends across programs. However, technology was not as great of an issue, as only 16% of teachers using Fundations reported technology to be a challenge, whereas 27% of teachers across programs indicated this response. In addition, challenges associated with professional development were more widely reported by teachers using Fundations (37%) than reported by teachers regardless of program (25%).
Triumphs Literacy Program/Intervention Information
The grant coordinators of schools implementing Triumphs primarily allotted funds to professional development and personnel. Overall, across all programs, one-third of grant coordinators indicated they devoted grant funds to professional development and 42% of grant coordinators indicated that funds went to the personnel budget. Grant coordinators in schools implementing Triumphs reported using a combination of strategies of intervention delivery, whereas overall, grant coordinators indicated this method only 17% of the time. Challenges
Three of the four grant coordinators implementing Triumphs perceived time to implement the intervention as a challenge.
Center for Evaluation and Education Policy
23 of 80
Summary of Implementation Surveys
Successmaker Literacy Program/Intervention Information
Grant coordinators in schools using Successmaker indicated that the program is classwide. Teachers actually implementing Successmaker most often report using a class-wide strategy of intervention delivery (60%), but teachers also indicated using targeted small groups or a combination of strategies. Training
A variety of training methods were selected by grant coordinators and teachers as means of professional development. Not all teachers using Successmaker indicated they personally had been exposed to every type of training that the grant coordinators had selected. Challenges
No single challenge stood out as having the most impact, as indicated by the number of teachers that specified what their challenges were. Due to the relatively small number of grant coordinators and teachers that completed surveys and are implementing Successmaker, it is difficult to comment on additional trends and make comparisons.
Reading Recovery Literacy Program/Intervention Information
No grant coordinators in schools implementing Reading Recovery reported using a classwide strategy, while 37% of overall grant coordinators indicated this intervention delivery strategy. Teachers indicated that intervention was delivered to students one-on-one.
24 of 80
Center for Evaluation and Education Policy
Summary of Implementation Surveys
Training
All grant coordinators in schools using Reading Recovery indicated the main source of training was through a teacher or coach. Due to the relatively small number of grant coordinators and teachers that completed surveys and are implementing Reading Recovery with this portion of the Early Literacy Grant, it is difficult to comment on additional trends and make comparisons.
Read Well Literacy Program/Intervention Information
Grant coordinators reported that a combination of delivery strategies was used. Teachers implementing Read Well most often reported using a targeted small groups strategy of intervention delivery (60%), but teachers also indicated using a class wide strategy or a combination of strategies. Due to the relatively small number of grant coordinators and teachers that completed surveys and are implementing Read Well, it is difficult to comment on additional trends and make comparisons.
Center for Evaluation and Education Policy
25 of 80
Summary of Implementation Surveys
26 of 80
Center for Evaluation and Education Policy
3 Summary of Baseline Data Baseline data presented in this chapter indicate that students in Early Literacy Intervention Grant schools are in need of additional literacy instruction. A total of 87% of ELIGP schools submitted DIBELS or IRDA data. Of those students assessed using DIBELS, 39% were at baseline (on track to reading success), 34% were in need of additional strategic instruction, and 27% were in need of intensive intervention. Of those students assessed using IRDA, 44% had developed the literacy skills appropriate for their grade level; and 56% of students had not acquired appropriate skills. To assess the impact of ELIGP funding and progress towards student reading success in recipient schools, baseline data will be compared to data submitted in the late spring of 2008. These findings will be presented in the final ELIGP report which will be available in the summer of 2008.
3.1 Baseline Data for Early Reading Skills In the 2007-08 ELIGP, recipient schools were required to submit baseline results on student reading skills. Baseline data collection occurred within the first three months of the school year, with the recommendation to collect data as early as possible. Baseline data were submitted in the fall of 2007, and follow-up data are due in the late spring of 2008. This section presents the baseline data for student reading skills. These data provide a picture of the level of reading skill present in the schools that have participated in the Center for Evaluation and Education Policy
27 of 80
Summary of Baseline Data
ELIGP. These data also present a detailed overview of the level of need among students in recipient schools. Though the submission of assessment data was required of all recipient schools, no specific assessment was specified. However, it was highly recommended that participating schools administer and submit data from Dynamic Indicators of Basic Early Literacy skills (DIBELS) or the Indiana Reading Diagnostic Assessment (IRDA). Table 1 presents an overview of the assessment data submitted by recipient schools.
TABLE 1.
Number and Percent of Schools Submitting Assessment Data Assessment
Percent Schools
Number Schools
DIBELS
35%
37
IRDA
47%
50
Other
10%
11
No Data Submitted
8%
8
As seen in Table 1, the vast majority of the 106 participating schools submitted baseline assessment data; eight schools (8% of participants) did not submit assessment data. Of the schools that did submit data, over 80% used either DIBELS or IRDA. The following sections of this report will present an overview of baseline data for those schools that submitted DIBELS or IRDA data. Because of the small number of schools that submitted other forms of assessment data, an analysis of their progress will be reserved for the final Early Literacy Report which will be available in the summer of 2008.
Baseline DIBELS Data ELIGP recipients were awarded funds to provide literacy programming for students in pre-kindergarten through Grade 2. Each school proposed a different literacy plan; therefore, there is variation in the number of classrooms and grade levels served under the
28 of 80
Center for Evaluation and Education Policy
Summary of Baseline Data
ELIGP. Table 2 below provides an overview of the number of schools and students for whom DIBELS data were submitted.
TABLE 2.
Number of Schools and Students at Each Grade Level with DIBELS Data Pre-K
K
1st
2nd
Schools
Grade Level
0
30
32
24
Students
0
1302
1557
825
As seen in Table 2, DIBELS data were not submitted by any programs serving pre-kindergarten students. For students in kindergarten through Grade 2, DIBELS was used less often for students in Grade 2. Early Literacy Intervention Grants were awarded to improve literacy practice. Grant recipients purchased a range of curriculum materials and strategies to aid in the improvement of their literacy instruction. Table 3 presents the number of schools and students for whom data were submitted by the most frequently chosen programs.
TABLE 3.
Number of Schools and Students with DIBELS Data by Program Waterford
Voyager Passport
Triumph
Successmaker
Read Well
Schools
13
5
4
3
3
Students
2277
571
269
198
135
Program
As seen in Table 3, of those schools submitting DIBELS data, most schools used Waterford. Slightly fewer used Voyager Passport and Triumphs. An equal number used Read Well and Successmaker. Similarly, for those students who were assessed with DIBELS, the vast majority of students were instructed using Waterford. Fewer students were instructed using Voyager Passport. Similar numbers of students were instructed using Read Well, Successmaker, and Triumphs.
Center for Evaluation and Education Policy
29 of 80
Summary of Baseline Data
Kindergarten Baseline Data
This section presents the DIBELS baseline data for kindergarten students served under the ELIGP. Figures 1 through 5 below show the percent of students who are benchmark, strategic, or intensive overall and for their respective literacy programs. For comparison, the average performance of students across all programs is provided. Benchmark status indicates that the student is on track—with continued instruction—to be a successful reader. Strategic students need additional instructional support or they are unlikely to become accomplished readers. Intensive students need intensive instructional help or they are very unlikely to become successful readers.
FIGURE 1.
Percent Kindergarten Students at Benchmark, Strategic or Intensive
As indicated in Figure 1, 40% of the kindergarten students assessed with DIBELS and instructed with the aid of ELIGP funds were at benchmark. A total of 29% were in need of strategic support and 31% were in need of intensive support to become readers.
30 of 80
Center for Evaluation and Education Policy
Summary of Baseline Data
FIGURE 2.
Waterford: Percent Kindergarten Students at Benchmark, Strategic or Intensive
As indicated in Figure 2, about two-thirds of the kindergarten students being instructed with Waterford and assessed using DIBELS were at benchmark. A total of 19% needed strategic support and 15% were in need of intensive support. As compared to ELIGP averages, students instructed with Waterford were much more likely to begin the 2007-08 school year at benchmark.
Center for Evaluation and Education Policy
31 of 80
Summary of Baseline Data
FIGURE 3.
Read Well: Percent Kindergarten Students at Benchmark, Strategic or Intensive
As indicated in Figure 3, 39% of the kindergarten students being instructed using Read Well and assessed using DIBELS were at benchmark. A total of 22% needed strategic support and 39% were in need of intensive support. Students instructed with Read Well began 2007-08 with levels of performance similar to ELIGP averages.
32 of 80
Center for Evaluation and Education Policy
Summary of Baseline Data
FIGURE 4.
Successmaker: Percent Kindergarten Students at Benchmark, Strategic or Intensive
As indicated in Figure 4, about two-thirds of the kindergarten students being instructed using Successmaker and assessed using DIBELS were at benchmark. A total of 13% needed strategic support and 21% were in need of intensive support. As compared to ELIGP averages, students instructed with Successmaker were much more likely to begin the 2007-08 school year at benchmark.
Center for Evaluation and Education Policy
33 of 80
Summary of Baseline Data
FIGURE 5.
Voyager Passport: Percent Kindergarten Students at Benchmark, Strategic or Intensive
As indicated in Figure 5, almost fifty percent of the kindergarten students being instructed with Voyager Passport and assessed using DIBELS were at benchmark. A total of 28% needed strategic support and 23% were in need of intensive support. Students instructed with Voyager Passport began 2007-08 with levels of performance similar to ELIGP averages. First Grade Baseline Data
This section presents the DIBELS baseline data for Grade 1 students served under ELIGP instruction. Figures 6 through 11 below show the percent of students who are benchmark, strategic, or intensive in their respective literacy programs. Again, the Benchmark status indicates that the student is on track—with continued instruction—to be a successful reader. Strategic students need additional instructional
34 of 80
Center for Evaluation and Education Policy
Summary of Baseline Data
support or they are unlikely to become accomplished readers. Intensive students need intensive instructional help or they are very unlikely to become successful readers.
FIGURE 6.
Percent First Grade Students at Benchmark, Strategic or Intensive
As indicated in Figure 6, 44% of first grade students assessed with DIBELS and instructed with the aid of ELIGP funds were at benchmark. A total of 31% were in need of strategic support and 25% were in need of intensive support to become readers.
Center for Evaluation and Education Policy
35 of 80
Summary of Baseline Data
FIGURE 7.
Waterford: Percent First Grade Students at Benchmark, Strategic or Intensive
As indicated in Figure 7, over three-fourths of the Grade 1 students being instructed with Waterford and assessed with DIBELS were at benchmark. A total of 17% needed strategic support and 7% were in need of intensive support. As compared to ELIGP averages, students instructed with Waterford were much more likely to begin the 2007-08 school year at benchmark.
36 of 80
Center for Evaluation and Education Policy
Summary of Baseline Data
FIGURE 8.
Read Well: Percent First Grade Students at Benchmark, Strategic or Intensive
As indicated in Figure 8, 22% of the Grade 1 students being instructed in using Read Well and assessed using DIBELS were at benchmark. A total of 56% needed strategic support and 22% were in need of intensive support. As compared to ELIGP averages, students instructed with Read Well were much more likely to begin the 2007-08 school year as strategic.
Center for Evaluation and Education Policy
37 of 80
Summary of Baseline Data
FIGURE 9.
Successmaker: Percent First Grade Students at Benchmark, Strategic or Intensive
As indicated in Figure 9, 60% of the Grade 1 students being instructed in using Successmaker and assessed using DIBELS were at benchmark. A total of 26% needed strategic support and 15% were in need of intensive support. As compared to ELIGP averages, students instructed with Successmaker were more likely to begin the 2007-08 school year at benchmark.
38 of 80
Center for Evaluation and Education Policy
Summary of Baseline Data
FIGURE 10.
Voyager Passport: Percent First Grade Students at Benchmark, Strategic or Intensive
As indicated in Figure 10, nearly half of the Grade 1 students instructed using Voyager Passport and assessed using DIBELS were at benchmark. A total of 41% needed strategic support and 11% were in need of intensive support. As compared to ELIGP averages, students instructed with Voyager Passport were less likely to begin the 2007-08 school year as intensive.
Center for Evaluation and Education Policy
39 of 80
Summary of Baseline Data
FIGURE 11.
Triumphs: Percent First Grade Students at Benchmark, Strategic or Intensive
As indicated in Figure 11, 65% of the Grade 1 students being instructed using Triumphs and assessed using DIBELS were at benchmark. A total of 25% needed strategic support and 10% were in need of intensive support. As compared to ELIGP averages, students instructed with Triumphs were more likely to begin the 2007-08 school year at benchmark. Second Grade Baseline Data
This section presents the DIBELS baseline data for Grade 2 students served under the ELIGP. Figures 12 through 16 below show the percent of students who are benchmark, strategic, or intensive in their respective literacy programs. The Benchmark status indicates that the student is on track—with continued instruction—to be a successful reader. Strategic students need additional instructional support
40 of 80
Center for Evaluation and Education Policy
Summary of Baseline Data
or they are unlikely to become accomplished readers. Intensive students need intensive instructional help or they are very unlikely to become successful readers.
FIGURE 12.
Percent Second Grade Students at Benchmark, Strategic or Intensive
As indicated in Figure 12, 32% of the Grade 2 students assessed with DIBELS and instructed with the aid of Early Literacy Grant funds were at benchmark. A total of 43% were in need of strategic support and 25% were in need of intensive support to become readers.
Center for Evaluation and Education Policy
41 of 80
Summary of Baseline Data
FIGURE 13.
Waterford: Percent Second Grade Students at Benchmark, Strategic or Intensive
As indicated in Figure 13, 58% of the Grade 2 students being instructed with Waterford and assessed with DIBELS were at benchmark. A total of 29% needed strategic support and 13% were in need of intensive support. As compared to ELIGP averages, students instructed with Waterford were much more likely to begin the 2007-08 school year at benchmark.
42 of 80
Center for Evaluation and Education Policy
Summary of Baseline Data
FIGURE 14.
Read Well: Percent Second Grade Students at Benchmark, Strategic or Intensive
As indicated in Figure 14, 42% of the Grade 2 students being instructed in using Read Well and assessed using DIBELS were at benchmark. A total of 55% needed strategic support and 3% were in need of intensive support. As compared to ELIGP averages, students instructed with Read Well were less likely to begin the 2007-08 school year as intensive.
Center for Evaluation and Education Policy
43 of 80
Summary of Baseline Data
FIGURE 15.
Successmaker: Percent Second Grade Students at Benchmark, Strategic or Intensive
As indicated in Figure 15, 70% of the Grade 2 students being instructed in using Successmaker and assessed using DIBELS were at benchmark. A total of 19% needed strategic support and 11% were in need of intensive support. As compared to ELIGP averages, students instructed with Successmaker were much more likely to begin the 2007-08 school year at benchmark.
44 of 80
Center for Evaluation and Education Policy
Summary of Baseline Data
FIGURE 16.
Voyager Passport: Percent Second Grade Students at Benchmark, Strategic or Intensive
As indicated in Figure 16, 53% of the second grade students being instructed using Voyager Passport and assessed using DIBELS were at benchmark. A total of 26% needed strategic support and 21% were in need of intensive support. As compared to ELIGP averages, students instructed with Voyager Passport were more likely to begin the 2007-08 school year at benchmark. Baseline DIBELS Summary
Based on early literacy research, it is expected that in the general population of young students, 80% of all students will be performing at the benchmark level, 15% of students will struggle with basic early reading skills and will need to be placed in the strategic intervention group, and 5% of students require intensive intervention (Lyon, 1997; Shinn, Walker, & Stoner, 2002; Torgesen, 2000).
Center for Evaluation and Education Policy
45 of 80
Summary of Baseline Data
As compared to these expectations of the general population, students served in ELIGP schools and assessing students with DIBELS are falling behind. Table 4 presents DIBELS baseline data for all ELIGP students as well as those instructed with the top five programs.
TABLE 4.
Comparison of DIBELS Data for ELIGP Students and Expected Achievement General Population
All ELIGP Students
Waterford
Read Well
Successmaker
Voyager Passport
Triumphs
Benchmark
80%
39%
67%
34%
65%
50%
65%
Strategic
15%
34%
22%
44%
19%
32%
25%
Intensive
5%
27%
11%
21%
16%
18%
10%
As seen in Table 4, students served in ELIGP schools (most notably, those using Read Well) are less likely to be on track to be a good reader and more likely to need strategic or intensive support than is expected in the general population. These percentages represent an equal weighting of all programs. In other words, programs that served a small number of students contributed equally to overall percentages as programs with a large number of students. When programs are not weighed equally, programs with large numbers of students dominate. For example, of the programs using DIBELS, Waterford served two-thirds of the total students. Waterford and Voyager Passport together served over 80% of the total number of students. In this calculation, 62% of students began the 2007-08 academic year at benchmark. This is because those schools that used Waterford or Voyager Passport have a large number of students already at benchmark. Data from the survey indicate that schools using Waterford frequently used a whole class strategy for ELIGP delivery. These data combined with DIBELS data suggest that some schools, most notably those using Waterford, may benefit from refocusing their strategy for identifying students in need of intervention. Since most students began the school
46 of 80
Center for Evaluation and Education Policy
Summary of Baseline Data
year at benchmark status, grant schools may want to consider concentrating the use of ELIGP funds on the at-risk population.
Baseline IRDA Data Early Literacy Grant recipients were awarded funds to provide literacy programming for students in pre-kindergarten through Grade 2. Each school proposed a different literacy plan; therefore, there is variation in the number of classrooms and grade levels served under the Early Literacy Intervention Grant. Table 5 below provides an overview of the number of schools and students for whom IRDA data were submitted.
TABLE 5.
Number of Schools and Students for Whom IRDA Data Were Submitted Grade Level
Pre-K
K
1st
2nd
Schools
0
33
43
39
Students
0
1773
2806
2254
As seen in Table 5, IRDA data were not submitted by any programs serving pre-kindergarten students. Of those schools submitting IRDA data, Grade 1 and Grade 2 students were more frequently assessed than kindergarteners. Early Literacy Intervention Grants are awarded to improve literacy practice. Grant recipients purchased a range of curriculum materials and strategies to aid in the improvement of their literacy instruction. Table 6 presents the most common Early Literacy programs purchased by grant recipients who submitted IRDA data and the number of schools and students for whom data were submitted.
TABLE 6.
Number of Schools and Students Participating in the Most Common Early Literacy Programs Waterford
Fundations
EIR
Voyager Passport
Reading Recovery
Schools
21
10
10
2
3
Students
2606
1374
1672
330
259
Program
Center for Evaluation and Education Policy
47 of 80
Summary of Baseline Data
As seen in Table 6, of those schools submitting IRDA data, the vast majority used Waterford. A similar number of schools used Fundations or EIR and a similar number of schools used Reading Recovery or Voyager Passport. Kindergarten Baseline Data
This section presents the IRDA baseline data for kindergarten students served under the ELIGP. Figures 17 through 20 below show the percent of students who have developed the appropriate literacy skills for their grade level.
FIGURE 17.
Percent Kindergarten Students Still Developing/Developed
As indicated in Figure 17, about three-fourths of kindergarten students assessed using IRDA were still developing the necessary literacy skills for their grade level.
48 of 80
Center for Evaluation and Education Policy
Summary of Baseline Data
FIGURE 18.
Waterford: Percent Kindergarten Students Still Developing/Developed
As indicated in Figure 18, the almost 80% of kindergarten students being instructed with Waterford and assessed using IRDA were still developing the necessary literacy skills for their grade level. These percentages are similar to those for all ELIGP students assessed using IRDA.
Center for Evaluation and Education Policy
49 of 80
Summary of Baseline Data
FIGURE 19.
Voyager Passport: Percent Kindergarten Students Still Developing/Developed
As indicated in Figure 19, slightly over 80% of kindergarten students being instructed with Voyager Passport and assessed using IRDA were still developing the necessary literacy skills for their grade level. These percentages are similar to those for all ELIGP students assessed using IRDA.
50 of 80
Center for Evaluation and Education Policy
Summary of Baseline Data
FIGURE 20.
Fundations: Percent Kindergarten Students Still Developing/Developed
As indicated in Figure 20, a little over 90% of kindergarten students being instructed with Fundations and assessed using IRDA were still developing the necessary literacy skills for their grade level. As compared to all ELIGP students assessed using IRDA, students instructed using Fundations were less likely to have already developed their grade level reading skills. First Grade Baseline Data
This section presents the IRDA baseline data for Grade 1 students served under the ELIGP. Figures 21 through 26 below show the percent of students who have developed the appropriate literacy skills for their grade level. These data are presented for each literacy program.
Center for Evaluation and Education Policy
51 of 80
Summary of Baseline Data
FIGURE 21.
Percent First Grade Students Still Developing/Developed
As indicated in Figure 21, almost half of Grade 1 students assessed using IRDA were still developing the necessary literacy skills for their grade level.
52 of 80
Center for Evaluation and Education Policy
Summary of Baseline Data
FIGURE 22.
Waterford: Percent First Grade Students Still Developing/Developed
As indicated in Figure 22, slightly over 40% of Grade 1 students instructed using Waterford and assessed using IRDA were still developing the necessary literacy skills for their grade level. These percentages are similar to those for all ELIGP students assessed using IRDA.
Center for Evaluation and Education Policy
53 of 80
Summary of Baseline Data
FIGURE 23.
Reading Recovery: Percent First Grade Students Still Developing/Developed
As indicated in Figure 23, one-third of Grade 1 students instructed using Reading Recovery and assessed using IRDA were still developing the necessary literacy skills for their grade level.
54 of 80
Center for Evaluation and Education Policy
Summary of Baseline Data
FIGURE 24.
Voyager Passport: Percent First Grade Students Still Developing/Developed
As indicated in Figure 24, about 23% of Grade 1 students instructed using Voyager Passport and assessed using IRDA were still developing the necessary literacy skills for their grade level. As compared to all ELIGP students assessed using IRDA, students instructed using Voyager Passport were less likely to have already developed their grade level reading skills.
Center for Evaluation and Education Policy
55 of 80
Summary of Baseline Data
FIGURE 25.
Fundations: Percent First Grade Students Still Developing/Developed
As indicated in Figure 25, slightly less than half of first grade students instructed using Fundations and assessed using IRDA were still developing the necessary literacy skills for their grade level. These percentages are similar to those for all ELIGP students assessed using IRDA.
56 of 80
Center for Evaluation and Education Policy
Summary of Baseline Data
FIGURE 26.
EIR: Percent First Grade Students Still Developing/Developed
As indicated in Figure 26, about 42% of Grade 1 students instructed using EIR and assessed using IRDA were still developing the necessary literacy skills for their grade level. These percentages are similar to those for all ELIGP students assessed using IRDA. Second Grade Baseline Data
This section presents the IRDA baseline data for Grade 2 students served under the ELIGP. Figures 27 through 32 below show the percent of students who have developed the appropriate literacy skills for their grade level. These data are presented for each literacy program.
Center for Evaluation and Education Policy
57 of 80
Summary of Baseline Data
FIGURE 27.
Percent Second Grade Students Still Developing/Developed
As indicated in Figure 27, slightly under half of Grade 2 students assessed using IRDA were still developing the necessary literacy skills for their grade level.
58 of 80
Center for Evaluation and Education Policy
Summary of Baseline Data
FIGURE 28.
Waterford: Percent Second Grade Students Still Developing/Developed
As indicated in Figure 28, around 38% of Grade 2 students instructed with Waterford and assessed using IRDA were still developing the necessary literacy skills for their grade level.
Center for Evaluation and Education Policy
59 of 80
Summary of Baseline Data
FIGURE 29.
Reading Recovery: Percent Second Grade Students Still Developing/Developed
As indicated in Figure 29, almost three-fourths of Grade 2 students instructed with Reading Recovery and assessed using IRDA were still developing the necessary literacy skills for their grade level. As compared to ELIGP averages, students instructed with Reading Recovery were much more likely to begin the 2007-08 school year still developing these necessary skills.
60 of 80
Center for Evaluation and Education Policy
Summary of Baseline Data
FIGURE 30.
Voyager Passport: Percent Second Grade Students Still Developing/Developed
As indicated in Figure 30, about 11% of Grade 2 students instructed with Voyager Passport and assessed using IRDA were still developing the necessary literacy skills for their grade level. As compared to ELIGP averages, students instructed with Voyager Passport were much more likely to begin the 2007-08 school year with skills developed for their grade level.
Center for Evaluation and Education Policy
61 of 80
Summary of Baseline Data
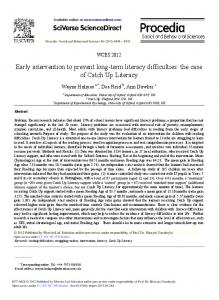
FIGURE 31.
Fundations: Percent Second Grade Students Still Developing/Developed
As indicated in Figure 31, 61% of Grade 2 students instructed using Fundations and assessed using IRDA were still developing the necessary literacy skills for their grade level.
62 of 80
Center for Evaluation and Education Policy
Summary of Baseline Data
FIGURE 32.
EIR: Percent Second Grade Students Still Developing/Developed
As indicated in Figure 32, a little over one-third of Grade 2 students instructed using EIR and assessed using IRDA were still developing the necessary literacy skills for their grade level. Baseline IRDA Summary
Table 7 below presents IRDA baseline data for all ELIGP students as well as those instructed with the top five programs.
TABLE 7.
Comparison of IRDA Data for ELIGP Students All ELIGP Students
Waterford
Reading Recovery
Voyager Passport
Fundations
EIR
Still Developing
56%
53%
54%
38%
67%
38%
Developed
44%
47%
46%
62%
33%
62%
Center for Evaluation and Education Policy
63 of 80
Summary of Baseline Data
As seen in Table 7, overall, a little more than half of students served in ELIGP schools are still developing the appropriate reading skills for their grade level. As seen in the previous section, kindergarten students in schools using IRDA were much more likely to still be developing appropriate reading skills. This applies to the following programs including: Waterford, Fundations, Voyager Passport. As seen in Table 7, students served using Fundations are much more likely to still be developing appropriate reading skills. Kindergarten students as well as Grade 2 students in schools using Fundations were still developing. Schools using Voyager Passport and EIR and using IRDA are more likely to have students that have developed appropriate reading skills. Schools using Voyager Passport have a large proportion of Grade 1 and 2 students having developed appropriate reading skills; this counterbalances the kindergarten students that are still developing. Schools using EIR did not serve kindergarten students in their ELIGP intervention; therefore, their overall percentages of students having developed their reading skills are larger than the overall percentages for all ELIGP students assessed with IRDA.
64 of 80
Center for Evaluation and Education Policy
4 References Analysis if Indiana’s Mathematics and Reading Scores on the 2007 National Assessment of Educational Progress. (2007). Focus on Indiana. Bloomington, IN: Center for Evaluation & Education Policy. “Center for Literacy Education and Research.” (2007). Purdue University College of Education. Retrieved January 25, 2008, from http://clear.education.purdue.edu. “Dynamic Indicators of Basic Early Literacy Skills.” Big Ideas in Beginning Reading. (2004). Institute for the Development of Educational Achievement. Retrieved January 31, 2008, from http://reading.uoregon.edu/. Indiana Reading Diagnostic Assessment- First Grade: General Information (2007). Indiana University Center for Innovation and Assessment, Indiana Department of Education. Indiana Reading Diagnostic Assessment- Kindergarten: General Information (2007). Indiana University Center for Innovation and Assessment, Indiana Department of Education. Indiana Reading Diagnostic Assessment- Second Grade: General Information (2007). Indiana University Center for Innovation and Assessment, Indiana Department of Education. Kaminski, R., Good, R. & Knutson, N. (2006). Essential Workshop: DIBELS Training Institute. “Official DIBELS Home Page.” DIBELS (2007). University of Oregon Center on Teaching and Learning. Retrieved January 31, 2008, from http:// dibels.uoregon.edu/.
Center for Evaluation and Education Policy
65 of 80
References
Palozzi, V. J., Spradlin, T. E., Stanley, K. (2006). Is the Indiana Early Literacy Intervention Grant Program Working? Bloomington, IN: Center for Evaluation & Education Policy. Plucker, J. A., Simmons, A. B., Ravert, R. (2005). Indiana’s Early Literacy Intervention Grant Program: 1997-2004. Bloomington, IN: Center for Evaluation & Education Policy. “Reading Recovery Council of North America.” (2008). Reading Recovery Council of North America. Retrieved January 25, 2008, from http://www.readingrecovery.org. Shinn, M. R., Stoner, G., Walker, M. (Eds.) (2006), Interventions for academic and behavior problems: Preventive and remedial approaches. Bethesda, MD: National Association of School Psychologists. Torgeson, J. K. (2000). Individual differences in response to early interventions in reading: The lingering problem of treatment resisters. Learning Disabilities Research & Practice, 15, 55-64.
66 of 80
Center for Evaluation and Education Policy
5 Appendix A: Grant School Information TABLE 8.
Summary of Funded Schools and Grade Levels
Corporation Anderson Community Schools
School
Program
Targeted Grade Levels
Assessment Instrument
Funding
Erskine
Waterford
K
IRDA
$27,874
1,2
IRDA
$22,091
1,2
IRDA
$16,656
1,2
IRDA
$14,899
1,2
IRDA
$15,071
1,2
IRDA
$20,448
1,2
IRDA
$17,970
1,2
IRDA
$20,868
1,2
IRDA
$16,692
1,2
IRDA
$19,795
1,2
IRDA
$22,552
K,1,2
IRDA
$45,821
Clifty Creek
Fodrea
Lincoln
Mt. Healthy
Parkside
Bartholomew Consoli-
SRA Early Interventions in Reading SRA Early Interventions in Reading SRA Early Interventions in Reading SRA Early Interventions in Reading SRA Early Interventions in Reading
dated School Corporation
W.D. Richards
Schmitt
L.F. Smith
Southside
Taylorsville Bloomfield School District
Bloomfield
SRA Early Interventions in Reading SRA Early Interventions in Reading SRA Early Interventions in Reading SRA Early Interventions in Reading SRA Early Interventions in Reading Waterford
Center for Evaluation and Education Policy
67 of 80
Appendix A: Grant School Information
Corporation
School
Center Grove Community Schools
Cloverdale Community Schools Concord Community Schools
Program
Targeted Grade Levels
Assessment Instrument
Funding $43,556
Center Grove
Waterford
K,1
DIBELS
Maple Grove
Waterford
K,1
DIBELS/IRDA
$43,556
North Grove
Waterford
K,1
DIBELS
$43,556 $43,556
Pleasant Grove
Waterford
K,1
DIBELS
Sugar Grove
Waterford
K,1
DIBELS/IRDA
$43,556
West Grove
Waterford
K,1
DIBELS
$43,556
Cloverdale
Voyager Passport
K
DIBELS/IRDA
$19,852
Concord West Side
LINKS
K,1,2
DIBELS/IRDA
$17,360
K,1,2
Literacy Collaborative
$71,470
Literacy Collaborative
$67,600
Waterford (K,1) Watson
Dekalb County Central
Voyager Passport (2)
Unified School District McKenney-Harrison
Delaware Community Schools
Albany
Waterford
K,1,2
IRDA
$29,641
DeSoto
Waterford
K,1,2
IRDA
$32,202
Eaton
Waterford
K,1,2
IRDA
$30,641
Royerton
Waterford
K,1,2
IRDA
$30,796
Waterford
K
IRDA
$10,775
Eastern Greene
Waterford
1,2
DIBELS/IRDA
$39,295
J.E. Ober
Waterford
K,1,2
DIBELS
$30,439
Gary Lighthouse
Waterford
K,1,2
DIBELS
$34,305
Hamilton
Waterford
K,1,2
DIBELS
$44,000
Jane Ball
Parents as Teachers
Pre-K
Get it, got it, go
$24,675
Indianapolis Lighthouse
Waterford
K,1,2
NWEA-MAP
$15,737
Pre-K
Peabody/Brigance
East Chicago Light-
East Chicago Light-
house Charter School
house
Eastern Greene Schools Garrett-Keyser-Butler Schools Gary Lighthouse Charter School Hamilton Community Schools Hanover Central School Corporation Indianapolis Lighthouse Charter School Indianapolis Public
District-Wide
Schools
Jay School Corporationi
Waterford
Breakthrough to Literacy
East
Waterford
K,1,2
IRDA
$39,256
General Shanks
Waterford
K,1,2
DIBELS
$39,182
Judge Haynes
Waterford
K,1,2
IRDA
$35,342 $39,256
Red Key
Waterford
K,1,2
IRDA
Westlawn
Waterford
K,1,2
IRDA
$38,601
Bon Air
Waterford
K,1,2
IRDA
$48,381
Boulevard
Waterford
K,1,2
IRDA
$11,303
Darrough Chapel
Waterford
K,1,2
IRDA
$33,712
Elwood Haynes
Waterford
K,1,2
IRDA
$41,878
Maple Crest
Waterford
K,1,2
IRDA
$60,674
Pettit Park
Waterford
K,1,2
IRDA
$39,871
Sycamore
Waterford
K,1,2
IRDA
$35,639
Washington
Waterford
K,1,2
IRDA
$42,446
Kokomo Center Schools
68 of 80
Center for Evaluation and Education Policy
Appendix A: Grant School Information
School
Program
Targeted Grade Levels
Assessment Instrument
Funding
Parkside
Reading Recovery
1,2
IRDA
$16,500
Lawrenceburg
Waterford
2
Waterford
$51,758
Linton-Stockton
Waterford
K,1,2
DIBELS
$22,241
Manchester
Reading Recovery
K,1,2
MAP/Rigby
$14,985
Riverview
Waterford
K,1,2
DIBELS
$27,400
District-Wide
Fundations
Pre-K,K,1,2
IRDA
$61,461
Mill Creek Community
Mill Creek East
Voyager Passport
K,1,2
DIBELS/IRDA
$26,860
School Corporation
Mill Creek West
Voyager Passport
K,1,2
DIBELS/IRDA
$23,410
Westview
Waterford
K,1,2
IRDA
$31,320
Early Childhood Center
Waterford
K
DIBELS
$14,339
Harrison Hill
Fluent Reader
1,2
IRDA
$12,000
Charles L. Smith
Phonetics Connections
K,1,2
DIBELS
$14,996
Corporation Lakeland School Corporation Lawrenceburg Community School Corporatioin Linton-Stockton School Corporation Manchester Community Schools Marion Community Schools Michigan City Area Schools
Mississinewa Community Schools MSD Decatur Township MSD Lawrence Township MSD Martinsville
Central
Voyager Passport
K,1,2
DIBELS
$19,540
MSD Warren County
Williamsport
WINS
K,1,2
DIBELS
$22,720
MSD Southwest Allen
Whispering Meadows
Waterford
1
DIBELS
$14,630
Lafayette Meadows
Waterford
K,1,2
DIBELS
$14,050
Eastridge
Voyager Passport
K,1,2
DIBELS
$11,940
Heather Hills
Voyager
K,1,2
DIBELS
$17,663
Pre-K
Yopp Singer/Peabody
$18,683
County MSD Warren Township MSD Washington
Greenbriar
Township
Breakthrough to Literacy
Mt. Pleasant Township Community School Cor-
Pleasant View
Waterford
K,1,2
IRDA
$42,337
Eastwood
Waterford
K
IRDA
$35,656
poration New Castle Community School Corporation North Adams Community Schools
Monmouth
Read Well
K,1,2
DIBELS
$29,342
Northwest
Read Well
K,1,2
DIBELS
$30,033
Southeast
Read Well
K,1,2
DIBELS
$36,564 $8,013
Sommer
Voyager Passport
K,1,2
DIBELS
Community School Cor-
Pleasant Hill
Voyager Passport
K,1,2
DIBELS
$9,855
poration
Sugar Creek
Voyager Passport
K,1,2
DIBELS
$9,855
Throop
Literacy Circles
K,1
IRDA
$22,032
Highland Heights
Waterford
Pre-K,K,1,2
DIBELS
$21,225
Pre-K,K
Get Ready to Read!
$11,800
North Montgomery
Paoli Community School Corporation Richmond Community Schools Rockville Community Schools
Rockville
Saxon Early Learning and LiPS
Center for Evaluation and Education Policy
69 of 80
Appendix A: Grant School Information
Corporation
School
School Town of Speedway Southeast Fountain Schools
Twin Lakes School Corporation
Vigo County School Corporation
Wes Del Community Schools West Gary Lighthouse Charter School West Noble School Corporation
nity Schools (Lebanon)
Schools
70 of 80
Assessment Instrument
Funding
Successmaker
K,1,2
DIBELS
$25,600
Carl G. Fisher
Successmaker
K,1,2
DIBELS
$25,600
James A. Allison
Successmaker
K,1,2
DIBELS
$25,600
Southeast Fountain
Waterford
K
DIBELS
$23,600 $15,000
Eastlawn
Read Naturally
2
DIBELS
Meadowlawn
Scott Foresman
K
DIBELS
$17,302
Oaklawn
Build Up Phonics
1,2
DIBELS
$15,000
Woodlawn
Fluency First
K,1,2
DIBELS
$22,306
Benjamin Frankliln
Triumphs
K,1
DIBELS
$25,449
Fuqua
Triumphs
K,1
DIBELS
$25,763
Farrington Grove
Triumphs
K,1
DIBELS
$27,384
Meadows
Triumphs
K,1
DIBELS
$25,448
Wes Del
Waterford
K,1,2
IRDA
$49,315
West Gary Lighthouse
Waterford
K
NWEA-MAP
$15,737
Ligonier
Reading Recovery
1
IRDA
$15,500
West Noble
Reading Recovery
1
IRDA
$15,500
Harney
Thorntown Whitko Community
Targeted Grade Levels
Arthur C. Newby
Granville Wells Western Boone Commu-
Program
Breakthrough to Literacy Breakthrough to Literacy Breakthrough to Literacy
Pre-K
Pre-K
Pre-K
Brigance Preschool Screening II Brigance Preschool Screening II
$33,000
Brigance Preschool Screen II
Pierceton
A-OK
K
DIBELS
$16,474
South Whitley
Read Naturally, LiPS
K,1,2
DIBELS
$18,884
Center for Evaluation and Education Policy
Appendix A: Grant School Information
TABLE 9.
Demographic Information for All Programs Early Literacy Program
School
Ethnicity Informationc d
ISTEP Scoresa
% FRL
55%
b White
Black
Hispanic
Asian
Multi racial
Native American
48%
71%
18%
3%
0%
1%
7%
56%
43%
73%
4%
14%
4%
0%
6%
62%
72%
74%
2%
10%
6%
0%
7%
58%
86%
82%
2%
6%
1%
0%
10%
84%
33%
98%
0%
0%
1%
0%
1%
82%
23%
78%
1%
7%
8%
1%
5%
78%
28%
86%
2%
5%
2%
1%
5%
76%
47%
85%
3%
3%
1%
0%
8%
76%
46%
80%
2%
4%
3%
2%
9%
80%
19%
85%
1%
6%
5%
1%
3%
63%
48%
75%
0%
20%
0%
1%
4%
Waterford
65%
33%
96%
0%
1%
0%
0%
3%
Waterford
92%
5%
93%
1%
1%
3%
0%
2%
Maple Grove Elementary
Waterford
89%
8%
94%
0%
1%
1%
1%
2%
North Grove Elementary
Waterford
89%
9%
94%
1%
2%
1%
0%
2%
Waterford
95%
7%
91%
0%
2%
2%
0%
4%
Sugar Grove Elementary
Waterford
95%
7%
92%
2%
2%
3%
0%
2%
West Grove Elementary
Waterford
95%
5%
92%
0%
3%
3%
0%
1%
Cloverdale Elementary
Voyager Passport
87%
51%
93%
0%
1%
1%
1%
4%
LINKS
48%
68%
31%
10%
49%
1%
0%
9%
76%
31%
93%
1%
4%
1%
0%
1%
Waterford
69%
28%
94%
0%
3%
0%
0%
2%
Albany Elementary
Waterford
80%
42%
97%
0%
0%
0%
0%
2%
DeSoto Elementary
Waterford
89%
21%
97%
1%
1%
0%
0%
1%
Eaton Elementary
Waterford
71%
49%
98%
0%
0%
0%
1%
1%
Erskine Elementary
Waterford
Clifty Creek Elementary
Early Interventions in Reading Early Interventions in
Fodrea Community
Reading Early Interventions in
Lincoln Elementary
Reading
Mt. Healthy Elementary
Early Interventions in Reading Early Interventions in
Parkside Elementary
Reading
W.D. Richards Elemen-
Early Interventions in
tary
Reading
Lillian Schmitt Elemen-
Early Interventions in
tary
Reading Early Interventions in
L.F. Smith Elementary
Reading Early Interventions in
Southside Elementary
Reading
Taylorsville Elementary Bloomfield Elementary Center Grove Elementary
Pleasant Grove Elementary
Concord West Side Elementary
Early Interventions in Reading
James R. Watson Ele-
Waterford (K,1)
mentary
Voyager Passport (2)
McKenney-Harrison Elementary
Center for Evaluation and Education Policy
71 of 80
Appendix A: Grant School Information
Ethnicity Informationc d
ISTEP Scoresa
% FRLb
Waterford
91%
Waterford
Early Literacy Program
School
White
Black
Hispanic
Asian
Multi racial
Native American
19%
94%
3%
0%
1%
0%
2%
21%
92%
2%
63%
31%
0%
0%
3%
Waterford
75%
49%
98%
0%
0%
0%
0%
2%
Waterford
81%
45%
94%
0%
3%
1%
0%
2%
Waterford
39%
78%
0%
98%
1%
0%
0%
1%
Waterford
52%
27%
99%
0%
0%
0%
0%
1%
Parents as Teachers
78%
26%
90%
0%
5%
0%
1%
3%
Waterford
41%
81%
33%
58%
4%
1%
0%
4%
Breakthrough to Literacy
66%
83%
25%
58%
12%
0%
0%
4%
Waterford
83%
41%
97%
0%
1%
0%
0%
1%
Waterford
80%
41%
93%
0%
5%
1%
0%
0%
Waterford
76%
61%
82%
0%
16%
1%
0%
1%
Red Key Elementary
Waterford
84%
51%
97%
1%
0%
1%
0%
0%
Westlawn Elementary
Waterford
80%
59%
99%
0%
0%
0%
0%
1%
Bon Air Elementary
Waterford
69%
70%
76%
15%
2%
0%
1%
7%
Boulevard Elementary
Waterford
70%
37%
78%
13%
1%
1%
1%
6%
Waterford
63%
71%
65%
24%
1%
1%
0%
9%
Waterford
83%
77%
70%
14%
1%
0%
1%
14%
Maple Crest Elementary
Waterford
76%
40%
73%
15%
2%
1%
0%
9%
Pettit Park Elementary
Waterford
67%
73%
78%
9%
2%
0%
1%
9%
Sycamore Elementary
Waterford
85%
58%
49%
27%
7%
7%
0%
11%
Washington Elementary
Waterford
91%
58%
78%
6%
3%
0%
0%
12%
Parkside Elementary
Reading Recovery
73%
42%
80%
0%
16%
1%
0%
3%
Waterford
N/A
37%
96%
0%
1%
1%
0%
1%
Waterford
84%
40%
98%
0%
0%
1%
0%
2%
Manchester Elementary
Reading Recovery
80%
38%
93%
1%
2%
0%
0%
4%
Riverview Elementary
Waterford
89%
26%
71%
14%
6%
3%
0%
6%
Fundations
64%
60%
56%
31%
4%
1%
1%
7%
Royerton Elementary East Chicago Lighthouse Charter School Eastern Greene Elementary J.E. Ober Elementary Gary Lighthouse Charter School Hamilton Community Elementary Jane Horton Ball Elementary Indianapolis Lighthouse Charter School Indianapolis Public Schoolse East Elementary General Shanks Elementary Judge Haynes Elementary
Darrough Chapel Elementary Elwood Haynes Elementary
Lawrenceburg Primary School Linton-Stockon Elementary
Michigan City Area Schoolsf
72 of 80
Center for Evaluation and Education Policy
Appendix A: Grant School Information
Ethnicity Informationc d
ISTEP Scoresa
% FRLb
Voyager Passport
83%
Voyager Passport
Early Literacy Program
School
White
Black
Hispanic
Asian
Multi racial
Native American
17%
97%
0%
1%
2%
0%
1%
85%
25%
99%
0%
1%
0%
0%
1%
Waterford
69%
52%
93%
1%
3%
0%
0%
4%
Early Childhood Center
Waterford
N/A
35%
85%
5%
5%
1%
0%
4%
Harrison Hill Elementary
Fluent Reader
68%
74%
30%
37%
20%
3%
1%
9%
Central Elementary
Voyager Passport
85%
53%
99%
0%
0%
0%
0%
0%
Phonetics Connections
89%
43%
96%
0%
0%
1%
0%
4%
WINS
84%
26%
98%
0%
0%
0%
0%
1%
Waterford
85%
14%
91%
2%
2%
1%
0%
3%
Waterford
89%
16%
79%
9%
3%
4%
0%
5%
Voyager Passport
78%
61%
36%
49%
4%
1%
0%
9%
Voyager
72%
65%
20%
71%
2%
1%
0%
6%
Breakthrough to Literacy
72%
65%
20%
58%
12%
1%
0%
8%
Waterford
N/A
26%
89%
1%
1%
2%
0%
6%
Eastwood Elementary
Waterford
65%
74%
93%
0%
2%
0%
1%
3%
Monmouth Elementary
Read Well
74%
30%
93%
1%
2%
0%
0%
4%
Northwest Elementary
Read Well
75%
43%
81%
1%
10%
1%
1%
6%
Southeast Elementary
Read Well
87%
43%
81%
0%
6%
0%
1%
13%
Voyager Passport
80%
31%
94%
0%
4%
1%
0%
2%
Pleasant Hill Elementary
Voyager Passport
81%
36%
92%
1%
1%
0%
1%
5%
Sugar Creek Elementary
Voyager Passport
86%
14%
96%
0%
1%
1%
0%
2%
Throop Elementary
Literacy Circles
81%
53%
97%
0%
1%
0%
0%
2%
Waterford
71%
66%
89%
4%
0%
0%
1%
5%
76%
42%
99%
0%
0%
0%
0%
0%
SuccessMaker
81%
30%
69%
17%
6%
2%
1%
6%
SuccessMaker
79%
25%
87%
2%
4%
1%
0%
6%
SuccessMaker
80%
67%
43%
38%
12%
3%
0%
5%
Waterford
80%
39%
96%
0%
2%
0%
0%
1%
Mill Creek East Elementary Mill Creek West Elementary Westview Elementary
Charles L. Smith Elementary Williamsport Elementary Lafayette Meadows Elementary Whispering Meadows Elementary Eastridge Elementary Heather Hills Elementary Greenbriar Elementary Pleasant View Elementary
Lester B. Sommer Elementary
Highland Heights Elementary
Saxon Early Learning
Rockville Elementary
and LiPS
Arthur C. Newby Elementary Carl G. Fisher Elementary James A. Allison Elementary Southeast Fountain Elementary
Center for Evaluation and Education Policy
73 of 80
Appendix A: Grant School Information
% FRLb
Read Naturally
76%
Scott Foresman ERI
Oaklawn Elementary Woodlawn Elementary
White
Black
Hispanic
Asian
Multi racial
Native American
37%
96%
0%
3%
0%
0%
1%
81%
32%
83%
0%
12%
0%
0%
4%
Build Up Phonics
87%
33%
80%
0%
13%
1%
1%
5%
Fluency First
70%
56%
77%
0%
17%
2%
1%
3%
Triumphs
52%
22%
75%
13%
2%
0%
0%
10%
Triumphs
82%
72%
79%
10%
2%
1%
0%
7%
Triumphs
65%
79%
73%
10%
1%
3%
0%
14%
Meadows Elementary
Triumphs
75%
36%
73%
17%
1%
0%
1%
9%
Wes Del Elementary
Waterford
72%
35%
96%
0%
1%
0%
1%
2%
Waterford
34%
80%
0%
97%
2%
0%
0%
0%
Ligonier Elementary
Reading Recovery
62%
62%
38%
0%
53%
0%
0%
9%
West Noble Elementary
Reading Reovery
54%
63%
57%
1%
39%
0%
0%
3%
Breakthrough to Literacy
70%
18%
99%
0%
0%
0%
0%
1%
Harney Elementary
Breakthrough to Literacy
73%
32%
97%
0%
2%
0%
0%
0%
Thorntown Elementary
Breakthrough to Literacy
73%
30%
95%
0%
2%
0%
0%
2%
Pierceton Elementary
A-OK
66%
34%
96%
0%
3%
0%
0%
0%
Read Naturally, LiPS
73%
25%
97%
0%
1%
0%
0%
1%
Eastlawn Elementary Meadowlawn Elementary
Benjamin Franklin Elementary Blanche E. Fuqua Elementary Farrington Grove Elementary
West Gary Lighthouse Charter School
Granville Wells Elementary
South Whitley Elementary
a. b. c. d. e. f.
Ethnicity Informationc d
ISTEP Scoresa
Early Literacy Program
School
Percent of third-graders passing the ISTEP English component during 2007-08 school year. Based on data from 2006-07 school year. Percent ethnicity enrollment for 2007-08 school year. Due to rounding, percents may not total 100 Ethnicity information based on the 2006-2007 school year Ethnicity information based on the 2006-2007 school year
74 of 80
Center for Evaluation and Education Policy
Appendix A: Grant School Information
TABLE 10.
Compliance Table Grant Coordinator Response
Teacher Response
Baseline Data
Erskine
Yes
Yes
Yes
Clifty Creek
Yes
Yes
Yes
Fodrea
Yes
Yes
Yes
Corporation Anderson Community Schools
School
Lincoln
Yes
Yes
Yes
Mt. Healthy
Yes
Yes
Yes
Bartholomew Consolidated
Parkside
Yes
Yes
Yes
School Corporation
W.D. Richards
Yes
Yes
Yes
Lillian Schmitt
Yes
Yes
Yes
L.F. Smith
Yes
Yes
Yes
Southside
Yes
Yes
Yes
Taylorsville
Yes
Yes
Yes Yes
Bloomfield School District
Bloomfield
Yes
No
Center Grove
Yes
No
Yes
Maple Grove
Yes
No
Yes
Center Grove Community
North Grove
Yes
No
Yes
Schools
Pleasant Grove
Yes
No
Yes
Sugar Grove
Yes
No
Yes
West Grove
Yes
No
Yes
Cloverdale
Yes
Yes
No
Concord Community Schools
West Side
Yes
Yes
Yes
DeKalb County Central Uni-
James R. Watson
Yes
Yes
Yes
fied School District
McKenney-Harrison
Yes
Yes
Yes
Cloverdale Community Schools
Albany
No
No
Yes
DeSoto
Yes
Yes
Yes
Eaton
Yes
Yes
Yes
Royerton
No
Yes
Yes
East Chicago Lighthouse
No
Yes
Yes
Eastern Greene Schools
Eastern Greene
No
No
Yesa
Garrett-Keyser-Butler Schools
J.E. Ober
Yes
Yes
No
Gary Lighthouse
Yes
Yes
Yes
Hamilton
No
No
Yes
Jane Ball
No
Yes
Yes
Indianapolis Lighthouse
Yes
Yes
Yes
District-wide
Yes
No
Yes
Delaware Community Schools
East Chicago Lighthouse Charter School
Gary Lighthouse Charter School Hamilton Community Schools Hanover Central School Corporation Indianapolis Lighthouse Charter School Indianapolis Public Schools
Center for Evaluation and Education Policy
75 of 80
Appendix A: Grant School Information
Grant Coordinator Response
Teacher Response
Baseline Data
East
Yes
Yes
Yes
General Shanks
Yes
Yes
No
Judge Haynes
Yes
No
Yes
Red Key
Yes
Yes
Yes
Westlawn
No
No
No
Bon Air
No
No
Yes
Boulevard
Yes
No
Yes
Darrough Chapel
Yes
Yes
Yes
Elwood Haynes
Yes
Yes
Yes
Corporation
Jay School Corporation
School
Kokomo Center Schools Maple Crest
Yes
No
Yes
Pettit Park
Yes
Yes
Yes
Sycamore
Yes
Yes
Yes
Washington
Yes
Yes
Yes
Parkside
Yes
No
Yes
Lawrenceburg
Yes
Yes
Yes
Linton-Stockton
No
Yes
Yes
Manchester
Yes
No
No
Marion Community Schools
Riverview
Yes
Yes
Yes
Michigan City Area Schools
District-wide
Yes
Yes
Yes
Mill Creek Community School
Mill Creek East
Yes
No
Yes
Corporation
Mill Creek West
Yes
Yes
Yes
Westview
Yes
Yes
Yes
Lakeland School Corporation Lawrenceburg Community School Corporation Linton-Stockton School Corporation Manchester Community Schools
Mississinewa Community Schools MSD Decatur Township
Early Childhood Center
Yes
Yes
No
MSD Lawrence Township
Harrison Hill
Yes
No
Yes
Central
Yes
Yes
Yes Yes
MSD Martinsville MSD Warren County
Charles L. Smith
No
Yes
Williamsport
Yes
No
No
Lafayette Meadows
Yes
Yes
Yes
Whispering Meadows
Yes
Yes
Yes
Eastridge
No
Yes
Yes
Heather Hills
Yes
Yes
Yes
Greenbriar
No
Yes
No
Pleasant View
Yes
Yes
Yes
Eastwood
Yes
Yes
Yes
Monmouth
Yes
Yes
Yes
MSD Southwest Allen County
MSD Warren Township MSD Washington Township Mt. Pleasant Township Community School Corporation New Castle Community School Corporation North Adams Community Schools
76 of 80
Northwest
Yes
Yes
Yes
Southeast
Yes
Yes
Yes
Center for Evaluation and Education Policy
Appendix A: Grant School Information
Grant Coordinator Response
Teacher Response
Baseline Data
Yes
No
Yes
Pleasant Hill
Yes
Yes
Yes
Sugar Creek
Yes
No
Yes
Throop
No
No
Yes
Highland Heights
No
No
Yes
Rockville
Yes
No
Yes
Arthur C. Newby
Yes
Yes
Yes
Corporation
School Lester B Sommer
North Montgomery Community School Corporation Paoli Community School Corporation Richmond Community Schools Rockville Community Schools
School Town of Speedway
Carl G. Fisher
Yes
Yes
Yes
James A. Allison
Yes
Yes
Yes
Southeast Fountain
Yes
Yes
Yes
Eastlawn
Yes
Yes
Yes
Twin Lakes School Corpora-
Meadowlawn
Yes
No
Yes
tion
Oaklawn
Yes
Yes
Yes
Woodlawn
Yes
No
Yes
Benjamin Franklin
Yes
Yes
Yes
Southeast Fountain Schools
Vigo County School Corpora-
Blanche E Fuqua
Yes
No
Yes
tion
Farrington Grove
Yes
No
Yes
Meadows
Yes
No
Yes
Wes Del Community Schools
Wes Del
Yes
Yes
Yes
West Gary Lighthouse
Yes
Yes
Yes
West Noble School Corpora-
Ligonier
Yes
Yes
Yes
tion
West Noble
Yes
Yes
Yes
Granville Wells
Yes
Yes
Yes
Harney
Yes
Yes
Yes
West Gary Lighthouse Charter School
Western Boone Community School Corporation (Lebanon)
Thorntown
Yes
Yes
Yes
Pierceton
Yes
Yes
Yes
South Whitley
No
Yes
Yes
Whitko Community Schools
a.
Data received after analysis was completed. Data are not included in this report.
Center for Evaluation and Education Policy
77 of 80
Appendix A: Grant School Information
78 of 80
Center for Evaluation and Education Policy
Appendix B: Sample Questionnaire
6 Appendix B: Sample Questionnaire
Center for Evaluation and Education Policy
79 of 80
Appendix B: Sample Questionnaire
80 of 80
Center for Evaluation and Education Policy
Fall 2007 Early Literacy Program Implementation Report Grant Coordinator Survey Instructions for Completing Report 1. To use checkboxes, double click on the boxes and select “checked.” 2. Indicate your response on Likert scale items by selecting the number that best indicates your position. I. Basic Information Please update incorrect information by noting corrections using boldface type. School: ______________________* ELIGP Grant Coordinator name & title: _________________________________ * Contact information: telephone- ____________* email- _________________* Literacy program/intervention and amount of funding: _____________________ * Please indicate any major changes to your literacy program/intervention since the grant application: Grade level(s): __ * Number of classrooms: __ * Total number of students: ___ participating in program/intervention* Number of Pre-K students: ___ participating in program/intervention* Number of K students: ___ participating in program/intervention* Number of Grade One students: ___ participating in program/intervention* Number of Grade Two students: ___ participating in program/intervention* Baseline and mid-year assessment instrument: ____* Database used for assessment: ________ (e.g. MClass, ROAR, etc) As the grant coordinator, what role do you serve in the program: Directly oversee program implementation Supervise someone on the school level that oversees implementation
I have reviewed the above information to ensure its accuracy* ________________________________________________________________________ Below, please respond to each question regarding your school’s funding, staffing arrangements, professional development activities, and implementation of Early Literacy Programs/Interventions. To use the checkboxes, double click on the boxes and select “checked.” II. Literacy Program/Intervention Has your school received ELIGP funds in the past? Yes No I don’t know
(If yes…) How many years of ELIGP funding has your school received (including this year)? less than 2 years 3-4 years 5 years or more I don’t know So far this year, ELIGP funds have been primarily used for (choose all that apply): Instructional materials Professional development Technology Personnel Parent involvement Other (please specify): ________________
These programs/interventions are a continuation/supplement to ELIGP efforts in the past 1 Not at all
2
3
4
5 Somewhat
6
7
8
9
10 Exactly
(If no…) So far this year, ELIGP funds have been primarily used for (choose all that apply): Instructional materials Professional development Technology Personnel Parent involvement Other (please specify): _______________ (if I don’t know…) So far this year, ELIGP funds have been primarily used for (choose all that apply): Instructional materials Professional development Technology Personnel Parent involvement Other (please specify): ________________ Do all students within a particular classroom receive instruction impacted by ELIGP funding, or do only targeted students receive this instruction? All students within a given classroom Targeted students in groups Targeted students one-on-one Mixed or all strategies
III. Staffing and Professional Development: Who serves as the coach(es)/leader(s) for ELIGP instruction in your school?
regular classroom teacher(s) literacy coach with classroom teaching responsibilities literacy coach without classroom teaching responsibilities other individual: __________ no specific individual serves as a coach/leader
How many teachers are implementing instructional strategies supported by ELIGP? Few (less than 1/4 of my school) Some (1/4-1/2 of my school)
Half
Many (1/2-3/4 of my school)
Almost all (more than ¾ of my school)
Pre-K teachers ____
____
____
____
____
K
____
____
____
____
____
Grade One
____
____
____
____
____
Grade Two
____
____
____
____
____
How have teachers at your school been trained on the use of ELIGP supported Early Literacy instruction so far this year? On-site initial certification training conducted by program developer Professional development provided by a teacher or coach Training on culturally competent literacy instruction One-on-one coaching or modeling Consultation with model developer/trainer via e-mail or phone Self-training via video, software, internet, books or CD’s Opportunities to network with teachers from other schools using the same program Other:__________________________________________ No training or professional development has been provided Teachers were trained in previous years
On a scale of 1 to 10, how well prepared are your school’s teachers to implement ELIGP interventions/programs this year? 1 Not at all prepared
2
3
4
5 Somewhat prepared
6
7
8
9
10
Extremely well prepared
IV. Implementation Status On a scale of 1 to 10, how fully has your school implemented the primary features of your ELIGP program/intervention this year? 1
2
3
4
None of the program features have been implemented
5
6
7
8
9
About ½ of the program features have been implemented
10 All program features have been fully implemented
On a scale of 1 to 10, how closely has your school followed the implementation timeline to this point of the school year as outlined in your grant application approved by the IDOE? 1
2
3
4
Not at all
5
6
7
Somewhat
8
9
10 Exactly
In which areas has your school encountered the greatest delays or challenges to implementation? Select each area that applies. Curricular Issues
Logistics/limitations of physical space
Student Assessment
Technology
Staffing/Training/Professional Development
Financial Issues Other _________________________
Briefly describe the nature of the challenges in each checked area and how you addressed or plan to address each challenge.
Fall 2007 Early Literacy Program Implementation Report Classroom Teacher Survey
Instructions for Completing Report 1. To use checkboxes, double click on the boxes and select “checked.” 2. Indicate your response on Likert scale items by indicating the number that best indicates your position. I. Literacy Program Do all students within a particular classroom receive instruction impacted by ELIGP funding, or do only targeted students receive this instruction? All students within a given classroom Targeted students in groups Targeted students one-on-one Mixed or all strategies
How many hours per week does the average student receive instruction through the ELIGP program/intervention? What are the main areas targeted within your classroom program/intervention? Check all that apply. Phonics Phonemic Awareness Reading Fluency Vocabulary Comprehension Other _____________________ What teaching methods are emphasized in your implementation of the program? Check all that apply. Computer assisted instruction Scripted lessons Storytelling Ability grouping Paired reading
Frequent assessment Small group instruction Echo reading One-on-one instruction Other ___________________
II. Professional Development For how many years have you personally provided literacy instruction using the Early Literacy program/intervention prior to this school year? None
1
2
3 or more
How have you been trained on the use of the ELIGP program/intervention so far this year? Please check all that apply. On-site initial certification training conducted by program developer Professional development provided by a teacher or coach Training on culturally competent literacy instruction One-on-one coaching or modeling Consultation with model developer/trainer via e-mail or phone Self-training via video, software, internet, books or CD’s Opportunities to network with teachers from other schools using the same program Other:__________________________________________ No training has been provided yet this year No professional development yet this year as I was already trained To what extent do you feel prepared to implement the ELIGP program/intervention this year? 1
2
3
4
Not at all prepared
5
6
7
8
9
Somewhat prepared
10 Extremely well prepared
III. Parent Involvement What role have parents actively played in efforts to improve student literacy so far this year? Parent back-to-school nights Newsletters Progress reports Parent training Books sent home Explanation of assessment to parents Literacy contracts Other: ___________________ What plans, if any, do you have for the rest of the school year for involving parents within the literacy intervention? Parent back-to-school nights Newsletters Progress reports Parent training Books sent home Explanation of assessment to parents Literacy contracts Other: ___________________ IV. Implementation Status Have you felt the need to modify the ELIGP program/intervention to meet the needs of your students? 1
2
3
Not at all
4
5
6
7
Somewhat
8
9
10 A lot
In what areas have you faced challenges to implementation so far this school year? Curriculum
Logistics/physical limitations
Student Assessment
Technology
Staffing/Training/Professional
Other: _____________________
Development Briefly describe the nature of ongoing challenges and how you plan to address each challenge.
Center for Evaluation and Education Policy