Inte rnational Journal of Ene rgy Scie nce Vol. 2 Iss. 6, De ce mbe r 2012
Evaluation of the Quality of Service Parameters for Routing Protocols in Ad-Hoc Networks Zeyad Ghaleb Al-Mekhlafi1, Rosilah Hassan2, Zurina Mohd Hanapi3 Universiti Putra Malaysia (UPM) 43400 UPM Serdang, Selangor, Malaysia
1.3
Universiti Kebangsaan Malaysia, 43600 UKM Bangi, Selangor, Malaysia
2
[email protected];
[email protected];
[email protected]
Abstract Recently, many researchers have focused on the Ad-Hoc networks especially the routing protocols which include reactive and proactive routing protocols. The ultimate goal of routing protocols is forwarding data packet from the source to the destination. Consequently, several proactive routing protocols, such as routing information protocol (RIP), and reactive routing protocols, such as Dynamic Source Routing (DSR), are based on exploring, maintenance, and recuperating the route path. The likely problem in the Ad-Hoc networks is how to establish the best routing protocol that assures the requirements of the application concerning about some criteria. This work presents the evaluation of RIP and DSR utilizing the QualNet simulation. Furthermore, the achievement of these routing protocols was assessed based on the throughput, average jitter, average end-to-end delay, and energy consumption metrics. This paper demonstrates that the RIP has superior evaluation performance as compared to DSR in two different scenarios (effect of the number of nodes and effect of packet size). Keywords Routing Protocols; Average Jitter; Average End-to-End Delay; Throughput; Energy Consumption
Introduction The new revolutions in wireless technology have led to the emergence of a new wireless system which is called Ad-Hoc Network. Ad-Hoc Network is a kind of wireless system which allows direct communication with each other. In Ad-Hoc network, each node plays a dual role; a router and a host in the sense at the same time. The process of sending and receiving data packages is controlled by getting some information regarding the surrounding network and dealing with algorithm. This combination between these functions is known as a routing protocol. A number of studies have recently gained attention in using the routing protocols, particularly, proactive routing
272
protocol and reactive routing protocol [1, 2]. Proactive routing protocols are those protocols which carry out the function of keeping track of routes for all the destinations in the Ad-Hoc networks. They are supported to be available in the form of tables. Furthermore, proactive routing protocol periodically exchange routing information in the whole network and maintains routes between different nodes dynamically. They have low latency and high overhead, and the routes are reliable. These protocols cannot scale well with the increase in network size. It is stated that one advantage of applying such kinds of protocols is that they facilitate communication to undergo minimal initial delay in the application procedure. However, their disadvantage is represented by the fact that they require additional control traffic to constantly update the entries of the stale route. On the other hand, reactive routing protocols attempt to identify a path to the destination only when a packet of data sent to the destination is received by the network protocol. This is one advantage of such kind of protocols as the degree of uncertainty in the node position is found to be high. They have also proved to be more suitable and more distinguished by their better performance in Ad-Hoc networks. However, taking more time to find a route and requiring more flooding which results into clogging the network are among the disadvantages of such protocols. Therefore, the arrangement of forwarding data packet from the source to destination is the ultimate aim by utilizing routing protocols. The differences between these protocols are due to the differences in the searching, maintenance and recovering the route path. The decision of choosing the best routing protocol should take into account some considerations such as mobility of nodes, packet size, cost of path, application type, number of nodes, type of traffic, and Quality of Services (QoS).
Inte rnational Journal of Ene rgy Scie nce Vol. 2 Iss. 6, De ce mbe r 2012
On the whole, QoS shore up in wireless is an extremely demanding issue because of their dynamic character [3, 4]. Diverse techniques, as of physical layer capable of application layer, have been wished-for to supply QoS shore up in wireless Ad-Hoc networking surroundings [5]. Recently, a cross-layer design move toward in QoS conditioning in wireless networks has gained more research interest [6, 7]. Consequently, this paper focuses on the most important factors, namely end-to-end delay, average jitter, throughput and energy consumption. The end-to-end delay is important for the Ad-Hoc networks due to the fact that some of the real-time applications are very sensitive to the delay which means that the data packet sent from the source node should be delivered to the final target node within a specific period of time without any delay. Therefore, the routing protocol will be selected based on the shortest path from the source node to the destination node. The average jitter assesses the variability over time of the packet latency across a network which associated with the delay. The network with constant delay has no jitter. Therefore, the routing protocol that satisfies the constant delay without any variation during the time will be more suitable to be selected for data routing. Moreover, the significance of throughput come from the needs to deliver the more messages to destination nodes during a specific period of time which means that the routing protocols should use some mechanisms to avoid the congestion in some paths which are more frequently used to prevent the packet drops during the data routing. Hence, the reactive routing will be getting a better chance as compared to the proactive routing, to be chosen as it can find alternative paths to be used rather than the congested one. Another mechanism to increase the throughput of routing protocols, in order to be chosen, is how to deal with the failures of the paths during the data delivery; meaning that if the current path used no more available either by the node failure or moving from the current position, the routing which deals with this issue will be more preferred by the user. Beside these, energy consumption is an important factor especially in mobile Ad-Hoc networks which has restricted energy. Therefore, the routing protocol should consider this factor by chosen the paths that consume small energy to extend the lifetime of the node and give the chance to the connectivity of the network to be longer. Moreover, the nodes of paths which routed the data packets will deplete their energy very fast and run-out their batteries. Therefore, the routing protocol must look for new paths to avoid using the same path repeatedly and consuming much energy. Again, the reactive
protocols will be more preferred because of their ondemand property. Related Works In [8], an Ad-Hoc routing protocol, namely Ad-Hoc On demand Distance Vector (AODV) has been evaluated. According to this model, the performance of AODV in homogeneous Ad-Hoc was better than heterogeneous one. A performance analysis of proactive and reactive routing protocols for Ad-Hoc networks Dynamic Destination-Sequenced Distance Vector (DSDV), AODV and Dynamic Source Routing (DSR) showed that the performance of AODV was better in dense environment except packet loss [9]. Moreover, it was found that both DSR and AODV performed well, and they proved to be better than DSDV. However, it is not clear which protocol is the best for all scenarios, even though there are rapid growth and development in the field of Ad-Hoc network. A comparison of the parameters of routing protocols between these previous studies is shown in table 1. TABLE 1 COMPARISON OF THE PARAMETERS OF ROUTING PROTOCOLS BETWEEN PREVIOUS STUDIES Parameter
(Tyagi& Chauhan, 2010)
(Ismail& Hassan,2010)
Numberof nodes
10-200
5,7
Simulationtime
1200sec(20Min)
3000s
Simulationarea
800Х1200 m
500Х500 m,1000Х1000 m, 1500Х1500 m,2000Х2000 m, 2500Х2500 m.
Routing protocols
DSDV,AODV,DSR
AODV
Transmission range
250 m
250 m
Packetsize
512 bytes
100,200,300,400,500,600,700,800,900 and1000 bytes
MAC protocol
802.11
802.11
Mobility type
Randomway point
Randomway point
Type oftraffic
CBR
CBR
Packetrate
54 Mps
54 Mps
Speed
(10-100) m/s
2 Mps
Program simulation
NS-2
OMNeT++
A comparative review study on reactive and proactive routing protocols in MANETs provided information about several routing schemes proposed for Ad-Hoc networks [10]. These schemes were classified according to the routing strategy (i.e., Proactive and Reactive). It is
273
Inte rnational Journal of Ene rgy Scie nce Vol. 2 Iss. 6, De ce mbe r 2012
shown that each protocol has definite advantages and disadvantages and is well studied for certain situations. Despite of the rapid growth in the field of Ad-Hoc networks, many challenges still exist and need more attention and consideration from researchers so that it is possible for such networks to be used more widely within the next few years. Recently, we have evaluated the routing information protocol and dynamic source routing [11]. According to this model, Routing Information Protocol (RIP) was found to be better as compared to Dynamic Source Routing (DSR).
network protocol requires knowing the next node in the path and the outgoing interface on which to send the packet [15]. A routing protocol computes routing information such as homogeneous and heterogeneous networks [8, 16]. Overall, routing protocols can be classified into two categories: proactive (table driven) routing protocols and reactive (on-demand) routing protocols. Popular proactive routing protocols are (DSDV) [17], Open Shortest Path First (OSPF) [18, 19], and RIP [20], whereas reactive routing protocols include DSR [21] and AODV [22].
Performance evaluation of AODV, DSDV, and DSR Routing Protocol in Grid Environment was described in a previous study [12]. According to this model, the AODV, DSR, and DSDV perform very well when the mobility is high. However, simulation results showed that the traditional routing protocols like DSR have a dramatic decrease in performance when the mobility is high. In [13], the performance of routing protocols in mobile Ad-Hoc network was compared for DSDV, AODV, and DSR and showed that DSR outperforms AODV. The DSR has less routing overhead when nodes have high mobility considering the throughput, end-to-end delay and packet delivery ratio metrics while DSDV produces low end-toend delay compared to AODV and DSR. In [14], the evaluation four Ad-Hoc network protocols (AODV, DSDV, DSR and TORA) in diverse network scales taking into contemplation the mobility factor. Based on this model, the throughput and energy consumption in tiny size networks did not disclose any momentous differences. On the other hand, for medium and huge AdHoc networks the TORA concert proved to be incompetent in this research. Above all, the concert of AODV, DSDV and DSR in tiny size networks was equivalent. Other than in medium and large size networks, the AODV and DSR formed good results and the concert of AODV in terms of throughput is good in all the scenarios that have been investigated.
Routing Information Protocol
Thus, our work in this present study is to use the more widely used traditional mobility models and traffic sources to create observations based on more standardized methodology that can be used to evaluate which protocol, proactive routing protocol (RIP) or reactive routing protocol (DSR), is more stabile for AdHoc networks based on some criteria in QualNet simulation. Ad-Hoc Routing Protocols The routing protocol resolves the path of a packet from the source to the destination. To forward a packet, the
274
RIP is a routing protocol which is dynamic as OSPF, but it is widely used in both local and wide area networks. It is classified as an Interior Gateway Protocol (IGP) which makes a use of the distance-vector routing algorithm as proposed in 1988 [23]. Since then, RIP Version 1 has been extended and updated to RIP Version 2 in 1998 [20]. It is indicated that both RIP versions are still being used today, but they have been technically supported by more advanced techniques such as OSPF and Open Systems Interconnection (OSI) protocol; Intermediate System to Intermediate System (IS-IS). Moreover, RIP has been updated to IPv6 network which is known as a standard RIP next generation (RIPng). One of the advantages of employing RIP is that it is simple to understand and easy to configure as it is capable of being supported by all routers, support load balancing, and in general, it is free from loop. However, among the disadvantages, RIP is not efficient, slow when it is used in large networks due to its configuration, supports equalcost load balancing, its congestion raises a problem and its scalability is limited since it is only measured as 15 hop maximum. Dynamic Source Routing Dynamic Source Routing (DSR) is defined by Johnson and Maltz [24] as a routing protocol which is still on demand and in which the sender of data can determine exactly the required sequence of nodes to propagate a packet. This packet header includes a number of intermediate nodes for routing. Each node works to maintain the route cache which cashes the source route being learned. It is stated that “Route Discovery” and “Route Maintenance” are the two main components of DSR which work together to determine and maintain routes to random destinations. The purpose of designing such protocol is to make restrictions to the large consumption of bandwidth caused by control packets in Ad-Hoc wireless networks. This process is done by deleting the messages of the
Inte rnational Journal of Ene rgy Scie nce Vol. 2 Iss. 6, De ce mbe r 2012
periodic updates required which usually appears in the table-driven approach [25]. The possibility of establishing a route when necessary makes the sender to be able to choose and control routes by reducing the load of data and including routing which is free from loop containing unidirectional links in networks is all the main advantages of DSR. However, DSR may lead to significant overheads because the source route has to be included with each packet. It uses cashing excessively and lacks mechanisms by which it can detect the freshness of the routes which causes delay and reduction; hence, the route mechanism for maintenance is unable to repair a broken link locally. Therefore, this makes the delay of the connection setup higher than that found in table-driven protocols [26].
b. Average Jitter Average Jitter is known as the time variation measured between the arrival of the packets due to the congestion of the network, the drift in timing, or changing of the route [2]. c. Throughput Throughput is the number of delivered packet per unit of time [28]. d. Energy Consumption It is defined as the amount of energy consumed in a process or system, or by an organization or society. It is the summation of the idle mode, transmit mode, and receive mode [29].
Metrics for Evaluation
Simulation Environments
Corson and Macker showed that the evaluation metrics are possible to be made a use of in evaluating the quantitatively Mobile Ad-Hoc Network (MANET) routing protocols [27]. Such quantitative measurement is useful as a prerequisite for assessing or evaluating the performance of network or even to compare the performance using different routing protocols.
In this paper, the QualNet simulation was implemented; 802.11 MAC [30]. The parameters in the simulation such as number of nodes, time of simulation, packet size, and type of traffic were summarized in Table 2.
Materials and Methods Simulation Tools The objective of this QualNet Version 5 simulation is to evaluate the proactive routing protocol and reactive routing protocol in Ad-Hoc networks in two scenarios. In a previous study [11], the effect of the number of nodes was evaluated. Beside this effect, the current study also covered the effects of packet size. It has five experiences with different number of nodes for scenario I (effects the number of nodes), and seven experiences with different packet size for scenario II (effects of packet size). The evaluation metrics used are throughput, end-to-end delay, average jitter, and energy consumption. a. Average End-To-End Delay This refers to the interval taking place between the data packet generation time and the time of the arrival of the last bit to the destination i.e. the average amount of time taken by a packet to move from source to destination. The process includes all possible delays which happen due to buffering during route discovery latency, queuing at the interface queue, retransmission delays at the Media Access Control (MAC) and propagation and transfer times [9].
TABLE 2 PARAMETERS SETUP Parameter
Scenario I
Scenario II
Numberof nodes
50,90,130,170,210
7
SimulationTime
1200sec(20Min)
3000s
Simulationarea
800Х1200m
500Х500m
Routing protocols
RIP andDSR
RIP andDSR
TransmissionPower
25dBm
25dBm
TransmitPower Consumption
100mW
100mW
Receive Power Consumption
130mW
130mW
Idle PowerConsumption
120mW
120mW
Transmissionrange
270m
270m
TransmissionPower
25.0
25.0
ItemSize
512bytes
100,200,300,400,500,600 and700 Bytes
PHY
802.11b
802.11b
Type oftraffic
CBR
CBR
Data Rate
11Mbps
11Mps
Speed
(10-100) m/s
(10-100) m/s
The number of nodes ranges from 50 to 210 nodes which divided into 50, 90, 130, 170, and 210 and the packet size range from 100 bytes to 700 bytes which divided into 100, 200, 300, 400, 500, 600, and 700 bytes. Five reasons
275
Inte rnational Journal of Ene rgy Scie nce Vol. 2 Iss. 6, De ce mbe r 2012
experiences with different number of nodes and seven reasons experiences with different packet size were implemented in this work. Evaluation of Results Results are obtained after the experiments have been conducted. The present paper aims to demonstrate the evaluation performance of each routing protocol with respect to the effects of the number of nodes and effects of packet size. The evaluation metrics considered for average jitter, end-to-end delay, throughput, and energy consumption. The tests highlight the evaluation performance of RIP and DSR in Ad-Hoc network. Scenario I Average End-To-End Delay Data set of the effects of the number of nodes by QualNet simulation of Average End-to-End Delay (scenario I) is shown in Table 3. TABLE 3 DATA SET OF AVERAGE END-TO-END DELAY Scenario I
Throughput
Average End-to-End Delay(s) No of Nodes
DSR
RIP
50
0.079186
0.058514
90
0.197886
0.069717
130
0.207281
0.052935
170
0.063845
0.03455
210
0.191009
0.04776
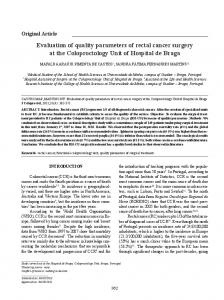
FIG. 1 AVERAGE END-TO-END DELAY BETWEEN RIP AND DSR IN SCENARIO I
276
Figure 1 shows the influence of the number of nodes on network average end-to-end delay for two routing protocols. The average end-to-end delay values increased according to the number of nodes for DSR. The maximum average end-to-end delay gained simulation with 130 numbers of nodes from DSR and the minimum average end-to-end delay gained from simulation 170 numbers of nodes from DSR. The increase average endto-end delay values the increase and the decrease according to the number of nodes for RIP. The maximum average end-to-end delay gained simulation with 90 numbers of nodes from RIP and the minimum average end-to-end delay gained from simulation 170 numbers of nodes from RIP. From the graph, it is clear that RIP out performs DSR for scenario I or II of varying pause time, varying simulation time, varying speed and varying number of nodes. In case of DSR, delay time increased sharply with increasing number of nodes. However, a sharp decrease was noticed when the number of nodes is 170. On the other hand, RIP increased and then decreased with increasing number of nodes. It is important to note that RIP gave a low end-to-end delay as compared to DSR.
Data set for the effects of the number of nodes by QualNet simulation of Throughput (scenario I) is demonstrated in Table 4. TABLE 4 DATA SET OF THROUGHPUT Scenario I Throughput (bits/s) No of Nodes
DSR
RIP
50
2312
2320
90
3
2301.75
130
6
1532.33
170
14
2285
210
6
2343.25
Figure 2 shows the influence of the number of nodes on network throughput for two routing protocols (RIP and DSR). The throughput values increased according to the number of nodes for RIP while in DSR it first increased when the number of nodes rose to 50 after which it starts to decrease sharply with increasing number of nodes. The maximum throughput was gained from simulation with 210 nodes for RIP and the minimum throughput was
Inte rnational Journal of Ene rgy Scie nce Vol. 2 Iss. 6, De ce mbe r 2012
gained from simulation with 130 nodes. The maximum throughput was gained from simulation with 50 nodes from DSR and the minimum throughput has gained from simulation with (90,130,170,210) numbers of nodes. RIP have higher throughput value compared to DSR.
FIG. 3 AVERAGE JITTER BETWEEN RIP AND DSR IN SCENARIO I
Energy Consumption
FIG. 2 THROUGHPUTS BETWEEN RIP AND DSR IN SCENARIO I
Average Jitter Data set for the effects of the number of nodes by QualNet simulation of Average Jitter (scenario I) is shown in Table 5.
In energy consumption, the result was calculated by collecting Idle mode + Transmit mode + Receive mode. The energy consumption was represented in two tables: Table 6 for the Idle mode, Transmit mode and Receive mode and Table 7 for the collected energy consumption (Idle mode + Transmit mode + Receive mode). TABLE 6 ATA SET FOR ENERGY CONS UMPTION FOR IDLE MODE, TRANSMIT MODE AND RECEIVE MODE DSR
TABLE 5 DATA SET OF AVERAGE JITTER Scenario I Average Jitter (s) No of Nodes
DSR
RIP
50
0.0365204
0.015466
90
0
0.036365
130
0.0248375
0.018677
170
0.0143463
0.000938
210
0.0224834
0.01431
The two kinds of routing protocols have different jitter with the increased number of nodes, as shown in Figure 3. Overall, RIP showed a better jitter than DSR when the number of nodes is greater than 50 while DSR showed the better jitter than RIP, when the number of nodes is 90 but when the number of nodes is above 90, the RIP gave a better jitter than DSR.
No of Nodes
50
90
130
170
210
Receive mode
0.066248
26.4599
33.6272
36.8386
29.895
Transmit mode
0.020879
0.008001
0.013737
0.007616
0.007551
Idle mode
39.9387
15.5754
8.95939
5.99503
12.4046
RIP No of Nodes
50
90
130
170
210
Receive mode
2.25513
2.35914
2.96544
3.51517
4.11252
Transmit mode
0.21928
0.398631
0.577919
0.718834
1.01791
Idle mode
37.9164
37.8188
37.2575
36.7488
36.1947
277
Inte rnational Journal of Ene rgy Scie nce Vol. 2 Iss. 6, De ce mbe r 2012
TABLE 7 DATA SET OF THE COLLECTED ENERGY CONS UMPTION
TABLE 8 DATA SET OF AVERAGE END-TO-END DELAY Scenario II
Scenario I
End-to-End Delay(s) Energy Consumption No of Nodes
DSR
RIP
50
40.02583
40.39081
90
42.0433
40.57657
130
42.60033
40.80086
170
42.84125
40.9828
210
42.30715
41.32513
Packet Size
DSR
RIP
100
6.5376
0.00089
200
6.54139
0.00085
300
6.43877
0.000777
400
6.73125
0.000939
500
6.06969
0.000761
600
6.41203
0.000566
700
6.81644
0.000714
Fig. 5 Average End to EndDelay between RIP andDSR in scenario II.
Throughput FIG. 4 ENERGY CONSUMPTION BETWEEN RIP AND DSR IN SCENARIO I
The energy consumption for the two routing protocols increased at the beginning of this work, as shown in Figure 4. DSR has a longer consumption than RIP. Therefore, RIP has the better energy consumption than DSR except when the number of nodes is 50 nodes.
Data set of the effects of packet size by QualNet simulation of Throughput (scenario II) is shown in Table 9. TABLE 9 DATA SET OF THROUGHPUT Scenario II Throughput (bits/s) Packet Size
DSR
RIP
Scenario Ii
100
6.5376
0.00089
Average End-to-End Delay
200
6.54139
0.00085
Data set of the effects of packet size by QualNet simulation of average End-to-End Delay (scenario II) is presented in Table 8.
300
6.43877
0.000777
400
6.73125
0.000939
500
6.06969
0.000761
600
6.41203
0.000566
700
6.81644
0.000714
Figure 5 shows that the average end-to-end delay for two routing protocols decreased; except when the packet size of DSR was higher than 100 bytes. Thus, DSR has longer delay than RIP and RIP exhibits shorter delay than DSR.
278
Inte rnational Journal of Ene rgy Scie nce Vol. 2 Iss. 6, De ce mbe r 2012
FIG. 6 THROUGHPUTS BETWEEN RIP AND DSR IN SCENARIO II
FIG. 7 AVERAGE JITTER BETWEEN RIP AND DSR IN SCENARIO II
Figure 6 shows the influence of the packet size on the network throughput for two routing protocols. Overall, the throughput value increased with the packet size for the two routing protocols. The maximum throughput gained from simulation with 700 bytes packet size, while the minimum throughput gained from simulation with 100 bytes packet size. On the other hand, DSR has the maximum throughput values according to increase packet size compared to RIP. Therefore, the DSR has better throughput than RIP.
The two kinds of routing protocols have different jitter with increased packet size (Fig 7). In general, RIP had better jitter than DSR while DSR showed longer delay than RIP. Thus, RIP showed the best evaluation performance.
Average Jitter Data set of the effects of packet size by QualNet simulation of Average Jitter (scenario II) is presented in Table 10. TABLE 10 DATA SET OF AVERAGE JITTER Scenario II Average Jitter (s)
Energy Consumption There are two tables to show the energy consumption: table 11 for the Idle mode, Transmit mode and Receive mode while table 12 was for the collected result (Idle mode + Transmit mode + Receive mode). TABLE 11 DATA SET FOR ENERGY CONS UMPTION OF IDLE MODE, TRANSMIT MODE AND RECEIVE MODE DSR Packet Size
100
200
300
400
500
600
700
Receive mode
0.01 317
0.01 5901
0.0175 71
0.016 744
0.0186 13
0.0188 96
0.019 2
Packet Size
DSR
RIP
Transmit mode
0.04 5568
0.05 6014
0.0631 08
0.060 627
0.0687 09
0.0692 31
0.071 318
100
0.956555
0.001107
Idle mode
149. 958
149. 948
149.94 2
149.9 44
149.93 7
149.93 7
149.9 35
200
1.03527
0.000909
300
0.997965
0.000897
400
1.04567
0.001143
500
1.03995
0.000736
600
1.04009
0.000409
700
1.05922
0.000677
RIP Packet Size
100
200
300
400
500
600
700
Receive mode
0.00 8079
0.00 7198
0.0126 69
0.008 29
0.0077 53
0.0100 93
0.009 364
Transmit mode
0.02 9998
0.02 7191
0.0467 71
0.031 318
0.0295 84
0.0360 45
0.036 08
Idle mode
149. 973
149. 975
149.95 7
149.9 72
149.97 3
149.96 7
149.9 67
279
Inte rnational Journal of Ene rgy Scie nce Vol. 2 Iss. 6, De ce mbe r 2012
TABLE 12 DATA SET OF THE COLLECTED ENERGY CONS UMPTION (IDLE MODE + TRANSMIT MODE + RECEIVE MODE) Scenario II
scenarios. REFERENCES [1]
S.-J. Lee, J. Hsu, R. Hayashida, M. Gerla, R. Bagrodia, Selecting a routing strategy for your ad hoc network.
Energy consumption
Computer Communications 26 (2003) 723-733.
Packet Size
DSR
RIP
100
150.0167
150.0111
and simulations of routing protocols in ad hoc networks.
200
150.0199
150.0094
Computer Communications 30 (2007) 1890-1898.
300
150.0227
150.0164
400
150.0214
150.0116
500
150.0243
150.0103
600
150.0251
150.0131
700
150.0255
150.0124
[2]
[3]
L. Layuan, L. Chunlin, Y. Pe iyan, Performance evaluation
D. Wu, QoS provisioning in wire less networks. Wireless communications and mobile computing 5 (2005) 957-969.
[4]
A. Duda, C.J. Sreenan, Challenges for quality of service in ne xt ge neration mobile networks. parameters 4 (2003) 3G.
[5]
P. Mohapatra, J. Li, C. Gui, Qos in mobile a hoc networks. Wire less Communications, IEEE 10 (2003) 44-52.
[6]
Q. Zhang, F. Yang, W. Zhu, Cross-layer QoS support for multimedia delivery over wire less internet. EURASIP Journal on Applie d Signal Processing 2005 (2005) 207-219.
[7]
S.B. Lee , G.S. Ahn, X. Zhang , A.T. Campbell , INSIGNIA : An IP-base d quality of service frame work for mobile ad hoc networks. Journal of
Parallel and Distribute d
Computing 60 (2000) 374-406. [8]
Z. Ismail, R. Hassan, Evaluation of ad hoc on demand distance vector routing protocol in He tMAN architecture. Journal of Computer Science 6 (2010) 830-836.
[9]
S. Tyagi, R. Chauhan, Performance Analysis of Proactive and Reactive Routing Protocols for Ad hoc Ne tworks. International Journal of Computer Applications IJCA 1
FIG. 8 ENERGY CONSUMPTION BETWEEN RIP AND DSR IN SCENARIO II
(2010) 31-34. [10]
revie w study of reactive and proactive routing protocols in
The two types of routing protocols have different energy consumption with increasing packet size as shown in Figure 8. DSR has longer energy consumption than RIP, while RIP has smaller energy consumption than DSR. As a result, the RIP showed the best evaluation performance in energy consumption.
[11]
Conclusion
[12]
In the present paper, an evaluation for routing protocols was carried out on acquired simulation results of two routing protocols, RIP and DSR using QualNet V5. RIP and DSR were selected to represent the Proactive routing protocols and Reactive routing protocols, respectively. We found that Routing Information Protocol preformed better than DSR for all evaluation metrics in 2 different
280
S. Mohseni, R. Hassan, A. Pate l, R. Razali, Comparative MANETs, in, IEEE, 2010, pp. 304-309. Z.G. Al-Me khlafi, R. Hassan, Evaluation Study on Routing Information Protocol and Dynamic Source Routing in AdHoc Ne twork, in, 7th Conference on IT in Asia 2011(CITA11). Kuching Sarawak Malaysia, 2011,pp.256-259. N.S.M. Usop, A. Abdullah, A.F.A. Abidin, Performance evaluation of AODV, DSDV & DSR routing protocol in grid e nvironment. IJCSNS 9 (2009) 261-268.
[13]
P. Manickam, T.G. Baskar, M. Girija, D.D. Manimegalai, Pe rformance Comparisons of Routing Protocols in Mobile Ad Hoc Networks. Arxiv preprint arXiv:1103.0658 (2011).
[14]
V. Kanakaris, D. Ndzi, D. Azzi, Ad-hoc networks energy
Inte rnational Journal of Ene rgy Scie nce Vol. 2 Iss. 6, De ce mbe r 2012
consumption: a revie w of the ad-hoc routing protocols.
[22]
(JESTR) 3 (2010) 162-167. [15]
[23]
Based
Approach
for
Reducing
Broadcast
[24]
Re dundancy with Fast Network Coverage in Wire less AdHoc Ne tworks, in, 5th International Conference on IT in [16]
[20]
[21]
[25]
G. Acs, L. Buttyan, I. Vajda, Provably secure on-demand
Q. Guo, X. Xu, J. Zhu, H. Zhang, A QoS-guaranteed cell
Transactions on Mobile Computing (2006) 1533-1546. [26]
M. Uma, Padmavathi, A
Comparative Study and
Journal 28 (2006) 77-83.
Pe rformance Evaualtion of Reactive Quality of Service
C.E. Perkins, P. Bhagwat, Highly dynamic destination-
Routing Protocols Mobile ADHOC Ne tworks. Journal of
sequenced distance-vector routing (DSDV) for mobile
The oretical and Applie d Information Technology 6 (2009) 2. [27]
S. Corson, J. Macker, Mobile Ad hoc Networking
Re vie w 24 (1994) 234-244.
(MANET): Routing Protocol Performance Issues and
R. Coltun, D. Ferguson, J. Moy, A. Lindem," OSPF for IPv6,
Evaluation Considerations[S], RFC2501, 1999.
in, RFC 5340, July, 2008. [19]
hoc wireless networks. Mobile computing (1996) 153-181. source routing in mobile ad hoc networks. IEEE
computers. ACM SIGCOMM Computer Communication [18]
D.B. Johnson, D.A. Maltz, Dynamic source routing in ad
Asia (CITA'07), 2007. selection strategy for heterogeneous cellular systems. ETRI [17]
C.L. He drick, RFC1058: Routing information protocol. RFC Editor Unite d States (1988).
M.J. Islam, M.A. Khaer, M.N. Islam, M.M. Islam, Simplified XOR
C. Perkins, E. Belding-Royer, S. Das, Ad hoc on-demand distance vector (AODV) routing. (2003).
Journal of Engineering Science and Technology Revie w
[28]
N. Mishra, N.N. AmitPandey, R. Sinha, D.S. Tapaswi,
J. Moy, RFC2328: OSPF Version 2. RFC Editor Unite d States
Selection of Ad Hoc Network Routing Protocols by
(1998).
Pe rformance Analysis, in, 2008, pp. 113-116.
G. Malkin, RFC2453: RIP Version 2. RFC Editor United
[29]
M.C. Domingo, Packet Size Optimization for Improving
States (1998).
the Energy Efficiency in Body Sensor Networks. ETRI
D.B. Johnson, D.A. Maltz, J. Broch, DSR: The dynamic
Journal 33 (2011).
source routing protocol for multi-hop wire less ad hoc ne tworks. Ad hoc networking 5 (2001) 139–172.
[30]
Y. Tay, K.C. Chua, A capacity analysis for the IEEE 802.11 MAC protocol. Wireless networks 7 (2001) 159-171.
281