capacities of the pumping stations with regard to the treatment plant capacity (Bakker,. Hartong, 1985). The main constraint in designing the control system was ...
Hydrological Processes and Water Management in Urban Areas (Proceedings of the Duisberg Symposium, April 1988). IAHS Publ. no. 198, 1990
EVALUATION OF THE REAL TIME CONTROL SYSTEM FOR THE WATER COLLECTION AND TREATMENT SYSTEM IN WESTFRIESLAND A.J.M. Nelen, F.H.M. van de Ven Delft University of Technology, Group Polder Development, Stevinweg 1, Delft, The Netherlands H.J.G. Hartong DHV Consulting Engineers, Amersfoort, The Netherlands R.W.G.M. Melis Water Authority Uitwaterende Sluizen, Edam, The Netherlands ABSTRACT In designing a regional treatment plant, the common procedure is to set its hydraulic capacity equal to the sum of the installed pump capacities of the contributing sewer systems. A reduction of the hydraulic capacity of the regional treatment plant at Wervershoof is possible, making optimal use of space-time variations of rainfall and the available storage in the combined sewer systems. A real time control system for the pumps of the contributing sewer systems has been in operation since 1983. This paper describes the situation in Westfriesland, The Netherlands, and discusses the first results from an evaluation of the control system still in progress. The recorded rainfall events and pump data are analyzed. Furthermore, a rainfall-runoff model has been developed which incorporates the sewer systems and the control system of Westfriesland. Some preliminary simulation results will be presented.
THE SEWER SYSTEM OF WESTFRIESLAND The regional treatment plant at Wervershoof provides treatment of waste water for several villages in the region of Westfriesland, a part of the province of North Holland, covering an area of 250 km . The plant serves a complex system of mostly combined sewer systems, it has a biological capacity equivalent to 130,000 inhabitants and a hydraulic capacity of 3600 m /h. Soon after the plant was put into operation in 1980, it appeared that in the near future the hydraulic capacity would become insufficient. The common procedure is to set the hydraulic capacity equal to the sum of the installed pump capacities oLthe contributing sewer systems. This would require a new treatment capacity of 5800 m /h. An alternative solution was found, making use of the space-time variability of precipitation and optimizing use of the available storage in the combined sewer systems. Based on a study of rainfall-distribution in the region, it could be concluded that a reduction of the ultimate hydraulic capacity would be allowable. An enlargement of the treatment plant could be postponed for several years. To realize this alternative a centralized, real time 149
A.J.M. Nelen, F.H.M. van de Ven, H.G.J. Hartong andR.W.G.M. Metis
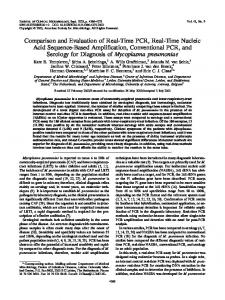
Figure 1.
Overview pumping stations and pressure mains.
control system was necessary, to determine the optimal combination of the discharge capacities of the pumping stations with regard to the treatment plant capacity (Bakker, Hartong, 1985). The main constraint in designing the control system was that a reduced plant capacity should not result in an increased frequency of combined sewer overflows or flooding of the treatment plant. The control system has been in uninterrupted operation since may 1983. The influence of the control system and the reduced plant capacity on the water collection and treatment system in Westfriesland is under investigation. Some preliminary results are discussed in this paper.
150
Evaluation of the real time control system
THE CONTROL SYSTEM The system is set up as a fully automatic and centralized control system. From a total of 125 pumping stations 27 have been selected to be part of the telemetry network (see Figure 2). The smaller pumping stations, those situated further upstream and those on separate sewer systems are left out of the control system and operate under their own pumping regime. The main control action is to "switch free" or "block" the pumps in the (main) pumping stations. The control system doesn't interfere in the regime of the pumps itself. The pumps are turned on and off by the local electronic installations, which are controlled by the water level. However, the pumping stations need "permission" from the control system before pumps can finally be activated. During dry weather situations the only control action is to determine the total discharge to the treatment plant. All the pumping stations are automatically set "free". In wet periods, when the total discharge of the pumping stations threatens to exceed the hydraulic capacity of the treatment plant the control system switches to its "main program". The water levels in the wet wells of the pumping stations are considered as indicators of the loading in the sewer systems and are therefore the main input variables for the control system. The water level at the pumping station is not an exact indicator of the loading in the system (because of backwater effects), but is assumed sufficient because the area is completely flat. The main principles of the control strategy are as follows: 1. Based on the measured water levels in the wet wells of the pumping stations a "relative water level" or "priority" is calculated incorporating a uniform water level and some adjustable weighting factors based on overflow conditions, vulnerability of the surface water (receiving combined sewer overflows) and size of the pumped drainage area. 2. The pumping stations are listed in order of descending "priority". 3. The optimal combination of discharge capacities (up to the treatment capacity) is determined based on: the "priority-list"; the foregoing situation; and taking into account some (adjustable) control conditions. 4. Before this situation can be effected, a number of (hardware) constraints are checked. This cycle is repeated every 5 minutes until all the pumping stations have been switched "free".
151
A.J.M. Nelen, F.H.M. van de Ven, H.G.J. Hartong andR.W.G.M. Melis
Figure 2.
Schematical overview of the (controlled) pumping stations.
MEASUREMENTS A lot of data are needed to control the sewage collection and treatment system. E.g. the loading of the system, information on the pumps, situation at the pumping stations and the treatment plant etc. At the same time, the collected information can be used to improve the management of the sewage transportation system. The measured data are also useful for evaluating the effects of the control actions on the operation of the sewer systems of Westfriesland. Although the data-set is limited and incomplete, valuable information can be derived on, among other things, actual discharges and high water situations. 152
Evaluation of the real time control system
The recorded data are clear with regard to the maximum discharge to the treatment plant at Wervershoof: the hydraulic capacity of the plant which is about 70% of the installed pump capacities of the contributing pumping stations, has not been exceeded, except for some peakdischarges of very short duration. These peaks result from the omission of a (major) pumping station at Lutjebroek, from the control system. Lutjebroek functions on its own pumping regime as it only transports the sewage of the upstream (controlled) pumping stations to the treatment plant. When these upstream pumping stations are "blocked" it takes some time before the level controlled pumps of Lutjebroek are switched off (see Figure 3). The most relevant data with regard to the combined sewer overflows are the recorded high water situations. A high water situation is defined when the water level at the pumping station equals or exceeds the 90% storage level. The overflow threshold is at the 100% level. A high water situation does not have to mean that an overflow occurs. The duration of the high water situation could be seen as an indication whether an overflow did occur or not. However, a frequency of overflows derived from the recorded high water situations remains a rough estimate. Considering a high water situation of 30 minutes or more as an actual overflow it appears that most pumped drainage areas meet the standard of a maximum of 7 overflows per year, despite the reduced plant capacity. In a few areas this standard is exceeded. However, it appeared that during rainstorms the pumps of these areas are (almost) never "blocked" by the control system (their high water levels give a high "priority"). Their exceedance is more an indication of the limited amount of available storage in these areas than malfunctioning of the control system. The same situation would most probably occur, without the control system. Every pumped drainage area has in fact its own particular rules and problems. The control system incorporates many weighting and control factors that can be used for improving the operation of the sewage transportation system. Optimization of these factors should be a continuous process. Evaluation-studies like this prove a powerful help in this. THE MODEL Information derived from measurements is not sufficient to quantify the effects of the control system and the reduced plant capacity on the (overflow) situation in Westfriesland. Therefore, a rainfall-runoff model has been developed (using spreadsheet software) which includes the water balances of the sewer systems and the real time control system as described above. The main basis for the control system is the optimal use of spatial variations in precipitation. The spatial variation of rainfall in the region of Westfriesland is unknown. Different patterns of rainfall events are being examined to determine the maximum hydraulic reduction that can be gained for the treatment plant. Before rainfall enters the sewer system, the rainfall curve is smoothed and delayed by the runoff process. This process is described by a loss-model and a reservoir-model. The waterbalance of each 153
A.J.M. Nelen, F.H.M. van de Yen, H.G.J. Hartong and R.W.G.M. Melis
sewer system is calculated over intervals of 10 minutes. Some basic data are known for each sewer system: impervious area, total storage, pumping regime, dry weather flow. Other parameters like initial losses and reservoir coefficients had to be estimated from the literature. Some of the data taken from the basic sewer plans turned out to be wrong. This could be concluded from comparison of the model results with the recorded high water situations. Calibration of the model is impossible because the measured data are inadequate, but they are sufficient to make some verifications of the model-parameters used. The model has been developed to indicate the impacts of the control system and the reduced plant capacity on the occurrence, amount and location of overflows. The model offers the possibility to compare the situations in the sewer systems during rainfall events with and without the control system. An example is shown in Figure 3, for a design rainstorm of 12 mm in 4 hours. In the "controlled situation" the discharge never exceeds the treatment capacity, except for some peaks of very short duration. The calculated water levels at the four main pumping stations (Figure 1) are also given: the available storage is used more effectively in the "controlled situation".
Figure 3. 154
Results of simulation of a "design-storm" (12 mm in 4 hours).
Evaluation of the real time control system
CONCLUSIONS It can be concluded that a reduction of the hydraulic capacity of the treatment plant at Wervershoof is feasible. The control system incorporates sufficient instruments to maximize the use of spatial variations in rainfall and the available storage in the sewer system. The allowable reduction, which doesn't lead to an increase of the number of overflows is being determined by analysis of recorded data and simulation with a computer-model. This study emphasizes (again) the necessity of proper data collection and regular evaluation to get optimal operation and management of the sewerage system.
REFERENCES Nelen, A.J.M. 1987. Evaluatie besturingssysteen Wervershoof (interim-report), Delft University of Technology. Bakker, K., H. Hartong, e.a. Computergesteunde besturing van rioolgemalen in Westfriesland-Oost, H20, 1984, nr.10 p 204-208 and 1985, nr.18 p 114-118.
155
156