International Food Research Journal 18(4): 1321-1328 (2011)
Evaluation of thin-layer drying models and neural network for describing drying kinetics of Lasagnas angustifolia L. Abbaszadeh, A., 2*Motevali, A., 1Khoshtaghaza, M.H. and 2Kazemi, M.
2
Department of Agriculture Machinery Engineering, Faculty of Agriculture, Tarbiat Modares University 2 Department of Engineering, Islamic Azad University Shahre Qods Branch, Qods City, Tehran, Iran 1
Abstract: The thin-layer drying behavior of Elaeagnus angustifolia in a laboratory scale hot-air dryer was examined. Drying characteristics of Elaeagnus angustifolias were determined using heated ambient air at temperatures of 50, 60 and 70°C and air velocities of 0.5, 1 and 1.5 m/s. To select a suitable drying curve, 6 thin-layer drying models were fitted to the experimental data. All the models were compared according to three statistical parameter; R2, standard error of estimate (SSE) and root mean square error (RMSE). Using some of the experimental data, an ANN, trained by standard Back-Propagation algorithm, was developed to predict MR and DR values based on the three input variables (time, velocity and temperature). Different activation functions and several rules were used to assess percentage error between the desired and the predicted values. According to the results, a two-term drying model has better agreement with experiment. The effect of the drying air temperature and air velocity on the drying model constants and coefficients were also determined. Consequently, the estimating power of the new model was evaluated. The ANN model was able to predict the moisture ratio and drying rate quite well with coefficient of determination (R2) of 0.9993, 0.9992 and 0.9996 for training, validation and testing, respectively. The prediction Mean Square Error was obtained as 0.00355, 0.00930 and 0.0016 for training, validation and testing, respectively. Keywords: Elaeagnus angustifolia, thin-layer drying model, drying kinetics, neural network
Introduction Elaeagnus angustifolia fruit is one of the horticultural products produced in the north east and west of Iran in an area of more than 2708.6 ha with an annual fresh production of 5443.45 tons and it is mostly supplied to the market in the dried form. The leaves and flowers of this plant are well-known for their use as diuretic and antipyretic in folk medicine. The analysis showed the occurrence of fructose and glucose in concentrations (w/w) of 32.62-34% and 23.37-34.60% (min-max), respectively (Ayaz et al., 1999). Drying of agricultural products has always been of great importance for the preservation of food by human beings. Ancient methods used the rays of the sun for the drying of agricultural products. The main advantages of sun drying are low capital and operating costs. However, this process has several disadvantages, such as undesirable changes in the quality of food products, a lack of control during the drying process, long drying times and contamination of the product, all of which necessitate the introduction of new technologies to the drying process (Raouzeos and Saravacos, 1986; Ertekin and Yaldiz, 2004). The objective of drying fruits is to reduce the moisture content to a level that allows safe storage over an extended period of time (Doymaz, 2004). Thin layer *Corresponding author. Email:
[email protected]
equations describe the drying phenomena in a unified way, regardless of the controlling mechanism. They have been used to estimate drying times of several products and to generalise drying curves (Midilli et al., 2002). Thin-layer drying refers to the grain drying process in which all grains are fully exposed to the drying air under constant drying conditions, i.e., at constant air temperature and humidity. All commercial flow dryers are designed on thin-layer drying principles. Thus, thin-layer drying simulation is the best criterion to model the food drying process (Chakraverty and Singh, 1988). Although a considerable amount of data has been reported in the literature regarding the thin-layer drying modeling of various agricultural products (fruits, crops and vegetables) like Cobia (Amiza and Aishah, 2011), Centella asiatica (Mohd Zainol et al., 2009), Gooseberry powder (Thankitsunthorn et al., 2009), kiwifruits (Diamante et al., 2009), chilli (Wiriya et al., 2009), millet (Ojediran and Raji, 2010), banana (Prachayawarakorn et al., 2007), figs (Stamatios et al., 2006), pistachio nuts (Kashaninejad et al., 2008), pomegranate arils (Kingsly and Singh, 2007), tropical fruits (Ceylan et al., 2007), apple (Sacilik and Konuralp, 2006), sesame hulls (Al-Mahasneh et al., 2007) but little information is available on medicinal fruits such as the Elaeagnus angustifolia fruit.
© All Rights Reserved
1322 Abbaszadeh, A., Motevali, A., Khoshtaghaza, M.H. and Kazemi, M.
Prediction of heat and mass transfer in the drying process of mango and cassava was achieved using neural networks (Hernandez-Perez et al., 2004). Erenturka et al. (2004) reported on the comparison of neural networks and the regression analysis for the estimation of drying behavior of Echinacea anguishfolia. Neural networks as an approximation approach has been also used for the prediction of microwave-assisted drying process (Pedren et al., 2005), prediction of drying kinetics with neural networks (Tomczak and Kaminski, 2001), solar drying performance (Tripathy and Kumar, 2009) and tomato drying (Movagharnejad and Nikzad, 2007) pomegranate arils (Motevali et al., 2010). The objective of this study was to investigate the adaptability of a thin-layer drying model to Elaeagnus angustifolia, by choosing the best among six thinlayer drying equations and compare neural networks with the mathematical models for the prediction of thin-layer drying of Elaeagnus angustifolia. Material and Methods The experimental facility A laboratory scale hot-air dryer developed at the Biophysical Properties Laboratory of Agriculture faculty, Tarbiat modares University (Iran), was used for this study. The essential parts of dryer system consists of an adjustable centrifugal blower, air heating chamber (1.5 kW), drying chamber, system controller, an inverter (Parto Sanat, Igbt and Co, Iran) and a tray sample. The dryer had an automatic temperature controller with an accuracy of ±0.1°C deviation. Air velocity was kept at previously mentioned values (0.5, 1 and 1.5 m/s) with an accuracy of ±0.1m/s using an Ljt lutrun AM-4204 (Taiwan) Vane probe anemometer. Air velocity was fixed by using an inverter that directly acted on the blower motor (1.5 kW). The hot air orientation on samples was vertical. The dried samples were manually weighted using an electronic balance having accuracy ±0.01 g, resolution 0.01 g and maximum capacity, 0.61 kg (AND GF-600, Japan). Samples used in the experiment were about 100 g in weight. During the drying process, experiments continued until the moisture content of the sample reached about 0.3 (kg water/kg dry matter). A temperature controller fixed the temperature of the air chamber at ±0.1°C model Poyesh digital instument, type TMC 101, (Iran). Before the start of any experiments, the dryer system was started in order to achieve desirable steady-state condition. Experiments were replicated three times.
Material preparation and drying conditions Freshly harvested Elaeagnus angustifolia fruits were purchased from the local farms at Mayvan regin of North Khorasan municipality (Iran) and stored in the refrigerator at about +5°C for experiments. Generally, samples of uniform size were selected. Immature and spoiled Elaeagnus angustifolias were separated manually. The initial moisture content of the Elaeagnus angustifolia was determined by the oven drying method. About 50 g sample was placed in a pre-weighed box and was weighed again accurately to give the exact weight of sample. It was kept in hot air oven maintained at 105±1°C until the variations between two weighing intervals mass were within 0.04 g. At least five replicates of experiment were measured. The fresh Elaeagnus angustifolias used in this investigation had 24% (w.b) initial moisture content. The temperature level in the dryer was set constant at mean free-stream temperatures of 50, 60 and 70°C and regulated to ±1°C by means of the temperature controller. For each temperature, a drying test was performed with the air velocity at the measurement point set constant at 0.5, 1 and 1.5 m/s. Mathematical modeling of the drying curves Drying curves were fitted with six different moisture ratio models: the Newton, the Page, Henderson and Pabis, Logarithmic, Tow term and Approximation of diffusion model (Table 1). These models are generally derived by simplifying the general series solutions of Fick’s second law and considering a direct relationship between the average water content and drying time (Doymaz, 2004). The moisture ratio of the Elaeagnus angustifolias fruits during the drying experiments was found using Eq. (1):
M R MR=
=
Mt − Me Mo − Me
(1)
where MR is the moisture ratio (dimensionless), Mt is the moisture content at any time (kg water/kg dry solid), Me is the equilibrium moisture content (kg water/kg dry solid) and M0 is the initial moisture content (kg water/kg dry solid). Three criteria were used to determine best fit are correlation coefficient (R2), root mean square error (RMSE) and standard error of estimate (SSE). R2, RMSE and SSE were calculated using the following equations: R
2
N 2 ∑ ( MR pred ,i − MR exp,i ) i =1 = 1− N 2 ∑ ( MR pred − MR pred ,i ) i =1
International Food Research Journal 18(4): 1321-1328
(2)
1323
Evaluation of thin-layer drying models and neural network for describing drying kinetics of Lasagnas angustifolia L
Table 1. Thin-layer drying models tested for moisture ratio values of Elaeagnus angustifolia Model
Equation
Tow term
M R = exp(−ktt ) MR M RMR = exp(−ktt n ) M RMR = a exp(−ktt ) M RMR = a exp(−kt t) + c M RMR = a exp(−kt ) + b exp(−k1t )
Approximation of diffusion
M RMR = a exp(−kt t) + (1 − a ) exp(−kbt )
Page Henderson and Pabis Logarithmic
1 N RMSE = ⋅ ∑ (MR pred ,i − MR exp,i )2 N i =1 N 2 ∑ ( MR pred ,i − MR exp,i ) i =1 SSE = N −n
1
1
2
(3) 2
(4)
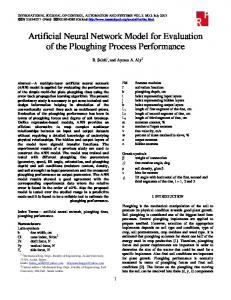
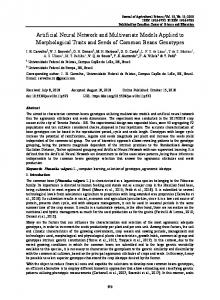
where MRexp,i is the ith experimental moisture ratio, MRpred,i is the ith predicted moisture ratio, N is the number observations and n the number of drying constants. The best fit that could describe the thin-layer drying characteristics of Elaeagnus angustifolias fruit was selected as the highest value of correlation coefficient (R2), and the lowest value of RMSE and SSE. To account for the effect of the drying variables on the Tow term model constants, the constants were regressed against drying air temperature and velocity, using multiple regression analysis. All possible combinations of the different drying variables were tested and included in the regression analysis. Neural network design To obtain the best prediction by the network, several architectures were evaluated and trained using the experimental data. The back-propagation algorithm was utilized in training of all ANN models. This algorithm uses the supervised training technique where the network weights and biases are initialized randomly at the beginning of the training phase. The error minimization process is achieved using a gradient descent rule. There were three inputs and two output parameters in the experimental tests. The three input variables are time (in minute) temperature (°C) and velocity (m/s). The two outputs for evaluating dryer performance are MR and DR. Therefore the input layer consisted of 3 neurons and the output layer had 2 neurons (Figure 1). Figure 5 shows the configuration of multilayer neural network for predicting MR (Moisture Ratio) and DR (Drying Rate). Tangent (Tan) function suited best for the output layer. This arrangement of functions
Page (1949) Henderson and Pabis (1969) Yagcıoglu et al. (1999) Henderson (1974) Yaldiz et al. (2001); Bakri and Hobani (2000)
in function approximation problems or modeling is common and yields better results. However, many other networks with several functions and topologies were examined. Three criteria were employed to evaluate the networks and select the optimum one. The training and testing performance (MSE) was chosen to be .00001 for all ANNs. The complexity and size of the network was also important, so the smaller ANNs had the priority to be selected. Finally, a regression analysis between the network response and the corresponding targets was performed to investigate the network response in more detail. Different training algorithms were also tested and finally Levenberg-Marquardt (trainlm) was selected. The computer program MATLAB R2008a, neural network toolbox was used for ANN design.
Figure 1. Configuration of multilayer neural network for predicting MR (Moisture Ratio) and DR (Drying Rate) 2750 2500
0.5 m/s
2250
Time (min)
Newton
Reference O’Callaghan et al. (1971)
1 m/s
2000
1.5 m/s
1750 1500 1250 1000 750 500 45
50
55
60
65
70
75
Temperature (°C)
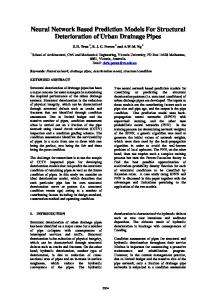
Figure 2. Drying air temperature vs. final drying time at different air velocities for thin-layer drying of Elaeagnus angustifolia
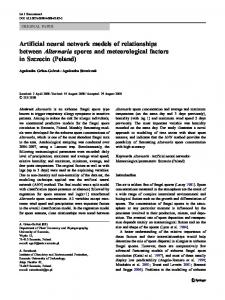
Results and Discussion Drying curves Figure 2 shows final drying time versus temperature at constant air velocity. It is evident that at high temperature levels, the difference between total drying times is lowest compared to low
International Food Research Journal 18(4): 1321-1328
1324 Abbaszadeh, A., Motevali, A., Khoshtaghaza, M.H. and Kazemi, M.
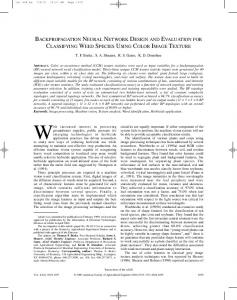
temperatures. Total drying time at 1.5 m/s is about 1.6 to 2 times longer compared with experiments performed at 0.5 m/s at constant air temperature, whereas increasing air velocity to 70°C resulted in 2.3–2.6 times larger drying time. In the other words, the effect of air temperature compared with air velocity is significant in total thin-layer drying time of Elaeagnus angustifolia. Figures 3 to 5 present the experimental data (moisture ratio vs. time) obtained for air at temperatures ranging from 50, 60 and 70°C, and flowing at a constant velocity of 0.5, 1 and 1.5 m/s. In all three figures, the best fitting curve is also included (as will be discussed later). The effect of increasing air temperature on the drying rate, while air velocity was kept constant, is evident. Moreover, it is proven that drying of Elaeagnus angustifolia fruit occurred in the falling rate phase. Moisture Ratio (MR)
1.2 1
50°c 60°c
0.8
70°c P redict ed
0.6 0.4 0.2 0 0
300
600
900
1200
1500
1800
Time (min)
Figure 3. Drying curves (symbols) and approximation (lines) using the two-term model for different air temperature values when air velocity 0.5 m/s
Moisture Ratio (MR)
1.2 50°c
1
60°c
models listed in Table 1, using the experimental data, with the best-fitting model in bold type. The best model describing the thin-layer drying kinetics was selected with the highest R2 average values, and the lowest RMSE and SSE average values. By comparing R2, RMSE and SSE average values, it is clear that the Tow term model satisfactorily fits experimental data on drying kinetics observed in the falling rate period and has better agreement with the experiments. The Tow term model constants are reported in Table 5. In all of the experiments, R2, RMSE and SSE values for the Tow term model were 0.9981–0.9999, 0.0021– 0.0089 and 0.0003–0.0026, respectively. The fitting procedure indicated that the results of the Tow term model could be used to model the drying behaviour of Elaeagnus angustifolia in singlelayer, but it did not indicate the effects of temperature and velocity of drying air. To account for the effect of the drying variables on the Tow term model constant, k0 and k1 (h-1) and the coefficients a and b (dimensionless), the values of k0, k1, a and b were regressed against those of the drying air, temperature T (°C) and velocity V (m/s) using multiply regression analysis, and the equation and related R2 values are reported. Regression analyses for these parameters yielded the following relationships at the statistically significant level of 1%:
a = −0.062V + 0.007T
R2= 0.96
(5)
b = 0.0107V + 0.007T
R2= 0.87
(6)
k 0 = 0.001V + 6.5 ×10⁻⁵T
R2= 0.83
(7)
k 1 = −0.004V + 0.0001T
R2= 0.73
(8)
70°c
0.8
Predicted
0.6 0.4 0.2 0 0
300
600
900
1200
1500
1800
2100
Ti me (mi n)
Figure 4. Drying curves (symbols) and approximation (lines) using the two-term model for different air temperature values when air velocity 1 m/s
Consequently, the following equation was obtained for thin-layer drying of Elaeagnus angustifolia fruit:
Moisture Ratio (MR)
1.2 1
50°c 60°c
0.8
70°c Predicted
0.6
(
)
MR (V ,T , t ) = (−0.062V + 0.007T )× exp − (0.001V + 6.5 ×10⁻⁵T )t +
0.4 0.2 0 0
300
600
900
1200
1500
1800
2100
2400
2700
(0.0107V + 0.007T )× exp (− (−0.004V + 0.0001T )t )
(9)
Time (min)
Figure 5. Drying curves (symbols) and approximation (lines) using the two-term model for different air temperature values when air velocity1.5 m/s
Analysis of data The moisture ratio, MR of each experimental series was calculated. Non-linear regression analysis using MATLAB computer program was made for fitting the measured data (Moisture ratio and time) into six thinlayer drying models, displayed in Table 1. Tables 2–4 show the fitting results (R2, RMSE and SSE) for the
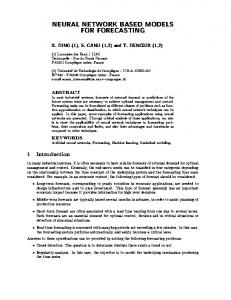
Validation of the determined model was established by comparing the experimental data, for each drying curve, with the values predicted by the Two-term model and the results are plotted in Figure 6. The data points are banded around a 45° straight line, demonstrating the suitability of the model in describing the thin-layer drying behavior of the Elaeagnus angustifolia fruit. R2 = 0.9982 (10) MR pre = 0.997MR exp + 0.0019
International Food Research Journal 18(4): 1321-1328
Evaluation of thin-layer drying models and neural network for describing drying kinetics of Lasagnas angustifolia L
1325
Table 2. Coefficient of determination for v =0.5 m/s, Varying T Model Newton Page Henderson and Pabis Logarithmic Tow term Approximation of diffusion
R2 0.8893 0.9982 0.9631 0.9916 0.9981
50°C RMSE 0.0657 0.0085 0.0385 0.0186 0.0089
SSE 0.1553 0.0025 0.0517 0.0128 0.0026
0.9979
0.0095
0.0032
R2 0.9192 0.9949 0.9607 0.9987 0.9999
Temperature 60°C RMSE 0.0564 0.0144 0.0399 0.0074 0.0025
SSE 0.1048 0.0066 0.0509 0.0017 0.0002
R2 0.9315 0.9904 0.9590 0.9990 0.9997
70°C RMSE 0.0544 0.0208 0.0429 0.0067 0.0036
SSE 0.0798 0.0112 0.0478 0.0011 0.0003
0.9998
0.0029
0.0003
0.9997
0.0036
0.0003
70°C RMSE 0.0945 0.0277 0.0682 0.0144 0.0053
SSE 0.2411 0.0199 0.1209 0.0052 0.0007
0.0091
0.0033
Table 3. Coefficient of determination for v = 1 m/s, Varying T Model Newton Page Henderson and Pabis Logarithmic Tow term Approximation of diffusion
R2 0.9827 0.9994 0.9928 0.9986 0.9996 0.9996
50°C RMSE 0.0290 0.0055 0.0189 0.0084 0.0048 0.0047
Temperature 60°C R2 RMSE 0.9282 0.0548 0.9952 0.0143 0.9671 0.0376 0.9987 0.0076 0.9998 0.0027
SSE 0.0345 0.0012 0.0143 0.0028 0.0009 0.0009
0.9998
0.0033
SSE 0.1110 0.0074 0.0509 0.0020 0.0003 0.0004
R2 0.8134 0.9846 0.9064 0.9960 0.9995 0.9986
Table 4. Coefficient of determination for v = 1.5 m/s, Varying T Model Newton Page Henderson and Pabis Logarithmic Tow term Approximation of diffusion
0.9999
0.0021
SSE 0.3874 0.1380 0.1516 0.0205 0.0003 0.0004
R2 0.9185 0.9967 0.9667 0.9921 0.9988
Temperature 60°C RMSE 0.0595 0.0121 0.0385 0.0189 0.0075
SSE 0.1488 0.0060 0.0608 0.0143 0.0022
R2 0.8587 0.9829 0.9540 0.9935 0.9994
70°C RMSE 0.1009 0.0272 0.0709 0.0170 0.0051
SSE 0.4075 0.0289 0.1958 0.0109 0.0009
0.9986
0.0091
0.0033
0.9992
0.0058
0.0013
Table 5. Regression analysis coefficients related to the Tow-term model for each experiment 50°C
60°C
70°C
0.2422 0.006663 0.7415 0.000576
0.4181 0.004877 0.5768 0.000582
0.4477 0.007653 0.5543 0.000795
0.1512 0.004212 0.8494 0.000611
0.4129 0.003788 0.5843 0.000483
0.5177 0.009777 0.4743 0.000733
0.3421 0.003543 0.6556 0.000308
0.2618 0.004512 0.7343 0.000409
0.4782 0.007239 0.5110 0.000497
The residuals plot, seen in Fig.7, was also used to evaluate the selected model. Chen and Morey (1989) and Xanthopoulos et al. (2007) stated that data points in a plot of the residuals versus predicted values should tend to fall in a horizontal band centered on zero line, displaying no systematic tendencies toward a clear pattern. Therefore, plotting the residuals against the predicted values of dimensionless moisture ratio, Fig. 6, there were no systematic patterns. The proximity of residuals around zero line shows the sufficiency of the derived model.
1.2
Predicted Moisture Ratio
Temperature v = 0.5 m/s a K b0 K v 1= 1 m/s a K b0 K v 1= 1.5 m/s a K b0 K1
R2 0.8618 0.9951 0.9459 0.9927 0.9999
50°C RMSE 0.0784 0.0149 0.0494 0.0183 0.0021
1
0.8
0.6
0.4
MR pre = 0.997MR exp + 0.0019 R2 = 0.9982
0.2
0 0
0.2
0.4
0.6
0.8
1
1.2
Experimental Moisture Ratio
Figure 6. Comparison of experimental moisture ratio with predicted moisture ratio from the Two-term exponential mode for Elaeagnus angustifolia fruit
International Food Research Journal 18(4): 1321-1328
1326 Abbaszadeh, A., Motevali, A., Khoshtaghaza, M.H. and Kazemi, M.
coefficient of determination (R2) of 0.9993, 0.9992 and 0.9996 for training, validation and testing, respectively (Table 6). Prediction Mean Square Error (MSE) values of 0.00355, 0.00930 and 0.0016 were obtained for training, validation and testing, respectively (Table 7).
0.02 0.015
Residual
0.01 0.005 0 -0.005 -0.01 -0.015 -0.02 0
0.1
0.2
0.3
0.4
0.5
0.6
0.7
0.8
0.9
1
1.1
Predicted values of Moisture Ratio (MR)
Figure 7. Residuals versus predicted values of moisture ratio derived by multiple
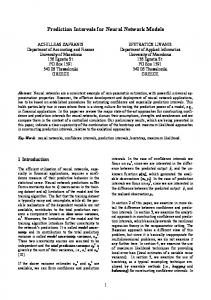
Results of artificial neural network modelling An artificial neural network (ANN) was developed based on the experimental work. Results showed that Back Propagation training algorithm was well suited for prediction of Moisture Ratio and Drying Rate based on different time, velocity and temperature levels. Performance diagram of the ANN model is shown in Figure 8. Predicted versus experimental values for the studied parameters are indicated in Figure 9. This figs show the results of analysis for drying rate and moisture ratio respectively. As can be seen, all the investigated prediction models simulate the experiments satisfactorily for both moisture ratio and drying rate. The developed network had a good generalization in predicting the quality of the mushroom slice from the drying process. Thus, this network model could be used to determine the moisture ratio and drying rate of the agriculture product under the dynamic drying system. ANN predictions for the (B) MR and, (A) DR yield
Conclusions The conducted regression analysis based on nonlinear regression methods, tested six thin-layer drying models’ capability to efficiently simulate convective drying of Elaeagnus angustifolia for the experimental data obtained when Elaeagnus angustifolias were dried in the range of mean air temperatures of 5070°C and air velocity values from 0.5 m/s to 1.5 m/s in a laboratory scale hot-air dryer. It is found that the drying curves of fresh Elaeagnus angustifolia fruit demonstrated the falling rate period. Compared with the effect of air velocity, the effect of temperature was significant on the drying time for fresh Elaeagnus angustifolia fruits; on the other hand, by increasing air velocity at constant air temperature, the drying time increased. Regression coefficients for all models were calculated and assessed in terms of fitting performance. The final selected model, 3-30-20-2 (3 neurons in input layer, 30 neuron in hidden layer 1, 20 neuron in hidden layer 2 and 2 neurons in output layer), successfully learned the relationship between input and output parameters. The ANN results are
Table 6. Summary of the various ANN networks evaluated to yield the best coefficient of determination (R2)
Table 7. Summary of ANN networks evaluated to yield the best Mean Square Error
International Food Research Journal 18(4): 1321-1328
Evaluation of thin-layer drying models and neural network for describing drying kinetics of Lasagnas angustifolia L
Epoch
1 0
5
10
15
20
25
30
Train
Performance
0.1
Validation Test
0.01
0.001
Figure 8. Training error curve 0.05
1.2
0.04
R = 0.9996
0.8
Predict (MR)
Predict (DR)
1
2
A
0.6 0.4
2
R = 0.999
B
0.03
0.02
0.01
0.2
0
0 0
0.2
0.4
0.6
0.8
Measured (DR)
1
1.2
0
0.01
0.02
0.03
0.04
0.05
Measured (MR)
Figure 9. Correlation between the experimental data and the predicted values of the ANN model for prediction of: (A) Drying Rate (g/min) and (B) Moisture Ratio (%)
quite satisfactory in a way that R2 values are close to one, while mean square errors (MSE) were found to be very low. Analysis of the experimental data by the ANN revealed that there is a good correlation between the ANN-predicted results and the experimental data. Generally speaking, ANN proved to be a reliable alternative for Elaeagnus angustifolias thin-layer drying prediction due to generality and simplicity. References Al-Mahasneh, M.A., Rababah, T.M., Al-Shbool, M.A. and Yang, W. 2007. Thin-layer drying kinetics of sesame hulls under forced convection open sun drying. Journal of Food Process Engineering 30(3): 324–337. Amiza, M.A. and Aishah, S. 2011. Effect of drying and freezing of Cobia (Rachycentron canadum) skin on its gelatin properties. International Food Research Journal 18: 159-166. Ayaz, F., Kadioglu, A. and Dogru, A. 1999. Soluble sugar composition of Elaeagnus angustifolia L. var. orientalis (L.) kuntze (Russian olive) fruits. Turkish Journal of Botany 23: 349-354. Babalis, S. J., Papanicolaou, E., Kyriakis, N. and Belessiotis, V.G. 2006. Evaluation of thin-layer drying models for describing drying kinetics of figs (Ficus carica). Journal of Food Engineering 75: 205–214. Bakri, H.H. and Hobani, A.I. 2000. Thin-layer drying of dates. Journal of Food Process Engineering 23(3): 177–189. Ceylan, I., Aktas, M. and Dogan, H. 2007. Mathematical modeling of drying characteristics of tropical fruits. Applied Thermal Engineering 27: 1931–1936. Chakraverty, A. and Singh, R.P. 1988. Post harvest technology of cereals, pulses and oilseeds, New Delhi, India: Oxford and IBH Publishing Co. Pvt. Ltd.
1327
Chen, C. C. and Morey, R. V. 1989. Comparison of four EMC/ERH equations. Transactions of the ASAE 32(30): 983–990. Diamante, L., Durand, M., Savage, G. and Vanhanen, L. 2009. Effect of temperature on the drying characteristics, colour and ascorbic acid content of green and gold kiwifruits. International Food Research Journal 17: 441-45. Doymaz, I. 2004. Convective air drying characteristics of thin layer carrots. Journal of Food Engineering 61: 359–364. Doymaz, I. 2004. Drying kinetics of white mulberry studied. Journal of Food Engineering 61: 341–46. Erenturka, K., Erenturkb, S. and Tabilc, L.G. 2004. A comparative study for the estimation of dynamical drying behavior of Echinacea angustifolia: regression analysis and neural network. Computers and Electronics in Agriculture 45: 71–90. Ertekin, C. and Yaldiz, O. 2004. Drying of eggplant and selection of a suitable thin layer drying model. Journal of Food Engineering 63: 349–359. Henderson, S. M. 1974. Progress in developing the thinlayer drying equation. Transactions of the American Society of Agricultural and Biological Engineers17: 1167–1168, 1172. Henderson, S. M. and Pabis, S. 1969. Grain drying theory. I. Temperature effect on drying coefficient. Journal of Agriculture Engineering Research 6: 169–174. Hernandez-Perez, J.A., Garca-Alvarado, M.A., Trystram, G. and Heyd, B. 2004. Neural networks for the heat and mass transfer prediction during drying of cassava and mango. Innovative Food Science and Emerging Technologies 5: 57–64. Kashninejad, M., Mortazavi, A., Safekordi, A. and Tabil, L.G. 2007. Thin-layer drying characteristics and modeling of pistachio nuts. Journal of Food Engineering 78: 98–108. Kingsly, A.R.P. and Singh, D.B. 2007. Drying kinetics of pomegranate arils. Journal of Food Engineering 79: 741–744. Midilli, A., Kucuk, H. and Yapar, Z. 2002. A new model for single layer drying. Drying Technology 20(7): 1503–1513. Mohd Zainol, M.K., Abdul-Hamid A., Abu Bakar, F. and Pak Dek, S. 2009. Effect of different drying methods on the degradation of selected flavonoids in Centella asiatica. International Food Research Journal 16: 531537. Motevali, A., Minaei, S., Khoshtaghaza, M.H., Kazemi, M. and Nikbakht, A.M. 2010. Drying of Pomegranate Arils: Comparison of Predictions from Mathematical Models and Neural Networks. International Journal of food engineering 6 (3): 1-19. Movagharnejad, K. and Nikzad, M. 2007. Modeling of tomato drying using artificial neural networks. Computers and Electronics in Agriculture 59: 78–85. O’Callaghan, J. R., Menzies, D. J. and Bailey, P. H. 1971. Digital simulation of agricultural dryer performance. Journal of Agricultural Engineering Research 16: 223–244.
International Food Research Journal 18(4): 1321-1328
1328 Abbaszadeh, A., Motevali, A., Khoshtaghaza, M.H. and Kazemi, M.
Ojediran, J. O. and Raji, A. O. 2010. Thin layer drying of millet and effect of temperature on drying characteristics. International Food Research Journal 17:1-11. Page, G. 1949. Factors influencing the maximum rates of air-drying shelled corn in thin layers: M.S. Thesis. Lafayette, IN: Purdue University. Pedren, J.L., O-Molinaa,T., Monzo-Cabreraa, J., ToledoMoreob, A. and Sanchez- rnandez, D. 2005. A novel predictive architecture for microwave-assisted drying processes based on Neural Networks. International Communications in Heat and Mass Transfer 32: 1026–1033. Prachayawarakorn, S., Tia, W., Plyto, N. and Soponronnarit, S. 2008. Drying kinetics and quality attributes of lowfat banana slices dried at high temperature. Journal of Food Engineering 85: 509–517. Raouzeos, G.S. and and Sarvacos, G.D. 1986. Solar drying of raisins. Drying Technology 4: 633–649. Sacilik, K. and Konuralp Elicin, A. 2006. The thin layer drying characteristics of organic apple slices. Journal of Food Engineering 73: 281–289. Thankitsunthorn, S., Thawornphiphatdit, C., Laohaprasit, N. and Srzednicki, G. 2009. Effects of drying temperature on quality of dried Indian Gooseberry powder. International Food Research Journal 16: 355361. Tomczak, E. and Kaminski. W. 2001. Drying kinetics simulation by means of artificial neural networks. Handbook of Conveying and Handling of Particulate Solids. Elsevier Science B.V. Tripathy, P.P. and Kumar, S. 2009. Neural Network approach for food temperature prediction during solar drying. International Journal of Thermal Sciences 48: 1452–1459. Wiriya, P., Paiboon, T. and Somchart, S. 2009. Effect of drying air temperature and chemical pretreatments on quality of dried chilli. International Food Research Journal 16: 441-454. Xanthopoulos, G., Oikonomou, N. and Lambrinos, G. 2007. Applicability of a single-layer drying model to predict the drying rate of whole figs. Journal of Food Engineering 81: 553–559. Yagcıoglu, A., Degirmencioglu, A. and Cagatay, F. 1999. Drying characteristic of laurel leaves under different conditions, In: Bascetincelik A, editor. Proceedings of the 7th International Congress on Agricultural Mechanization and Energy (in Turkey). Yaldiz, O., Ertekin, C. and Uzun, H.I. 2001. Mathematical modeling of thin layer solar drying of sultana grapes. Energy 26: 457–465.
International Food Research Journal 18(4): 1321-1328