Evaluation of Truck Traffic at a Container Terminal Using Simulation Gregory A. Harris Director of the Office for Freight, Logistics and Transportation University of Alabama in Huntsville Huntsville, AL 35899 256-824-6060
[email protected] Bernard J. Schroer Principal Research Engineer University of Alabama in Huntsville Huntsville, AL 35899 256-824-6855
[email protected] Michael D. Anderson Department of Civil and Environmental Engineering University of Alabama in Huntsville Huntsville, AL 35899 256-824-5028
[email protected] Dietmar P.F. Moeller Professor of Computer Science and Computer Engineering University of Hamburg, Hamburg, Germany +49-(0)40-42883-2438
[email protected]
1
ABSTRACT This paper presents a simulation model to determine the impact of increased truck traffic entering and exiting the container terminal at the Alabama State Docks in Mobile, AL. Of special interest was the number of truck locations required to process the truck traffic and the possible use of trains to reduce the truck traffic entering and exiting the container terminal. Truck locations are used in the ProcessModel to control the maximum number of trucks in the container terminal. As a result, the number of truck locations is an important measure of the amount of space needed within the terminal. The Baseline Run1 had fifty trucks, or resources. Runs2-6 continually reduced the number of truck locations available. It appears that with the existing entity arrival rates only ten truck locations are necessary. The results with ten truck locations were identical to the results with fifty truck locations. The number of locations will probably have to increase if there is an increase in container traffic. The simulation results indicated that the container terminal would have a significant impact of truck traffic in and out of Mobile. A ship arriving every four days (or about seven ships a month) with an average of 450 containers for import and 350 containers for export will require about 350 trucks to bring in containers for export and another 450 trucks to move the incoming containers inland. This traffic volume will occur every four days, which is the time between arrivals of ships. Run3 estimated 4,400 trucks a month (or 220 per day) will be added to the interstate traffic in Mobile with the arrival of a container ship every four days. The addition of train service to the container terminal will reduce the truck traffic servicing the terminal. The simulation results for Run7 indicated at 18% reduction in truck traffic with a train arriving every five days. The arrival of a train every three days in Run8 had a 31% reduction in truck traffic. For every container that arrives on a train a truck is removed from delivering a container to the terminal. Also for every container that arrives on a ship and leaves the terminal on train a truck is removed from the Mobile road network. Included in this paper are a description of the simulation model, the experiment and an analysis of the simulation results. KEYWORDS Port, container terminal, intermodal, simulation
2
INTRODUCTION Over ninety percent of cargo currently transported worldwide is shipped as containerized cargo (Moffatt & Nichol, 2002). As supply chains become more global and the use of containerized cargo increases, the ports throughout the United States are improving operations and undergoing major expansions. The Alabama State Port Authority recently completed a major expansion of its container and intermodal operations at the Alabama State Docks in Mobile, Alabama. The shipping terminal includes 92 acres with 2,000 feet of berthing space dredged to a depth of 45 feet for two berths. A grade-separated roadway connects the container terminal with an intermodal terminal and value added warehousing and distribution area (Moffatt & Nichol, 2002). Figures 1 and 2 are two recent photographs of the new container terminal. There is concern by various state and regional agencies of the impact of increased truck traffic on the interstate system in the Mobile area. Mobile is served by interstate I10 going east and west and interstate I65 north that originates in Mobile. The objective of this study was to evaluate the impact of increased truck traffic resulting from the container terminal. One option evaluated was the offloading of containers onto trains.
Figure 1. Container ship arriving at terminal
3
Figure 2. One of two ship cranes unloading container onto a cart CONTAINER TERMINAL Figure 3 is a sketch of the container movement at the container terminal located at the Alabama State Docks in Mobile, AL. Containers arriving on ships will depart on trucks. Likewise, containers arriving on trucks will depart on ships. Tugs escort the ships into a berth. Cranes unload and load the containers. The cranes unload containers onto chassis that move the containers to the container yard. Stackers unload the containers at the container yard. Likewise, stackers load containers at the container yard onto chassis for transport to the ship dock. Stackers unload containers from trucks at the container yard. Stackers also load containers in the container yard from ships onto trucks for export. Three types of trucks arrive at the terminal. Trucks that arrive with a full container leave with no container. Trucks that arrive with no container leave with a full container. Also some trucks that arrive with an empty container leave with a full container. Interviews with the management of the docks indicated that upward of 95% of the trucks arrive and leave the facility in a condition different from their original condition, thus, few trucks arrive with a load and leave with a load. This is mainly due to the lack of a clearing house to inform potential logistics companies of opportunities to maximize loaded trips.
4
Full ships Tugs Ship berths Ship cranes Containers in on dock from ships Stackers
Containers out on dock for ships Carts move containers Containers from trucks
Containers from ships
Container yard Empty trucks Full trucks
Stackers Full trucks Empty Trucks
Figure 3. Overview of container model SIMULATION MODEL The ProcessModel (1999) used in this study was constructed following the conceptual framework developed by Schroer, et.al. (2008) consisting of a number of submodels that run independently. Each submodel has its own data input and entities with specific attributes. Data are shared between the submodels by global variables. The content of the global variables can be altered within any submodel with the new values immediately shared with any other submodel. These global variables can also be used in logic statements to control the movement and routing of entities, branching logic, and updating entity attributes. The ProcessModel has the following submodels:
Ship unloading and loading of containers Truck unloading and loading of containers Movement of containers from ship dock to container yard Movement of containers from container yard to ship dock
The terminal has the following resources: ship berths, ship cranes, truck locations, stackers, chassis and inspectors. The model has nine entity attributes, fourteen global variables, forty-six activity blocks and six entity blocks. MODEL VERIFICATION AND VALIDATION Model verification can be defined as determining if the model is correctly represented in the simulation code. Verification in ProcessModel was accomplished by eliminating all variation in the model and only using constants for all arrival times and service times. The times through the system could then be readily compared with the input data.
5
Model validation can be defined as determining if the model is an accurate representation of the real world system. ProcessModel has a Label block that displays data generated by the global variables during the simulation. By slowing the simulation down, it is possible to observe these values as the entities move through the simulation. A group of transportation experts were placed in front of the computer to observe the model operation and the peak hour volume moved through the system as designated by the input volumes. EXPERIMENTAL DESIGN The experimental design is provided in Table 1. Runs2-6 are identical to the Baseline Run1 with the exception of the number of ProcessModel resources allocated for truck locations. Trucks locations are defined as the maximum number of trucks permitted in the container terminal at a time and are critical in determining the amount of space for trucks within the terminal. Run7 was defined after selecting the output from Runs2-6 with the smallest number of truck locations and without a decrease container throughput. Run3 was selected and then modified to include the arrival and departure of trains at the terminal. Run7 had a train arriving every five days. Run8 had a train arriving every three days. Since containers arrived and departed on trains for Runs7-8 the time between arrivals of trucks was increased.
Run Baseline Run1 Run2 Run3 Run4 Run5 Run6 Run7 Run8
Table 1. Experimental design Description 50 truck locations 20 truck locations 10 truck locations 8 truck locations 7 truck locations 5 truck locations Run3 with addition trains arriving every five days Run3 with addition trains arriving every three days
The ProcessModel was run for twenty hours to reach steady state and another 160 hours after reaching steady state. The 160 hours is assumed to be one month of terminal operations. MODEL INPUT The data input for the Baseline Run1 was:
Time between arrivals o Ships (1440 minutes, or four days) o Trucks with full containers (5 minutes) o Trucks with no containers (4 minutes) o Trucks with empty containers (120 minutes)
6
Trucks arriving with full container o 98% exit with no container o 1% exit with empty container o 1% exit with full container Trucks arriving with no container o 100% exit with full container Trucks arriving empty o 99% exit with full container o 1% exit with no container Incoming containers on ships T(350,400,450) (T= t distribution with parameters a,b,c) Outgoing containers on ships T(250,300,350) T(15,20,25) minutes for tug to position ship T(9,10,11) minutes for inspector to inspect ship 2 minutes for crane to unload one container from ship 2 minutes to process paperwork before loading ship or truck 2 minutes for crane to load one container on ship T(4,5,6) minutes for tug to move ship into channel for exiting T(15,20,25) minutes for ship to leave port T(2,3,4) minutes to position incoming trucks with full container, truck empty, or truck with empty container T(2,3,4) minutes to inspect container on incoming truck T(4,5,6) minutes for truck with container, empty truck, or truck with empty container to leave terminal 2 minutes for stacker to load empty container or full container on truck 2 minutes for stacker to unload container from cart at container yard 2 minutes for stacker to load container on cart at container yard 2 minutes to move cart from ship dock to container yard 2 minutes to move cart from container yard to ship dock T(4,5,6) minutes to position truck with no container or truck with empty container T(4,5,6) minutes to move cart from container yard to ship T(4,5,6) minutes to move cart from ship to container yard
All incoming containers from ship exit on trucks. All incoming containers from trucks exit on ships. There is one container per truck. 75% of incoming containers from trucks are inspected. 15% of containers from ships are certified safe containers and are moved on a chassis directly to container yard. The time to move these containers to the container yard is T(4,5,6) minutes. The remaining 85% of containers from ships are moved on a chassis to an inspection area. Of these containers 98% are given a tailgate inspection. The time for the tailgate inspection is T(6,8,10) minutes. Containers are then moved on a chassis to the container yard in T(2,3,4) minutes.
7
The remaining two percent of the inspected containers are given an extensive inspection. The inspection time is T(240,300,360) minutes. Containers are then moved on a chassis to the container yard in T(2,3,4) minutes. A simplified and rapid approach to data collection is to ask the appropriate questions through interviews with personnel directly involved with the application (the expert). This is not only effective, but also a very time saving approach to obtaining data. In these instances the triangular distribution is often used as a subjective description of a population when there are only limited sample data and especially where actual data are scarce and the cost of collection high. For example, if the smallest value, the largest value and the most likely value are known for a process, then the outcome can be approximated by the triangular distribution. Most personnel engaged in a process can readily give estimates for the minimum, maximum and most likely values which correspond to the three parameters of the triangular distribution The Baseline Run1 had the following resources:
2 ship berths 2 ship cranes (loading and unloading containers on and off ship) 2 tugs 50 truck locations (maximum allowed number of trucks in terminal at a time) 20 chassis (moving containers between ship and container yard) 10 stackers (loading and unloading containers at container yard) 3 inspectors (inspecting incoming ships and trucks with full containers)
The Baseline Run1 had the following resource capacities:
Maximum of 10 chassis at a time can move chassis with containers from dock to container yard Maximum of 10 chassis at a time can move with containers from container yard to dock
The Baseline Run1 had the following entity movement constraints:
Full containers are moved on a chassis from ship dock to container yard as soon as unloaded from ship. Maximum of ten empty chassis can be positioned at the ship dock. Full containers are moved on chassis from the container yard to the ship dock only when the ship is unloaded and ready to begin loading. Maximum of ten full chassis for loading are allowed at the ship dock.
8
BASELINE RUN RESULTS The ProcessModel for the Baseline Run1 was run for twenty hours to reach steady state and another 160 hours after reaching steady state. Table 2 gives the results for the Baseline Run1. The average time a ship was in the terminal was 1,851 minutes. The average time an incoming truck with a container was in the terminal was 12 minutes. The average time a truck arriving empty was in the terminal was 14 minutes. Table 2. Simulation results for Baseline Run1 Baseline Run1 50 Truck locations Avg. Entities through Terminal 7 Ships 1,920 Trucks Arriving with Full Container 2,400 Trucks Arriving Empty 80 Trucks Arriving with Empty Containers Avg. time in terminal (min) 1,851 Ships 12 Trucks Arriving with Full Container 14 Trucks Arriving Empty 12 Trucks Arriving with Empty Containers Utilization 12% Truck Locations (50) 23% Stackers (10) 43% Chassis (20) 63% Ship Berths (2) 1% Tugs (2) 62% Ship Cranes (2) 15% Inspectors (3) Containers 3,043 In on Ship 2,160 In on Truck 2,135 Out on Ship 2,722 Out on Truck Inventory 1 Out on Ship 288 Out on Truck
The utilization of many of the resources is relatively low. Therefore, it may be possible to further reduce the number of these resources without any impact on terminal operations. For example, based on current ship traffic one tug may be sufficient since tug
9
utilization was only 1%. Also, the stackers had a utilization of 23% and the chassis had a utilization of 43%. These resources probably could be reduced at the modeled volumes. Table 3 displays a comparison of the mean time an entity was in the terminal with the value added time for the Baseline Run1. The difference between the two times is the delay time the entity had to wait for a resource, activity or a container. The only entity delay was ships. A ship had to wait an average of 402 minutes while trucks had no delay times. Several reasons for this delay may be the lack of containers at the dock for loading and the availability of a cart to move the container from the container yard to the dock. Table 3. Comparison of mean times with value added times for Baseline Run1 Entity Number Mean time Mean value Delay of entities in terminal added time in time (min) terminal (min) (min) 7 1,851 1,449 402 Ships 1,920 12 12 0 Trucks Arriving with Full Container 2,400 14 14 0 Trucks Arriving Empty 80 12 12 0 Trucks Arriving with Empty Container
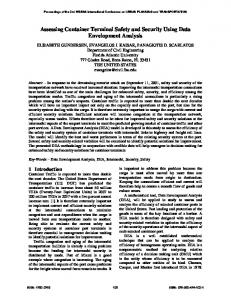
DECOUPLING CONTAINER INSPECTIONS A previous study by Harris, et.al. (2009) evaluated three inspection protocols: A) no inspection, B) container sampling with unloading and inspection coupled and C) inspection after unloading or decoupling inspection from unloading. Any sampling plan using Protocol B had an impact on entity throughput. Decoupling the inspection from unloading in Protocol C did not impact entity throughput. In fact, entity throughput for Protocol C was similar to no container inspection for Protocol A. As a result of this study the ProcessModel in this paper decoupled the inspection. CONSTRAINING TRUCK TRAFFIC INSIDE TERMINAL Table 4 shows the results of continuing decreasing the number of truck locations in the terminal (Runs2-6). The Baseline Run1 has fifty truck locations which defines the maximum number of trucks that are permitted in the terminal at one time. Runs2-6 slowly decreased the maximum number of locations until delays occurred in the processing of terminal entities. Figure 4 is a plot of truck slot utilization as a function of number of truck locations. Truck slot utilization was 12% with fifty truck locations. Slot utilization increased to 30% with 20 truck locations, 60% with 10 truck locations, 76% with eight truck locations, 86% with seven locations and 100% with five truck locations. Entity times through the terminal remained constant until seven or fewer truck locations (Runs5-6). The time a truck was in the terminal was 12 minutes with no delays with seven truck locations and increased to 549 minutes with five truck locations. Therefore,
10
it appears that a minimum of ten truck locations is adequate to handle the defined entity arrival rates. Table 4. Simulation results for Runs2-6 Baseline Run2 Run3 Run4 Run1 50 20 10 8
Truck locations Avg. Entities through Terminal Ships Trucks Arriving with Full Container Trucks Arriving Empty Trucks Arriving with Empty Containers Avg. time in Terminal (min) Ships Trucks Arriving with Full Container Trucks Arriving Empty Trucks Arriving with Empty Containers Utilization Truck Locations Stackers Chassis Ship Berths Tugs Ship Cranes Inspectors Containers In on Ship In on Truck Out on Ship Out on Truck Inventory Out on Ship Out on Truck
Run5
Run6
7
5
7 1,920
7 1,920
7 1,920
7 1,921
7 1,920
6 1,799
2,400 80
2,400 80
2,400 80
2,400 80
2,400 80
1,786 80
1,851 12
1,851 12
1,836 12
1,906 12
1,847 12
2,109 549
14 12
14 12
14 12
14 12
14 11
1,464 275
12% 23% 43% 63% 1% 62% 15%
30% 23% 44% 63% 1% 62% 15%
60% 23% 41% 63% 1% 62% 15%
76% 23% 42% 66% 1% 64% 15%
86% 23% 42% 62% 1% 62% 15%
100% 21% 40% 73% 1% 72% 14%
3,037 2,159 2,072 2,723
3,037 2,159 2,072 2,723
3,029 2,160 2,030 2,715
3,113 2,159 2,117 2,723
2,965 2,159 2,088 2,725
3,073 1,990 1,976 2,045
83 288
69 262
103 261
23 348
50 207
0 994
The results of the Baseline Run1 indicated monthly container traffic of 5,203 containers in from ship and truck and 4,857 containers out on ship and truck. This equate to annual container traffic of:
11
Containers in 62,436 Containers out 58,284 Containers in container yard 3,468 Total containers handled 124,188 The first year of operations of the container terminal was 130,000 TEUs. The simulation results closely approximated the actual container activity.
Truck location Utilization (%)
100 80 60 40 20
50
40
30
20
10 8 7 5
Number of truck locations
Figure 4. Truck slot utilization versus number of truck locations
Based on the simulation results from Run1 an estimated 2,400 trucks with no containers, 80 trucks with empty containers and 1,920 trucks with full containers will arrive at the terminal monthly. This equates to a total of 4,400 trucks entering and leaving the terminal monthly or 220 trucks a day. These trucks will generally leave the terminal on interstate I65 north or I10 going east or west. OFFLOADING TRUCKS ONTO RAIL One approach to reducing the volume of truck traffic is to have containers enter and leave the terminal on rail. The ProcessModel was modified to include trains. The additional input data were:
Incoming containers on trains T(90,100,110) Outgoing containers on ships T(90,100,130) T(15,20,25) minutes to position train T(9,10,11) minutes to inspect train 2 minutes for train crane to unload one container from train 2 minutes to process paperwork before loading train
12
2 minutes for crane to load one container on train T(4,5,6) minutes for train to leave terminal
Table 5 gives the time between arrivals for trucks and trains for Runs7-8. The truck arrivals were lowered and the train traffic was included for Runs7-8. A train arrived and departed the terminal with an average of 100 containers. Ship traffic remained constant. Table 5. Time between arrivals for trucks and trains Entity Run3 Run7 Run8 5 minutes 6 minutes 7 minutes Trucks Arriving with Full Container 4 minutes 5 minutes 6 minutes Trucks Empty 2,440 minutes 2,440 minutes 1,440 minutes Trains (or five days) (or five days) (or three days)
The following three additional submodels were added to ProcessModel:
Train unloading and loading of containers Movement of containers from train pavement to container yard Movement of containers from container yard to train pavement
These submodels required two new resources: train locations and train cranes. Also the submodels added four entity attributes, two global variables, twenty-seven activity blocks and three entity blocks. Table 6 presents the simulation results for Runs7-8 compared with Run3 after running the model for one month or twenty days. All three runs had only ten truck locations. Figure 5 is a plot of the number of containers leaving the terminal by ship, truck and train. Figure 6 is a plot of the entity traffic. The results in both figures are compared with Run3 since Run3 is identical to the Baseline Run1 with the exception of only having ten truck locations. The times to process ships and truck remained relatively constant. However, as anticipated truck traffic decreased from 4,400 for Run3 to 3,600 for Run7 and to 3,051 for Run8. At the same time train traffic through the terminal was 5 trains for Run7 and 7 trains for Run8.
13
Table 6. Simulation results for Baseline Run1 (one month simulation) Run3 Run7 Run8 10 10 10 Truck locations Avg. Entities through Terminal 7 7 7 Ships 1,920 1,600 1,371 Trucks Arriving with Full Containers 2,400 1,920 1,600 Trucks Arriving Empty 80 80 80 Trucks Arriving with Empty Containers na 5 8 Trains Avg. time in terminal (min) 1,866 1,919 1,874 Ships 12 12 12 Trucks Arriving with Full Containers 13 14 14 Trucks Arriving Empty 12 12 12 Trucks Arriving with Empty Containers na 768 753 Trains Utilization 60% 49% 41% Truck Locations 22% 23% 24% Stackers 40% 51% 56% Chassis 63% 66% 64% Ship Berths 1% 1% 1% Tugs 62% 65% 63% Ship Cranes na 12% 23% Train Cranes 15% 13% 11% Inspectors Containers 2,958 3,121 3,090 In on Ship 2,159 1,799 1,542 In on Truck na 508 805 In on Train 2,090 2,181 2,069 Out on Ship 2,715 2,159 1,799 Out on Truck na 520 858 Out on Train Inventory 42 126 278 Out on Ship 204 185 361 Out on Truck na 247 66 Out on Train
For Run7 a total of 520 containers exited the terminal on five trains that is equivalent to removing 520 trucks exiting the terminal with containers. The input data for the time between arrivals for empty trucks was increased from four to five minutes. Therefore, rather than 2,400 empty truck arrivals during month for the Baseline Run1, there were only 1,920 arrival for Run7, or a reduction of 480 trucks.
14
Likewise, the input data for the time between arrivals for trucks with containers was increased from five minutes for the Baseline Run1 to six minutes for Run7. Therefore, rather than 1,920 truck arrivals, there were only 1,600 arrivals, or a reduction of 300 trucks. A total of 480+300 or 780 trucks were removed from the traffic in the Mobile area. As anticipated, for every container arriving on train a truck is removed from delivering a container to the terminal. Also for every container leaving the terminal on train a truck is removed. The interstate truck traffic was lowered by 18% in Run7 with the arrival of a train every five days. The interstate truck traffic was lowered by 31% in Run8 with the arrival of a train every three days. Containers out 5,000 On trucks
4,000
Total containers out On ships
3,000
2,000
1,000
On trains
Run3 Time between Arrivals Trains Truck full Truck empty Ships
0 5 min 4 min 4 days
Run7 5 days 6 min 5 min 4 days
Run8 3 days 7 min 6 min 4 days
Figure 5. Monthly containers leaving terminal
15
Entity Traffic 5,000 4,400
4,000
3,600 (-18% from Run3) 3,051 (-31% from Run3)
3,000 Trucks 2,000 Ships
1,000 Trains
7
7
7
10
8 5
0
Run3
Run7
Run8
Figure 6. Monthly entity traffic CONCLUSIONS In summary the following conclusions are made:
Trucks locations are used in the ProcessModel to control the maximum number of trucks in the container terminal. As a result, the number of truck locations is an important measure of the amount of space needed within the terminal for truck traffic. The Baseline Run1 had fifty truck locations, or resources. Runs2-6 continually reduced the number of truck locations. It appears that given the existing entity arrival rates only ten truck locations are necessary. The result with ten truck locations was identical to the results with fifty truck locations. The number of locations will probably have to increase if there is an increase in container volume.
The truck entities for the Baseline Run1 and many of the other runs experienced no delays (that is, the total time in the terminal equaled the value added time). However, the ships and trains experienced delays. For the Baseline Run1 the average ship delay was 402 minutes. For Run7 the average ship delay was 414 minutes and the average train delay was 321 minutes. These delays were probably due to the lack of containers or the availability of a resource.
The container terminal will have a significant impact of truck traffic in and out of Mobile. A ship arriving every four days (or about seven ships a month) with an average of 450 containers for import and 350 containers for export will require 350 trucks to bring in containers for export and another 450 trucks to move the
16
incoming containers from ship inland. This traffic volume will occur every four days, which is the time between arrivals of ships.
Run3 estimated 4,400 trucks a month (or 220 per day) will be added to the interstate traffic in Mobile with the arrival of a container ship every four days.
The addition of train service to the container terminal will reduce the truck traffic servicing the terminal. Run7 included a train arriving every five days with 100 containers. Also the input data for the time between arrivals of trucks with containers was increased from 5 minutes for Run3 to 6 minutes for Run7. The input data for the empty truck arrivals were increased from 4 minutes for Run3 to 5 minutes for Run7. The simulation indicated at 18% reduction in truck traffic with a train arriving every five days.
The arrival of a train every three days in Run8 had a 31% reduction in truck traffic. The input data for the arrival of trucks with containers was increased to 6 minutes and the empty truck arrivals were increased to 7 minutes.
The 18% reduction in truck traffic for Run7 is about 900 trucks per month or about 45 trucks a day. The 31% reduction in truck traffic for Run8 is about 1,350 trucks per month or about 67 trucks a day.
For every container that arrives on a train a truck is removed from delivering a container to the terminal. Also for every container that arrives on a ship and leaves the terminal on train a truck is removed from the Mobile road network.
Many of the resources had relative low utilizations. Therefore, it may be possible to further reduce these resources without impacting the terminal operations.
ACKNOWLEDGEMENTS This research was sponsored by the U.S. Department of Transportation, Federal Transit Administration, Project No. AL-26-7262-01. REFERENCES Harris, G., B. Schroer and D. Moeller, 2009; “Security Inspection Protocols: Impact on Container Terminal Throughput Using Simulation,” Proceedings Huntsville Simulation Conference, Huntsville, AL, October. Moffatt & Nichol, 2002: Development Master Plan (Choctaw Point Terminal), Moffatt & Nichol Engineers, Mobile, AL. ProcessModel, 1999: Users Manual, ProcessModel Corp., Provo, UT. Schroer, B., M. Rahman, G. Harris and D. Moeller, 2008: “Conceptual Framework for Simulating Seaport Terminals,” Proceedings Huntsville Simulation Conference, Huntsville, AL, October..
17