Aug 19, 2016 - a few technologies available today for data stream processing and this increases the ... basis of practical experiments, few of the available benchmarks developed to test ...... The core Apache Spark engine treats these batches of data as normal ... of immutable, distributed and partitioned data sets known as ...
Evaluation of two major data stream processing technologies Triparna Dasgupta August 19, 2016
MSc in High Performance Computing with Data Science The University of Edinburgh Year of Presentation: 2016
Abstract With the increased demand for fast and real-time processing of data that is continuously generated, there have been a lot of advancements towards building technologies which can process streams of data and generate output with minimal time lag. There are quite a few technologies available today for data stream processing and this increases the need to compare and evaluate them in order to find out the strengths, weaknesses and suitability of each in different problem scenarios. This MSc project evaluates the characteristics and performance of two major data stream processing technologies based on results obtained by executing benchmark tests on these technologies in order to provide recommendations on their suitability in different problem scenarios. Few important data stream processing technologies were studied to identify the differences in their architecture, design and use. Based on this, two of the most suitable candidates, Apache Spark Streaming and Apache Storm, were selected on the basis of their popularity and availability to be further evaluated. To conduct evaluations on the basis of practical experiments, few of the available benchmarks developed to test the performance of data stream processing technologies were studied and the most suitable one was selected based on closeness to a real world use case and availability of test data. The results obtained for various test cases run on both technologies were recorded in order to analyse their performance and behaviour. Based on these observations and a detailed comparative analysis, it was found that for a standalone configuration, Apache Storm was able to process data streams faster than Apache Spark Streaming and also handle more rate of ingestion of input data into the system, thereby suggesting that Apache Storm is more suitable for task intensive problem scenarios. Apache Spark Streaming, on the other hand, was found to be more suitable when the problem scenario demands fault tolerance or is more data intensive in nature.
Contents Chapter 1 Introduction ........................................................................................................1 1.1 Big Data ....................................................................................................................1 1.1.1 Volume ..............................................................................................................2 1.1.2 Variety ...............................................................................................................2 1.1.3 Velocity .............................................................................................................2 1.2 Data Stream Processing Technologies .....................................................................3 1.3 Project Goal ..............................................................................................................3 1.4 Approach...................................................................................................................4 Chapter 2 Background ........................................................................................................6 2.1 Data Stream Processing Technologies .....................................................................6 2.1.1 Apache Spark Streaming...................................................................................7 2.1.2
Apache Storm.............................................................................................11
2.1.3
Apache Flink ..............................................................................................14
2.1.4
Amazon Kinesis .........................................................................................17
2.1.5
Google Data Flow ......................................................................................19
2.2
Choosing appropriate candidates ......................................................................21
2.3
Benchmarking Data Stream Processing Technologies.....................................22
2.3.1
Apache Kafka.............................................................................................24
2.3.2
Redis ...........................................................................................................29
Chapter 3 Benchmark for Evaluation ...............................................................................31 3.1 The Benchmark Functional Design .......................................................................31 3.2 The Benchmark Technical Design .........................................................................33 i
3.2.1 Installation of all the required technologies ...................................................33 3.2.2 Executing the tests ...........................................................................................33 3.2.3 Stopping execution of test ...............................................................................34 3.3 The Input Data ........................................................................................................35 3.4 The Benchmark Processing logic...........................................................................36 3.4.1 Apache Spark Streaming.................................................................................36 3.4.2 Apache Storm ..................................................................................................37 3.5 The Output Data Generated ...................................................................................38 Chapter 4 Experiment Setup.............................................................................................40 4.1 Working Node ........................................................................................................40 4.2 Pre-requisite Software Installations .......................................................................40 4.3 Downloading and Setting up Benchmark ..............................................................42 4.4 Troubleshooting ......................................................................................................43 Chapter 5 Experimental Details .......................................................................................45 5.1 General Experiments ..............................................................................................45 5.1.1 Maximum Throughput threshold Measurement.............................................45 5.1.2 Latency Recording ..........................................................................................46 5.2 Technology Specific Experiments .........................................................................46 5.2.1 Apache Spark Streaming.................................................................................47 5.2.2 Apache Storm ..................................................................................................49 Chapter 6 Results and Analysis ........................................................................................53 6.1 Apache Spark Streaming ........................................................................................53 6.1.1 Maximum Throughput Threshold Measurement ...........................................53 6.1.2 Controlling Batch duration..............................................................................55 6.1.3 Applying Backpressure ...................................................................................56 6.1.4 Increasing the level of parallelism in Data Receiving....................................57 6.1.5 Conclusion .......................................................................................................59 6.2 Apache Storm .........................................................................................................59 ii
6.2.1 Maximum Throughput threshold Measurement.............................................59 6.2.2 Disabling ACKing ...........................................................................................61 6.2.3 Increasing the number of executors and tasks ................................................62 6.2.4 Conclusion .......................................................................................................63 6.3 Comparative Analysis ............................................................................................64 6.3.1 Computation Model ........................................................................................64 6.3.2 Maximum Throughput Threshold ..................................................................64 6.3.3 Latency Recording ..........................................................................................66 6.3.4 Fault Tolerance ................................................................................................67 Chapter 7 Conclusions and future work ...........................................................................69 7.1 Recommendations ..................................................................................................71 7.2 Future Work ............................................................................................................72 7.2.1 Evaluating Apache Spark Streaming and Apache Storm in a multi-node environment ..............................................................................................................72 7.2.2 Extending this project to include other data stream processing technologies ...................................................................................................................................72 References .........................................................................................................................73
iii
List of Tables Table 1: A tabular representation of the variations in processing time with respect to maximum throughput. ......................................................................................................54 Table 2: A tabular representation of the processing times with respect to batch duration. ...........................................................................................................................................55 Table 3: A tabular representation of the effect of backpressure enabled and disabled on the processing times retrieved with respect to the percentage of tuples processed. .......56 Table 4: A tabular representation of the processing times retrieved in Apache Spark Streaming with respect to the increase in Kafka partition. ..............................................58 Table 5: A tabular representation of the processing times retrieved in Apache Storm with respect to the maximum throughput. .......................................................................60 Table 6: A tabular representation of the processing times obtained for Apache Storm with respect to the ACKing enabled and disabled. ..........................................................61 Table 7: A tabular representation of the processing times obtained for Apache Storm with respect to the number of workers, executors and tasks. ..........................................62 Table 8: A tabular representation of the final event latencies obtained for different throughput values for Apache Spark Streaming and Apache Storm...............................66
iv
List of Figures Figure 1: A diagrammatic representation of how the combination of three essential characteristics creates Big Data. .........................................................................................2 Figure 2: A diagrammatic representation of a Data Stream Processing Technology. (Recreated from http://www.ishisystems.com/realtime-stream-processing). ...................7 Figure 3: A diagrammatic representation of the architecture of Apache Spark Streaming. (Recreated from http://spark.apache.org/docs/latest/streamingprogramming-guide.html) ..................................................................................................8 Figure 4: A diagrammatic representation of data is internally handled in Apache Spark Streaming. (Recreated from http://spark.apache.org/docs/latest/streamingprogramming-guide.html) ..................................................................................................9 Figure 5: A diagrammatic representation of how DStreams are broken down into Resilient Distributed Datasets. (Recreated from http://spark.apache.org/docs/latest/streaming-programming-guide.html) ........................9 Figure 6: A diagrammatic representation of the components of a Storm cluster. (Recreated from http://storm.apache.org/releases/current/Tutorial.html) .......................12 Figure 7: A diagrammatic representation of a topology consisting of spouts and bolts as nodes and edges connecting them together. (Recreated from http://storm.apache.org/releases/current/Tutorial.html) ..................................................13 Figure 8: A diagrammatic representation of Apache Flink Component Stack. (Recreated from https://ci.apache.org/projects/flink/flink-docs-release-1.1/) ................15 Figure 9: A diagrammatic representation of the architecture of Amazon Kinesis. (Image taken from http://docs.aws.amazon.com/kinesis/latest/dev/key-concepts.html) ............17 Figure 10: A diagrammatic representation of the architecture of Google DataFlow. (Image taken from http://dataconomy.com/google-cloud-dataflow/) .............................20 Figure 11: A diagrammatic representation of the architecture of Apache Kafka. (Recreated from http://kafka.apache.org/documentation.html#introduction) ................24 Figure 12: A diagrammatic representation of partitions with ordered messages in a Kafka topic. .......................................................................................................................25 v
Figure 13: A diagrammatic representation of how Apache Kafka uses the concepts of both message queue and publish-subscribe messaging pattern. (Recreated from http://kafka.apache.org/documentation.html#introduction) ............................................26 Figure 14: A diagrammatic representation of the sequential individual steps executed in the benchmark test. (Recreated from https://yahooeng.tumblr.com/post/135321837876/benchmarking-streamingcomputation-engines-at/) ..................................................................................................32 Figure 15: A representation of how the control bash script is executed to install the technologies for benchmarking. .......................................................................................33 Figure 16: A representation of how the control bash script is executed to run the evaluation test for Apache Spark Streaming. ...................................................................33 Figure 17: A source code screen shot of how the configuration YAML file is accessed by Apache Spark Streaming in order to fetch configuration parameter values. .............36 Figure 18: A source code screen shot of how the configuration YAML file is accessed by Apache Storm in order to fetch configuration parameter values. ..............................37 Figure 19: A source code screen shot of how the TopologyBuilder is used to create spouts and bolts to define the processing logic for Apache Storm. ................................37 Figure 20: A screen shot showing that the zookeeper port had to be changed to 9999 in all configuration files due to port conflict. .......................................................................43 Figure 21: A screen shot showing that the Yahoo! code for starting Zookeeper server was erroneous and mentioned the Storm directory instead of the Zookeeper directory.43 Figure 22: A screen shot showing that the Zookeeper directory was changed in the project implementation. ....................................................................................................43 Figure 23: A screen shot showing that the Kafka topic name has been hardcoded in the Yahoo! benchmarking source code. .................................................................................44 Figure 24: A screen shot showing how the batch duration is controlled by mentioning the value in the configuration file.....................................................................................47 Figure 25: A screen shot showing how the value set in Figure 23 is used to define the batch duration of each job in StreamingContext object...................................................47 Figure 26: A screen shot showing how Backpressure is enabled by setting the spark.streaming.backpressure.enabled parameter as true in the SparkConf object. .......48 Figure 27: A screen shot showing how Kafka topic name and the number of partitions for that topic are specified in the configuration file. ........................................................49 Figure 28: A screen shot showing how a Kafka topic is created along with the partitions required. ............................................................................................................................49
vi
Figure 29: A screen shot showing how Apache Spark Streaming connects to Apache Kafka using the createDirectStream method where it creates a one-to-one mapping between the RDD partitions and the Kafka partitions. ....................................................49 Figure 30: A screen shot showing how the number of acker is specified by user for Apache Storm in the configuration file. ...........................................................................50 Figure 31: A screen shot showing how the parameter for number of ackers is read from the configuration file and set in Apache Storm. ..............................................................50 Figure 32: A screen shot showing how the number of workers and executors are specified by user for Apache Storm in the configuration file. ........................................51 Figure 33: A screen shot showing how the number of workers, executors and tasks are set in Apache Storm for an application. ...........................................................................51 Figure 34: A graphical representation of the variations in processing time with respect to maximum throughput. ..................................................................................................54 Figure 35: A comparative graphical representation of the effect of controlling the batch duration on the processing time........................................................................................55 Figure 36: A comparative graphical representation of the effect of enabling or disabling backpressure on the processing time. ...............................................................................57 Figure 37: A comparative study of the effect of increasing the level of parallelism on the processing time. ..........................................................................................................58 Figure 38: A graphical representation of the change in processing time in milliseconds with varying maximum throughput handled. ...................................................................60 Figure 39: A comparative graphical representation of the effect of ACKing on the processing time for Apache Storm. ..................................................................................61 Figure 40: A graphical representation of the variations in processing times when the number of executors and tasks are increased. ..................................................................63 Figure 41: A comparative graphical representation of the performance results of Apache Spark Streaming and Apache Storm. ..................................................................65 Figure 42: A comparative graphical representation of the final event latency variation with respect to increasing throughput. .............................................................................67
vii
Acknowledgements First and foremost, I would like to thank my supervisor, Dr. Charaka Palansuriya, for the immense support, guidance and valuable insights he gave me with during the project. I am thankful to the Systems Administration team at The University of Edinburgh which helped me in every possible way with system related issues. I would also like to thank my flat mate, Hossain Mohammed Sawgat for the care he showed me while I was writing my dissertation. He ensured I never worked with an empty stomach! Lastly, I would like to thank my mother, Bhaswati Dasgupta, for the strong support that she has been, not only during my project, but always.
viii
Chapter 1 Introduction With an increased focus on data and how it can be used as “the new oil” to gain more value in business and research, there has been a sharp increase in the amount of data generated, processed and stored in every domain.[1] Be it the financial and business industry where huge amounts of banking transactions and stock data are captured for instantaneous processing and monitoring or the medical and life sciences domain where large data sets containing clinical and patient data are researched to bring in knowledge breakthroughs, the size and complexity of data is constantly on the rise. Even in the research areas related to oceanography and astronomy, a lot of effort is put into processing and managing vast amounts of data.[2] The fact that more than 2.5 quintillion bytes of data gets generated each day and that around 90% of the total amount of data present in this world has been created in the last two years indicates that the rate of data growth is extremely high and everincreasing.[3] This introduces the concept of “Big Data”, an appropriate name coined in 2005 by Roger Magoulas, the Director of Market Research at O‟Reilly Media.[2]
1.1 Big Data Big Data is a general term given to massive quantities of information assets that are complex enough to demand innovative processing techniques to gain deep and valuable insights into the data.[4] It is characterised by certain specific and complex features which make handling of big data unique and different from handling just large amounts of data. Although in the recent years, industry experts and researchers have come up with around ten such characteristics, the following three, as explained in a research note published by Doug Laney, then Group Analyst at META (now a part of Gartner) in February 2001, were identified to be the most essential characteristics which describe the nature of big data [5]:
1
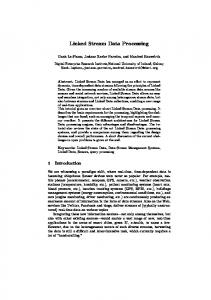
Figure 1: A diagrammatic representation of how the combination of three essential characteristics creates Big Data.
1.1.1 Volume This characteristic refers to the quantity or the size of data that needs to be captured or processed. While trying to handle big data, it has to be considered that the size of the concerned data sets are usually massive, in the order of petabytes, zettabytes or above according to the nature of the problem. Data Volume is the key reason behind the fact that it is impossible to store and handle big data using traditional relational database management systems. Not only will it fail to adequately store such huge quantity of data, it will also introduce more issues such as increase in cost and no reliability.[6] 1.1.2 Variety Data Variety refers to the fact that data is not restricted to be of the same type or structure. It may exist in different formats such as documents, images, emails, text, video, audio and other kinds of machine generated data such as from sensors, GPS signals, RFID tags, DNA analysis machines, etc. The data might follow a particular structure or might be completely unstructured in nature. Variety also indicates that data may have to be captured, blended and aligned from different sources. This increases the complexity of the data analysis as not only it has to be cost efficient while retrieving different types of data, it also has to be designed in such a way that it is flexible and efficient enough to handle data from multiple sources.[6] 1.1.3 Velocity Data Velocity refers to data in motion, continuously streaming into the system. A few examples of streaming data are the clicks generated by various users logged into a 2
particular website or readings being taken from a sensor. Some of the challenges that Data Velocity introduces are maintaining consistency in volatile data streams and ensuring completeness of the analysis and processing required on streaming data. Two new concepts that get introduced when Velocity is concerned are Latency and Throughput. Throughput describes the rate at which data is being consumed or ingested into the system for processing whereas Latency is the total time taken to process the data and generate the output since the data entered into the system. While trying to process or analyse data in motion, it is very important to keep up with the speed at which data is being ingested into the system. The architecture of the system capturing, analysing and processing data streams should be able to support real-time turnaround time, that is, a fraction of a second. Also this level of efficiency must be consistent and maintained over the total period of processing time. This characteristic led to the development of new technologies which focus on realtime processing of data streams. These technologies capture data from varied sources and of varied data types continuously in streams and quickly process them to generate output almost instantaneously without much time lag.[6]
1.2 Data Stream Processing Technologies Data Stream processing is the analysis of data in motion. Streaming data is iteratively accepted as input and continuously processed to deliver the desired output in as little time lag as possible. Data Stream Processing Technologies are platforms that are built keeping the objectives and requirements of data stream processing of in mind to efficiently extract insight and intelligence, generating output or alerts in real-time. These technologies are designed to handle massive volumes of data coming in from multiple sources and have a highly available, fault tolerant and scalable architecture. In contrast to traditional models where data is first stored, indexed to gain access speed and finally processed as per requirements, these systems capture data on-the-fly and start processing without storing it. [7]
1.3 Project Goal Data stream processing technologies in its essence deal with complex concepts and are developed to tend to complex requirements. There is currently a lot of research and development going on to build technologies that better achieve the diverse requirements. As a result, recently, many different data stream processing technologies have been developed and made available for use. Each product is uniquely designed, their architecture specially built to perform fast paced analytics on continuously streaming data. With so many data stream processing technologies available today, it is important to understand the differences in their architecture, design and processing strengths. This enables one to decide which technology can be the best candidate among others based on the project requirements and the resources available. This project attempted at taking 3
a step forward in gathering knowledge and analysing the strengths of the data stream processing technologies, evaluate them through quantitative experiments and finally recommend the suitability of the different technologies in different scenarios. The goal of this project was to first achieve a good understanding of the different data stream processing technologies available, select two of the major technologies to further evaluate the differences in their approach towards processing data streams experimentally by performing specific benchmark tests and finally be able to produce a detailed comparative analysis to understand and note their suitability in different scenarios. The project was guided by the following specific objectives that were identified and finalised during the Project Preparation phase:
Comparing and evaluating two of the major technologies for data stream processing, that is, Apache Spark Streaming and Apache Storm and gather knowledge about their behaviour through execution of evaluation tests in a standalone machine.
Finding explanations for the results obtained from the experiments using knowledge gained about their architecture and configuration.
Performing a comparison of the computational model, maximum throughput threshold, latency and fault tolerance features of Apache Spark Streaming and Apache Storm.
Recommending the suitability of these technologies in different scenarios based on the comparative analysis.
1.4 Approach The following is the approach taken to achieve the project goal and its objectives. Firstly, the architecture and the design of the major data streaming technologies were studied. A lot of background reading was done in order to gain knowledge in how the technologies differ in their approach towards handling data streams. The observations and finding are discussed in detail in Chapter 2. Secondly, to conduct experiments on the technologies, few of the benchmark tests available for evaluating data stream processing technologies were studied. Out of these, the one designed and developed by Yahoo! was chosen to be used for this project for various reasons such as availability of source code, consideration of a real world scenario while designing the process, and focus on the ease of use by giving attention to automation. This benchmark test has been discussed in detail in Chapter 3. Thirdly, in order to execute the benchmark evaluation tests in the selected hardware infrastructure, certain additional software installations and configuration changes were required. All the steps undertaken to create a working environment for the benchmark test has been discussed in Chapter 4. 4
The benchmark tests were then executed for both the technologies. Also, certain configuration parameters identified for each technology were changed to see how these parameters affected the performance of the technologies. Lastly, the results obtained were analysed and interpreted in order to understand the performance level of the technologies. Comparative analysis of these results was done in order to understand which technology provided better performance results and finally recommend the suitability of these technologies for different scenarios. The experiments planned and executed have been discussed in Chapter 5 followed by the results obtained and comparative analysis in Chapter 6.
5
Chapter 2 Background This chapter discusses the background study done on the various data stream processing technologies. Getting to understand the various technologies, their architecture and design was a major pre-requisite for the successful completion of this project. It helped to understand the purpose and characteristics of data stream processing technologies and how these achieve the specific requirements. Information and knowledge about the differences in architecture and design of the various technologies helped to get a clear idea about various aspects such as to how the technologies handle streaming data or how the internal set-up helps with data processing.
2.1 Data Stream Processing Technologies Data Stream Processing Technologies as explained in Section 1.2 are the technologies of today, when the requirement is to not only handle huge amounts of data but to be able to quickly produce results for continuous, never-ending data streams. These technologies should be flexible enough to be configured with various input and output systems and capable enough to achieve very quick response time. Considering that it may be used to handle real time continuous critical data such as financial stock transactions based on which important financial decisions may be taken, it is crucial that it ensures real time processing and generation of output with bare minimum turnaround time.
6
Figure 2: A diagrammatic representation of a Data Stream Processing Technology. (Recreated from http://www.ishisystems.com/realtime-stream-processing).
Few of the Data Stream Processing Technologies considered for evaluation are as follows: 2.1.1 Apache Spark Streaming Apache Spark Streaming, as the name suggests, is an extension to Apache Spark API capable of handling stream processing of live or real-time data [8]. The core Apache Spark is a cluster based computing framework, designed and developed in AMPLabs at the University of California. It was later given to Apache Foundation in order to make it open source and strengthen its user and developer community. Apache Spark is a system which is capable of taking in huge amounts of data as input, loading it into its multiple cluster nodes and processing them in parallel. The data is broken down into immutable and smaller sets of data and assigned to the various nodes in the system. Each cluster node then processes only the data that has been assigned to it, thereby ensuring very fast processing using the concepts of data locality. Spark applications are executed in parallel as multiple instances of the same process working on different sets of data on each node in a cluster. Spark requires cluster managers to allocate resources or processing nodes to it. Once the nodes are allocated, the Spark engine gets access to „executors‟ on the nodes, which are processes that accept and store data for that particular node and process computations. After this, Spark engine sends the application code as a JAR or Python file to each node and finally the tasks that need to be executed. The advantage of following such a framework is that each node gets its own executor process which runs till the Spark application is alive and also runs multiple tasks using multiple threads. Also, Spark does not enforce the use of its standalone cluster manager and supports the use of cluster managers such as Mesos or YARN, which are capable of connecting to multiple applications. As long as the driver program gets access to the executors, Spark can use any of the three cluster managers [9].
7
Apache Spark programs may be written in various programming languages as it provides with APIs for Python, Java, Scala and R. Additionally, as extensions to the core Apache Spark application, SQL query execution, Hadoop Map and Reduce operations processing, machine learning, graph data processing and data stream processing are also available. Apache Spark Streaming, an extension to the Apache Spark core application, is one of the most popular data stream processing technologies till date. It has an ever growing user and developer community, with more than 400 developers from around 100 companies. 2.1.1.1 Architecture: The architecture of Spark Streaming may be describes on a high level using the following representation:
Figure 3: A diagrammatic representation of the architecture of Apache Spark Streaming. (Recreated from http://spark.apache.org/docs/latest/streaming-programming-guide.html)
Apache Spark Streaming allows the integration of various messaging and data input system such as Amazon Kinesis, Apache Flume, Apache Kafka, social media systems such as Twitter, distributed database systems such as Hadoop Distributed File System, etc. to accept input data for processing. Data once ingested into the system is processed using high level functions such as map, reduce, window and join. Lastly, the output generated can be sent to multiple data sinks as per the user requirements. For example the generated output data may be stored in distributed file systems such as HDFS or may be stored in normal database system. Apache Spark Streaming may also be configured or integrated to dashboards showing live generated output data [9].
8
Drilling down to how data is handled in Apache Spark Streaming, it can be explained using the following figure:
Figure 4: A diagrammatic representation of data is internally handled in Apache Spark Streaming. (Recreated from http://spark.apache.org/docs/latest/streaming-programming-guide.html)
Streams of data are accepted or ingested into the Apache Spark Streaming system from an external data source. These continuous streams of data are further broken down or divided into multiple sections or batches, which are then sent to the underlying Apache Spark engine. The core Apache Spark engine treats these batches of data as normal immutable data sets which need to be processed as per the application logic. The output data generated after processing are also delivered in batches. Continuous input data streams are represented as Discretised Streams or DStreams in Apache Spark Streaming. This is a high-level abstraction provided in order to represent the continuous streams received as input or the data streams generated by processing the input streams. The DStream is internally further broken down into continuous series of immutable, distributed and partitioned data sets known as Resilient Distributed Data sets or RDD [11]. Each RDD belonging to a particular DStream contains data from a certain time interval. This can be represented by the following figure:
Figure 5: A diagrammatic representation of how DStreams are broken down into Resilient Distributed Datasets. (Recreated from http://spark.apache.org/docs/latest/streamingprogramming-guide.html)
All operations defined on the Discretised Streams are replicated to be executed on all Resilient Distributed Datasets. The RDDs, being individual and unique sets of data, are processed in parallel, thereby using data parallelism to handle data processing. 2.1.1.2 Characteristics of Apache Spark Streaming:
2.1.1.2.1 Fault Tolerance: Apache Spark Streaming is able to ensure fault tolerant processing of data streams as it uses the concept of Resilient Distributed Datasets at the granular level. Resilient Distributed Datasets or RDD are immutable sets of data elements which can be recomputed and determined. Each RDD is able to remember the series of deterministic 9
operations that were performed on the input dataset to create it. Every time the RDD is re-computed, it will return back the same results without any change. However one thing that needs to be paid attention to is that the input data, being continuous streams of data, cannot be stored anywhere before processing. In such cases, there has to be a mechanism to get access to the data that was received by the worker node. To tend to such problems, Spark Streaming replicates the input data across multiple worker nodes. This ensures that if one worker node fails, then it can pull out the information from another worker node, where the received data was replicated. In any data stream processing system, there are three basic steps that the executed, that is receiving of data, processing it and finally sending the data to output system. While receiving the data from an input source, the fault tolerance semantics of the source also needs to be considered. Secondly, the receiver at the Spark Streaming side also needs to be configured as reliable or non-reliable as per the requirement. A reliable receiver will always acknowledge the receiving of a dataset from the input source. In case of any failure, the acknowledgement is not received and so the input source re-sends the data when the receiver is up and running again. In case of unreliable receivers, no acknowledgement is sent back and so in case of failures, there is no way in which the input source will have information that the data did not reach the destination. According to the requirement, Apache Spark provides the facility to configure the receiver behaviour. As far is processing of data is concerned, Spark Streaming ensures an “Exactly-once” guarantee as it uses the concept of RDD, as explained above. Lastly for sending the data to the output system, again the fault tolerance semantics of the output system needs to be considered along with Spark Streaming. Most of the output operations follow “Atleast once” semantics but it is configurable to be changed to “Exactly-once”. Spark Streaming provides with “Exactly once” guarantee for fault tolerance which ensures that there will be no data loss and duplication of processed data due to re-work.[12]
2.1.1.2.2 Throughput: Ensuring high throughput is one of the most important factors for a data stream processing technology. Apache Spark Streaming is able to withstand very high throughput as it efficiently parallelises the process of accepting data into the system. Input Discretised Streams represent the data streams being taken in as input for processing. Each Input Discretised Stream or DStream is associated with a Receiver object which has the responsibility of taking the input data in and storing it in the memory of Apache Spark. In order to ensure high throughput, Spark provides the facility of receiving multiple streams in parallel. This can be achieved if multiple receivers are created. These receivers simultaneously accept data from the input DStreams in order to maintain a high rate of data ingestion. [13]
2.1.1.2.3 Scalability: Being a cluster based framework, Apache Spark Streaming, or rather Apache Spark supports the execution of jobs in multiple nodes connected to each other. These cluster 10
nodes work in parallel in order to balance the processing load. Apache Spark is capable of dynamically increasing or decreasing the number of nodes working in parallel using Dynamic Allocation method. Depending on the status of the batch jobs, Apache Spark includes or excludes processor nodes, thereby making it highly scalable. If there is not much work to be done, that is, not many jobs left to be executed with respect to the number of executor nodes that are idle, the cluster is scaled down. This usually increases the batch processing times. Similarly if there are many jobs queuing up and the system is not being able to keep up with the data load, more nodes are initiated, thereby scaling the system up and decreasing the processing time for each batch, to manage the load on the system. This process of dynamically scaling the cluster up or down depending on the load of the system makes Apache Spark or Apache Spark Streaming a highly scalable system. In order to increase the scalability of the system further, Apache Spark Streaming has included the Elastic Scheduling feature in the latest release for Apache Spark 2.0. According to this, the system dynamically changes the processing time of jobs according to the rate at which data is ingested into the system. [14] 2.1.2
Apache Storm
Apache Storm is a free and open source distributed computing framework which can take in unbounded streams of data as input and process them in real time in order to generate the desired output without much time delay. It was originally designed and developed by Nathan Marz and his team at BackType. Later the product was acquired by Twitter and finally given to Apache Foundation to maintain and take the project forward. It was mainly developed as a product to cater to the requirements of a highly scalable system capable of real time data stream processing. [15] Being a distributed computing framework, Apache Storm has a well-defined setup which enables many processing nodes to be connected together. The Apache Storm cluster superficially resembles a Hadoop cluster but internally there are a lot of differences in the architecture and design. The main difference is that on Hadoop clusters run multiple MapReduce jobs whereas Storm runs what is called a topology. MapReduce jobs and topologies are very different in its essence, the main being that a job execution will eventually come to an end, whereas a topology will never complete execution until and unless it is killed. There are two kinds of nodes that can be found in a Storm cluster, namely the master node and the worker node. Each Storm cluster has one master node and multiple worker nodes which are connected together by a Zookeeper cluster. The master node runs a daemon called “Nimbus” which takes care of sending code to the cluster nodes, assigning tasks to the worker machines and finally monitoring the cluster for sudden failures. The worker nodes too run a daemon called “Supervisor” which is responsible for accepting assigned tasks as directed by Nimbus and executing them on one or more worker processes.
11
Figure 6: A diagrammatic representation of the components of a Storm cluster. (Recreated from http://storm.apache.org/releases/current/Tutorial.html)
Each worker process runs a subset of the main Storm topology and a live topology has multiple worker processes running across multiple machines. A Topology is the main computation graph that has to be defined before using Storm to process data streams. It is a directed acyclic graph that is defined to provide information about the logic that needs to be executed for real-time processing. Each node in a topology defines some specific execution logic and are connected together to define the complete task. The connections or references between the nodes show how data moves around in the topology. [16] Unlike Apache Spark Streaming, that executes data parallelism, Apache Storm implements task parallelism to support parallelization in data stream processing. Task parallelism is the parallel execution of the different tasks or logical processes across multiple processors or worker nodes. In Apache Storm, each worker node can have multiple executors running and each executor will be assigned a particular task defined in the topology. This could be a spout or a bolt. Furthermore, each executor can run multiple threads to bring in more parallelisation but all threads of a particular executor will run the same task. [17] 2.1.2.1 Architecture: As discussed, Apache Storm uses the concept of a topology, which defines the processing logic and flow of data to accomplish data stream processing. The basic abstraction provided by Apache Storm here is the concept of a stream, which is a continuous unbounded sequence of tuples. These can be transformed to new streams by the use of primitives. Storm defines two kinds of primitives for this purpose, namely, the “spouts” and “bolts”. The primitives define each node in the topology and have specific responsibilities defined. Spouts work as sources of data streams for Apache Storm and are capable of accepting tuples as input from external messaging and database systems such as Distributed file systems, Apache Kafka, Apache Flume etc. and ejects them into the topology as streams. Similarly, bolts are the nodes which are responsible to execute specific 12
processing logic on the data streams and produce new data streams. Bolts are capable of various kinds of data processing such as filtering tuples, perform streaming aggregations and joins, execute functions, communicate with databases, etc. A combination of spouts and bolts make a topology which needs to be submitted for execution to the Storm cluster. The edges that connect the nodes in the topology indicate the direction in which data flows. A topology defined by Storm may be represented as follows:
Figure 7: A diagrammatic representation of a topology consisting of spouts and bolts as nodes and edges connecting them together. (Recreated from http://storm.apache.org/releases/current/Tutorial.html)
2.1.2.2 Characteristics of Apache Storm:
2.1.2.2.1 Fault Tolerance: Apache Storm manages faults in various ways. Firstly, considering the daemons run in the master node and the worker nodes, namely the Nimbus and Supervisor demons, both follow the “fail-fast” technique, that is, in case of any failure or erroneous conditions, the daemons destruct themselves. The state of the master and worker nodes is maintained by the Zookeeper cluster instead of the daemons. This is the reason why in case of any failure, the Nimbus and Supervisor daemons can self-destruct. While returning to normal state, the daemons can be restarted with the help of any daemon supervision tool. Being stateless, the daemons can recover as if nothing happened before. If any of the worker processes face unexpected failure, Nimbus tries to restart it for a number of times before assigning the work to another process. If Nimbus itself becomes unresponsive, the only change that takes place s that no new worker processes are assigned jobs. However the existing worker processes keep running as they do not need any intervention from Nimbus. [18] 13
By default, Apache Storm maintains an “At-Least Once” message delivery semantic for fault tolerance. This is achieved by generating a unique identification number for each tuple. Whenever due to some failure, a tuple is not sent to a bolt for processing, the tuple ID against that particular tuple is taken note of and instructions are sent to the spout that generated the tuple to re-send it. This ensures that each tuple is delivered at least once. However it also leads to duplication of tuples, due to the fact that when the spout re-emits the tuple, it sends it to all the bolts it is connected to, thereby resulting in message duplication. [19]
2.1.2.2.2 Scalability: Apache Storm ensures the system to be highly scalable by using the services of Zookeeper server to dynamically monitor the load on the system and allocate or deallocate worker processes. Also the degree of parallelism of the topology may be changed by editing the settings. [20] 2.1.3
Apache Flink
Apache Flink is an open source computing framework which has been to handle distributed data analytics on batch and streaming data. Apache Flink at its core is a streaming dataflow engine which exhibits fault tolerance, low latency of processing and distributed processing of data streams [21]. It was designed and developed as an academic project named Stratosphere, before being acquired by Apache Software Foundation and renamed as Flink. [22] Apache Flink, contrary to, Apache Spark Streaming builds batch processing on stream processing engine and is supported by an iteration support, program optimization techniques and memory management [21]. It has been developed in Java and Scala and provides development API in Java as well as Scala. These dataflow programs are automatically compiled and optimized which are executed in a cluster or cloud environment. Apache Flink works in unison with a number of data input systems such as Apache Kafka, distributed database systems, etc. [23] Apache Flink brings together multiple APIs in order to execute all required applications, such as, DataStream API to allow users to program transformations and define processing logic on streaming data using Java and Scala, DataSet API to define programming logic on static data using Java, Scala and Python and Table API, which allows programmers to define SQL like queries embedded in Java and Scala. Moreover, Apache Flink also brings in various libraries to support the core framework, such as, CEP or a complex event processing library, Machine Learning library and Gelly, a graph processing library and API. [21] 2.1.3.1 Architecture: Apache Flink has a layered architecture, where each layer builds on top of the other, increasing the level of abstraction of the application. The layers of Apache Flink are as follows:
14
The Runtime layer is responsible for receiving a program called a JobGraph which is a parallel data flow with tasks defined that take in data streams as input and generates transformed data streams as output.
The DataStream and DataSet API sit on top of the Runtime layer and both generate JobGraphs through their compilation processes. The DataSet API uses an optimiser to generate a plan that is optimal for the program while the DataStream API uses stream builder.
The JobGraph is deployed and executed in a variety of options available such as local, remote cloud or in cluster using YARN, etc. This layer lies under the Runtime layer.
The topmost layer consists of various APIs and libraries that are combined together in Apache Flink to generate DataStream and DataSet API programs. The various libraries and APIs available for DataStream API are the complex event processing library and the Relational Table and SQL API. Similarly the DataSet API supports FlinkML for Machine Learning extension, Gelly for graph processing and Relational Table and SQL API. [25]
The component stack described above can be represented as follows:
Figure 8: A diagrammatic representation of Apache Flink Component Stack. (Recreated from https://ci.apache.org/projects/flink/flink-docs-release-1.1/)
When an Apache Flink system is initiated, it creates one JobManager instance and one or more TaskManager instances. The JobManager is the driver and co-ordinator of the Flink application [26]. To make the system highly available, multiple JobManagers may be instantiated, out of which one is elected as the leader and the others remain standby. JobManagers have the responsibility of scheduling tasks and co-ordinating 15
monitoring and failure recoveries. On the other hand, TaskManagers are the worker processes which execute the assigned parts of the parallel programs thereby buffering and exchanging the data streams. When a Flink application is submitted for execution, a client program is created that performs all the pre-processing required to change the program into parallel data flow logic. This is then executed by the JobManager and the TaskManagers. The client is not a part of the execution process. After the client has created the dataflow and sent it to the Master process, it may disconnect or stay alive to receive reports about the execution progress. [27] Apache Flink streaming programs use the concept of “streams” and “transformations”. Streams are an intermediate data result whereas transformations are operations which take in one or more data streams as input and produce one or more output streams. Normally each transformation is associated with one operation but in special cases it may be associated with multiple. While executing a program, it is first mapped to a streaming dataflow which consists of several streams and transformation operators. Each streaming dataflow are connected to one or more sources and sinks. The dataflows resemble the concept of Directed Acyclic graphs. [28] Programs or streaming dataflows are by default parallel and distributed in Apache Flink. Streams are sub-divided into stream partitions and operators are sub-divided into operator sub-tasks. These sub-tasks are executed in parallel in multiple threads running on multiple machines. [29] 2.1.3.2 Characteristics of Apache Flink:
2.1.3.2.1 Fault Tolerance: While many transformations or operations only concentrate on the current work or event at hand, some operations required to remember information across multiple events. Such operations are said to be stateful. The state of these operators are maintained as key value pairs and sent to the operator along with the data streams in a distributed manner. So access to the key-value state is only possible on keyed streams. Aligning the state along with the current key-value stream ensures that all state operations are local operations, thereby guaranteeing that the transactions are consistent without much overhead. Apache Flink uses a combination of stream replay and checkpoints in order to ensure fault tolerance. Checkpoints are specific points in streams and state from which the streaming dataflow can be re-read or resumed to maintain consistency. The fault tolerance mechanism of Apache Flink keeps on saving snapshots of the current state in specific intervals. In case of a machine, software or network failure, Apache Flink stops the execution of the application and restarts the operators to work from the latest successful checkpoint. The input streams are also reset. This is how Apache Flink guarantees “Exactly-once” semantic. By default Apache Flink guarantees “Exactly-once” semantic but it may be configured to make it work to provide “At-Least once” delivery. [30]
16
2.1.4
Amazon Kinesis
Amazon Kinesis Streams is a framework under Amazon Web Services that has been designed and developed to take in process streaming data in real time in order to generate the required output with minimal time delay. It can be used to build customised applications and execute it to generate the desired data or gain business intelligence. Amazon Kinesis Stream has a well-defined library consisting of functions known as Amazon Kinesis client library which can be used for this purpose. The processing technology is able to take in input data streams from a range of data sources in order to process the data and the processed data streams generated can then be sent to storage systems or dashboards. Amazon Kinesis Streams seamlessly integrates with other Amazon web services such as Amazon S3, Amazon Redshift, etc., to transfer data. [31] 2.1.4.1 Architecture: Amazon Kinesis Streams can be divided into distinct function units, namely, the Producer and the Consumer. The producer has the responsibility of taking in input data streams from various data input systems and continuously injecting or pushing in data streams into the framework, whereas the work of the Consumer is to accept the streams of data and process them in order to generate real-time output data. These output data streams are then stored or passed on to a range of other Amazon Web Service products such as Amazon Redshift, Amazon DynamoDB, etc. [32]
Figure 9: A diagrammatic representation of the architecture of Amazon Kinesis. (Image taken from http://docs.aws.amazon.com/kinesis/latest/dev/key-concepts.html)
Producers inject a continuous stream of input data into the system. These streams are further divided into one or more uniquely recognised sets of data records called data shards, which have a fixed capacity. A data record is the basic unit of data that can be accepted into Amazon Kinesis Streams. Each data record is given a unique sequence number by Streams, a partition key which is a combination of Unicode characters which could go up to a maximum size of 256 bytes, and lastly, the actual data blob 17
which is an immutable data set of size up to 1 MB. The partition key is used to decide which shard will be used to push the data record into the system. The data shards are of fixed capacity which means that the total data capacity of the streams at a particular time is directly proportional to the number of data shards present. Hence more the number of data shards created for an application, higher is the throughput recorded [33]. The producer initiates the process by accepting data records from external data source and injecting them into Streams system. For each record, the stream it will be sent to, a unique partition key and the actual data blob will be assigned. The partition key will be further used to find out the particular shard that the data record will be sent to. When a shard completely gets filled with data records and the full capacity has been exhausted, all its contents are sent to a particular worker node or consumer for processing [34]. One thing that has to be noted here while configuring Amazon Kinesis Streams is that the range of numbers used to generate partition keys should exceed the total number of shards present in the system. If not then the data records will have a tendency to map to only a limited number of shards thereby resulting in uneven distribution of the data records among the shards. The consumer has the responsibility of reading data records from a shard and processing them. Each consumer is associated with one shard and accesses the data records in that shard using the shard iterator. The shard iterator specifies the range of data records that the consumer will read from that particular shard [35]. The consumers can be associated with multiple Amazon EC2 instances to process the data. If the information of this integration is maintained in the Auto-scaling group then the system automatically uses this to make the system highly scalable. Based on the data load at a particular time on the system, EC2 instances are initiated or stopped. Also when any EC2 instance or instances fail, the same information is used to assign another instance to complete its work load. Auto-scaling ensures that at a particular point of time, a fixed number of EC2 instances are up and ready irrespective of the data load. 2.1.4.2 Characteristics of Amazon Kinesis Streams:
2.1.4.2.1 Fault Tolerance: Amazon Kinesis Streams ensure fault tolerant systems by maintaining the state of the current processing and the streaming data. This state is maintained across three different facilities in an Amazon Web Service area. The copies are kept available as back up for the next seven days. In case of any failures related to system, application or machine, the data can be successfully pulled out from back up in order to process it again to generate desired results. [31]
2.1.4.2.2 Scalability: Amazon Kinesis Streams works toward providing high scalability to all applications. This is done by connecting the consumers present to the multiple EC2 instances 18
running and their references maintained in the Auto-Scaling group. This allows the system to keep a track as to when the system needs a scaling up or down according to the load of data being injected into the system.
2.1.4.2.3 Throughput: Amazon Kinesis Streams ensures high throughput for applications by allowing users to control the number of shards defined in the system. Increasing the number of shards connected to the data streams will result in a higher rate of ingestion of data into the system. 2.1.5
Google Data Flow
Google Dataflow is a data stream processing technology designed and developed by Google. It aims at providing very high scalability and the capability of processing massive amounts of data streams and generating desired output in real time. Google dataflow focuses on performing complex processing on huge amounts of data which can be much more than the memory capacity of a large clustered or distributed system. Google Dataflow manages such huge data load by providing complex but abstracted logic for breaking down the data streams into small sets and processing them in parallel. Moreover, it enables and supports Extract, Transform and Load activities for extracting data from one data storage and storing it in another in a new format or structure. [36] It consists of two main components which provide support for data processing: 2.1.5.1 Dataflow SDKs: The Software Development kit or SDK is required to define and develop programs for data processing. This kit very efficiently handles the task of dividing the data into smaller sets to be processed in parallel by all the worker nodes connected in the distributed network. The Dataflow SDK consists of APIs created to interact and integrate various data storage systems, formats and services. Each data processing job is conceptualised as a pipeline which is an object which takes in data sets as input, processes them or works on it to create output data sets. Various methods for transformations and defining data types are available as abstractions in the development kit. Recently, Google Dataflow SDK has been added as a project under Apache Foundation named Apache Beam. It is currently in the incubator stage. Although the transition process has already started, Google Dataflow still is a Google owned product. 2.1.5.2 Google cloud platform managed services: Google Dataflow is integrated with the various other Google managed services available using the cloud network. This makes the data processing technology to be very strong and efficient to handle multiple use requirements. Services such as Google 19
Cloud Storage, Google Compute Engine and BigQuery are integrated with Google Dataflow. Various tasks such as optimising interactions and performances and distributing the input data among the nodes and parallelization of the work are handled by the technology in order to seamlessly integrate the different services. 2.1.5.3 Architecture: The architecture that Google Dataflow is built on can be described using the following representation:
Figure 10: A diagrammatic representation of the architecture of Google DataFlow. (Image taken from http://dataconomy.com/google-cloud-dataflow/)
Google Dataflow comprises three main components in the system. These are the data input and streaming component, the module responsible to carry out all processing and transformations and finally the data ejection or generation component. Google Dataflow uses the facility to work in unison with other Google services and manages to quickly accept streaming data into the system and send them to the various modes for parallel processing. All these activities are abstracted in way that the user does not have to put in much effort to design and develop a customised application. Various processing transformations and modules are available to be used on the data. Finally the processed data, that is, the output data sets are stored in various data output systems such as distributed database systems or other integrated services provided by Google. [37]
20
2.1.5.4 Characteristics of Google Dataflow:
2.1.5.4.1 Fault Tolerance: In case of any error or failure in data processing, the pipeline, which is the abstraction provided by Google Dataflow to represent the processing jobs, throws error messages and then retries processing the data up to a maximum of four tries. If the bundle of data fails to process correctly for all the four times, the pipeline fails and stops its execution. [38] However, for data stream processing, Google Dataflow is configured to re-process a data bundle unlimited number of times, in case of failure. Dataflow maintains logs for each node and for each processing job. In an event of failure, the log is accessed and referenced to re-send the information about data delivery and the state of the node. This mechanism ensures that Google Dataflow by default provides with “Exactly-Once” semantic for fault tolerance. [39]
2.1.5.4.2 Scalability: Google Dataflow is a highly scalable system and is able to dynamically increase or decrease the number of machines connected to Google Dataflow distributed framework depending on the total data load on the system.
2.1.5.4.3 Latency: Google Dataflow, similar to Apache Storm, defines Directed Acyclic Graphs to specify the processing flow of data streams. These graphs, once deployed and started to execute, do not stop until there is a need to descale the system. Google Dataflow uses the concept of extreme parallelization of tasks in order to keep the latency very low. [39]
2.2
Choosing appropriate candidates
This section describes how a comparative and critical comparison was done among the various Data Stream Processing Technologies in order to focus in and select two of them to carry out the evaluation. To do this, all the data stream processing technologies were first studied in detail. This exercise helped in understanding the architecture of each technology and how the differences among the technologies affect the execution of data stream processing. Also factors such as user community size, popularity of usage as a product, cost issues were considered in order to reach a decision. All the data stream processing technologies considered for this study are distributed or cluster based systems, ensuring that there is parallel execution of work. Secondly all of them can be integrated with multiple data systems, both for taking input or generating output. Thirdly all of them are capable enough to handle large data sets continuously entering the system, processing them with low latency and then generating the output in real time. The evaluation work planned was to drill down more into two of these 21
technologies and find out which one provides with better performance in specific network, software and hardware conditions. One of the major factors that impacted the decision was to select technologies which were free and open source. Google Dataflow and Amazon Kinesis are both available at a particular charge and so were difficult to be considered as good candidates for this evaluation project. Google Dataflow offered a 60 day free trial period for using all products under the cloud platform, but it was estimated using the Google Cloud Platform Pricing Calculator that the charge for using Google Dataflow for a month is around $370. This was recognised as a hindrance as it was not considered a wise idea to plan for the project keeping in mind that there would be no access to the system after the 60 day trial period ends. Similarly, Amazon Kinesis, though being a strong data stream processing candidate, is not included in the Amazon Web Services free tier and is available for use only for a specific charge. The other three technologies, namely, Apache Spark Streaming, Apache Storm and Apache Flink, are all under Apache Foundation. These technologies are all free and open source. Apache Flink is a strong upcoming technology for data stream processing but is yet to put through various tests for its processing capabilities [22]. Also Apache Spark Streaming and Apache Storm have a wider user community and are more popular as technologies implemented to handle data stream processing in various business and technology companies. Apache Spark Streaming has been successfully implemented and used in companies such as Uber, Pinterest and Conviva among many others [40]. It has a lot of popularity these days in the user and development community. Similarly, Apache Storm is another technology quickly gaining a lot of focus. Apache Storm is successfully implemented and used in Yahoo since 2012. Apache Storm is also used in Groupon, Twitter, Spotify, Yelp, etc. Based on the above findings, Apache Spark Streaming and Apache Storm were selected as the two most suitable candidates to go ahead with the evaluation test execution.
2.3
Benchmarking Data Stream Processing Technologies
This section discusses in detail the different benchmarks that were analysed in order to select a suitable benchmark test for this project. With the increasing demand and focus of fast and accurate data stream processing technologies, there is a lot of interest in developers and users to find out which technology may better handle the requirements of a data stream processing technology, such as, high throughput, low latency, high scalability, good fault tolerance mechanism among others. Due to this there have been a few benchmarks designed and developed by specific academic or business groups. A few of them were considered for this project. The first benchmark that was looked into was one developed and implemented for a telecommunication organisation by SQLstream. The business requirement was to prevent dropped calls on a wireless 4G network by recognising patterns that impact the service of calls and network and to improve the quality of calls by enabling real-time 22
corrective actions. There was an existing in-house application that the organisation was already using but wanted to use the benefits of a data stream processing system in order to improve performance, save time and manage cost issues. SQLstream performed a market evaluation for the organisation and zeroed in on SQLstream Blaze and Apache Storm as two suitable candidates. A benchmark test was then implemented and results were noted for that organisation. [42] Although the evaluation was well defined and explained in the report, there was no access or mention about the data format and data set used as this evaluation was developed for a private organisation. Moreover, this benchmark test evaluated a technology that was not selected as one of the suitable candidates. Hence access to the source code was mandatory to replicate the exact test for Apache Spark Streaming. Hence this benchmark was not considered suitable for this project. The next benchmark that was reviewed in detail was an evaluation of data stream processing technologies performed for data driven applications. The evaluation research was conducted by Jonathan Samosir, Maria Indrawan-Santiago and Pari Delir Haghighi, belonging to the faculty of IT at the Monash University, Australia. A detailed evaluation was performed on Apache Spark Streaming, Apache Storm and Apache Samza using quantitative as well as qualitative methods of testing. The data for the evaluation test was acquired from Monash Institute of Railway Technology. Although the data set was a static one, this evaluation simulated data streams out of it using the services of Netcat. The data records were replicated for a number of times to create bigger data sets. [43] This benchmark test was clearly explained and both quantitative and qualitative evaluations were considered. However there was no access to the data and the source code in order to implement the benchmark for this project. Another benchmark reviewed was designed and developed by Yahoo!. This was created in order to evaluate Apache Spark Streaming, Apache Storm and Apache Flink against a scenario which was designed to emulate a real world problem. The processing logic comprised an advertisement event count per campaign. It included reading data tuples from Apache Kafka sent in JSON format. These tuples are read, parsed and filtered before calculating a windowed count of the number of advertising events per campaign. The data intermediately and finally are stored in an in-memory data storage system called Redis. The benchmark aims at studying how the processing times change with respect to the throughput and what latency is recorded for each data stream processing technology. [44] This benchmark looked very promising as firstly it was designed and developed by engineers at Yahoo! which has been using data stream processing technologies to process their data for years now. Secondly Yahoo! attempted to create a real world scenario with data being pushed into a database and accessed whenever required. Lastly, this benchmark gave full access to their source code which helped in the basic understanding the origin and flow of data. Due to these factors, this particular benchmark was selected to be implemented and executed.
23
As this benchmark uses Apache Kafka and Redis as the data ingestion and the data storage systems respectively, the following are discussed in details. 2.3.1
Apache Kafka
Apache Kafka is an open source distributed messaging system which has been designed to be fast, durable and scalable. Essentially it has been designed to follow a publishsubscribe messaging pattern, where the message senders or the „producers‟ do not send the messages directly to receivers. Instead, they just categorize messages into different classes. The receivers or the „consumers‟, on the other hand, receive messages by registering interest to a particular message class or classes. The whole process of sending and receiving messages is executed without the sender having any knowledge of the receiver and vice versa. [45] 2.3.1.1 Architecture Apache Kafka works as a cluster which connects multiple producers and consumers to one or more servers known as brokers. This architecture may be represented as follows:
Figure 11: A diagrammatic representation of the architecture of Apache Kafka. (Recreated from http://kafka.apache.org/documentation.html#introduction)
The producers send the messages to the Kafka cluster where they are stored in different categories. The Kafka cluster in turn has the responsibility of serving these messages to the consumers In order to understand the design and architecture of Apache Kafka, it is important to be familiar with the following terminologies:
2.3.1.1.1 Topic: A Kafka topic is a category or name given to the set of messages being published. It is a high level abstraction that Apache Kafka provides to work in sync with the publishsubscribe messaging pattern. Each topic is further broken down into partitions containing sequence of messages. These sequences cannot be manipulated. The
24
messages in each partition are assigned a unique sequential number known as offset for identification.
Figure 12: A diagrammatic representation of partitions with ordered messages in a Kafka topic.
Messages saved in each partition are also continuously appended to a log file. Through this facility Kafka is able to retain messages for a considerable period of time. It is possible to set the maximum amount of time for which the messages will be available for consumption. For example, if Kafka is configured to retain messages till 4 days, then each message will be available for consumption till 4 days from its creation, after which it would be deleted to free up space.[46]
2.3.1.1.2 Producers: Producers are the programs which publish data to the partitions in a topic. It is responsible of deciding which message to be sent to which partition in the topic. Different algorithms may be used for this as per requirement. For example, the producers may follow the round robin method to balance the load of messages in each partition or may execute some algorithm which takes some key from the message itself and uses it to zero in on the partition.[47]
2.3.1.1.3 Consumers: Consumers are the programs responsible for receiving the published messages from the partitions and processing them. There are two different messaging patterns used by the various message oriented middleware systems, namely, the Queuing pattern and the Publish-Subscribe pattern. For message queuing, consumers may read from a particular server and each message goes to one of the consumers from the pool. On the other hand, the publish-subscribe pattern lets the servers broadcast the messages to all consumers before being received 25
by just one from the pool. Apache Kafka mixes both the concepts and brings in an extra layer of abstraction by logically grouping consumer instances into consumer groups. Each server broadcasts the messages to all consumer groups, thereby following the publish-subscribe messaging pattern. However a message at a particular instance is taken up by just one consumer instance in a particular consumer group, thereby internally using message queuing system to decide which consumer instance will work on which message. If all consumer instances are tagged to the same consumer group, then it works like a traditional message queuing system. Similarly, if each consumer instance belongs to a different consumer group, then it behaves as a publish-subscribe messaging system.
Figure 13: A diagrammatic representation of how Apache Kafka uses the concepts of both message queue and publish-subscribe messaging pattern. (Recreated from http://kafka.apache.org/documentation.html#introduction)
Apache Kafka ensures a better ordering of messages than a traditional message system. In a traditional message system, the server maintains the messages in order. However when multiple consumers feed on the messages from the same server, the messages are asynchronously delivered to the consumers to ensure parallelism. So although the server sends the messages in order of their storage, it may so happen that the messages are out of order when received by the consumers. In order to force the messages to be fed to the consumers in order, messaging systems bring in the concept of selecting an “exclusive consumer”. This ensures that only one consumer instance will feed on messages from a particular queue, thereby compromising on parallelism. Kafka solves this issue by using the concept of partitions. The messages are stored in multiple queues or partitions instead of just one. These partitions are assigned to consumer instances in such a way that each consumer instance is allotted to feed messages from a single partition, thereby ensuring the maintenance of message 26
ordering during consumption. Also, as there are multiple partitions, Kafka is able to ensure parallel processing of messages and load balancing over multiple consumer instances. It should be noted that Kafka only ensures message ordering for consumption within a partition and not between different partitions in a topic. If a total ordering of messages is required, then all messages have to be stored in a single partition. [48] Apache Kafka, being a distributed messaging system, allows partitions in the message logs to be distributed over the servers in the cluster. This is done in such a way that each server takes responsibility of a share of partitions. Also while replicating the partitions in the servers or brokers, it is ensured that each partition data is available to more than one servers. This helps in tolerating faults as if one message gets lost from a particular partition in a server, then it can be replicated from another server. Each partition is allocated a “leader” server, which handles all the read and write operations for it. The other servers which also have the data for that partition act as “followers” and passively replicate the status of the leader. In case the leader server fails, one of the followers is elected as the leader and from then it takes the responsibility of all read and write operations for that partition. Each server acts as the leader for a few of its allotted partitions and followers for the rest. This mechanism helps in balancing the load properly across the system. [49] Apache Kafka is designed to provide with the following guarantees: 3
The messages in a partition will be stored in the same order in which the producer sends to it.
4
The consumer instances will be feed on messages from a partition in the same order in which it is maintained.
5
For a topic with replication factor N, Apache Kafka is capable of handling N-1 failures without losing any messages that has been committed and stored in the partition log. [50]
5.1.1.1 Characteristics of Apache Kafka:
5.1.1.1.1 Fault Tolerance: As mentioned above, Apache Kafka is a fault tolerant system as it assigns the messages in a particular partition log to several brokers or servers out of which one is selected as the leader and the others remain as followers who passively copy the state of the leader. The leader has the main responsibility of carrying out the reading and writing of the messages. If the leader fails, one of the followers takes its place and keeps on carrying out the operations. In order to understand how Apache Kafka handles message delivery faults, it is important to break it down into two problems: the guarantee provided while publishing the message and while consuming the message. 27
Concentrating on how a producer handles message delivery faults, Apache Kafka allows different configurations to be set to get the required level of accuracy. Producers keep a check on messages which failed to deliver by assigning a “primary key” to each message. If a producer sends a message to the broker but no confirmation is sent back due to a network failure, then it keeps on sending the message with the assigned primary key until a confirmation is sent back to the producer. As for how a consumer handles faults in message delivery, here too Apache Kafka allows different configurations to be set as per the requirement of fault tolerance. By default consumers read a message, process it and finally save its position in a log file. If at any point of time, the consumer fails before it saves its position in the log file; the new process that takes up the work will read and process the message again. This is how Apache Kafka guarantees an “At-least-once” delivery by default. However it is possible to change this to “At-most-once” delivery by restricting the producers to resend messages in case of no confirmation from the broker and configuring the consumer to save its position in the log file before processing the message. Configuring it to work to guarantee “Exactly-once” delivery needs co-operation from the destination system and so makes it a little difficult to implement than the other two. Also the consumers need to also save whether the message has been processed or not in the log file along with the position of the message.[51]
5.1.1.1.2 Throughput: Throughput is the rate at which data is introduced into a system. For a messaging system which is used to ingest data into data stream processing technologies, it is important for it to be able to handle very high throughputs. Apache Kafka ensures very high throughput by allowing multiple producers to work in parallel to publish messages in multiple partitions. This kind of parallelization helps Apache Kafka to easily manage huge loads of data. Also multiple consumers working in parallel make sure that the load is balanced. Also Kafka servers or brokers are designed to handle hundreds of megabytes of message reads and writes per second from thousands of clients, thereby being able to handle very high throughput.
5.1.1.1.3 Scalability: Apache Kafka is highly scalable and allows cluster to elastically and dynamically increase its size as per the load of the data being ingested into the system. This does not require any downtime or does not result in any slowness in data publishing and subscribing. Data is partitioned and spread over multiple processors or machines working in parallel which enables the system to handle data load which is impossible to be processed by a single machine.
28
2.3.2
Redis
Redis Database System is an open source in-memory data store. In-memory database or Main memory database systems use main memory to store and fetch data. This is to ensure faster response time. The data required to be stored is compressed to a large extent and loaded into main memory in a non-relational format. [53] Redis is very efficient in streamlining the work that is required to be done while processing queries in order to fetch data. This is the reason why Redis is a preferred choice for a database to be used for real-time data processing which requires storing and fetching data from data stores to be very fast. Redis supports the use and handling of various data structures such as lists, sets, strings, sets, hashes, bitmaps, etc. These data structures can be created, stored and fetched using simple queries. [54] Redis being an in-memory data store, it is very essential for it to apply algorithms and techniques to employ better use of the main memory. As in-memory databases do not have the facility to have ample storage, it is mandatory to apply certain eviction policies to manage the use of the main memory. Redis allows many configuration options for this purpose. One of the options popularly used is the Least Recently Used eviction policy. When there is a query to be processed, Redis checks whether the amount of data generated for this query is greater than the maximum memory space available. If so, it follows the configurations set to apply the particular eviction policy and free up space from main memory for new data. [55] 2.3.2.1 Characteristics of Redis:
2.3.2.1.1 Scalability: To ensure high availability, Redis has a built-in replication logic in which several slave servers maintain the state of the master server. One master server may have one or many slave servers which are able to replicate the master asynchronously. This reduces the overhead required to divert the attention of the master server for synchronous replications. However each slave server acknowledges the amount of data it has replicated from the stream from time to time. To reduce the number of connections made by the slave servers to the master server, the slave servers follow a cascade-like network structure and connect to other slave servers in order to replicate data. Replication in Redis is non-blocking for both master and slave servers. This means that the master server keeps on executing queries while one or more slave servers are performing the initial synchronization with it. The slave servers too are capable of handling queries when they are synchronizing their data. This is done by using the old version of the dataset, provided that Redis has been configured to do so. However, after the initial synchronization, the slave server should update the old records of the data sets and during this time it should restrict itself from entertaining any new connections. This replication facility available in Redis makes it a highly scalable database system as the slave server may be used to handle complex and slow queries while the master server is busy. [56]
29
2.3.2.1.2 High Availability: Redis Sentinel is a distributed system which may be configured to work alongside Redis to provide fault tolerance capabilities to it. Multiple Redis Sentinel processes run in parallel to constantly monitor whether the master and the slave servers are up and running as expected. In case of a failure being detected in the master server, Redis Sentinel appoints one of the slave servers to become the master and reconfigures all the slave servers to follow the new master. In addition to this, it also informs the applications using Redis about the address of the new master server. The distributed nature of Redis Sentinel ensures that Redis is highly available even if one or few of the Sentinel servers are not working. [57]
30
Chapter 3 Benchmark for Evaluation In order to evaluate Apache Spark Streaming and Apache Storm as data stream processing technologies, a good benchmark based on a scenario similar to real-time problems was required. As explained in Section 2.3, few of the available benchmarks for evaluating data stream processing technologies were looked at in detail and after critical analysis; the benchmark developed by Yahoo! was selected. Yahoo! is one of the largest multinational technology company providing valuable services to customers such as Yahoo! Search, Yahoo! Mail, Yahoo! News and many other advertising, video sharing and social media portals. It has a huge customer base and most of its services encounter very large number of views and access by its customers. Due to this, it is essential for Yahoo! to process huge amounts of data generated in real-time. Yahoo! has been using the services of open source Data Stream Processing technologies for a considerable period of time to support their business. Yahoo! initially had internally developed a platform called S4 before moving on to using the services of Apache Storm in 2012. Since then Yahoo! has been using Apache Storm extensively and presently the number of nodes running Storm for Yahoo! has reached around 2300. [44] Yahoo! planned and developed the benchmark test in order to evaluate the various other data stream processing technologies available as open source for a real world scenario or problem. The test was initially developed to assess Apache Spark Streaming, Apache Storm and Apache Flink, but due to the way it has been designed, the same test can be further extended to be used on the other available technologies.
3.1 The Benchmark Functional Design The benchmark test has been designed to work as a simple advertising application. There are a number of advertising campaigns and a number of advertisements per campaign. These advertisements are published in various online websites and other web and mobile applications. Users accessing these applications or websites might choose to take some actions on these advertisements such as viewing the details or purchasing the item, etc. These actions are divided into specific categories. Whenever a user takes an action on any of the advertisements, it is considered as an event generated. The function 31
of the application is to accept these events in real time and count the number of advertisements per campaign for which some specific events were generated at a particular time interval. The details of the campaigns, its advertisements, the events performed, the time at which the event was generated and all other related data are specified in the input document which is continuously fed into the system as JSON events by Apache Kafka. The benchmark test accepts the various JSON events, filters out the irrelevant ones and finally calculates a windowed count of the events for each campaign generated at a particular time. These counts are continuously updated in the Redis data store.
Figure 14: A diagrammatic representation of the sequential individual steps executed in the benchmark test. (Recreated from https://yahooeng.tumblr.com/post/135321837876/benchmarkingstreaming-computation-engines-at/)
The individual steps executed by the test are as follows: 1) A JSON event is accepted or ingested from Apache Kafka. 2) The JSON event received as a string is then de-serialized as a JSON object. 3) The irrelevant events based on a particular criterion are filtered out. 4) The relevant and required fields from the JSON object are extracted. 5) For each event the advertisements related to a particular campaign is updated in Redis. 6) The number of advertisements for each campaign generated within a specified time span is counted together and the results are updated in Redis along with the time stamp which indicates the time at which Redis has been last updated. [44] 32
3.2 The Benchmark Technical Design The technical design for the benchmark test has been well thought and implemented. It has been designed in such a way that there is only one control script which can be used to navigate through the different stages of executing the benchmark test. The control script is a simple bash script which when executed with different parameters, calls different processes to be executed. It handles the tasks described in the following subsections. 3.2.1 Installation of all the required technologies If the bash script is executed with the parameter „SETUP‟, it downloads and installs all the required technologies. The versions of the technologies which need to be loaded have to be correctly specified in the bash script. These details are maintained in variables which are used at runtime to install the particular version of the technology. This makes the code re-usable when newer versions of the technologies are available.
Figure 15: A representation of how the control bash script is executed to install the technologies for benchmarking.
The script when run, firstly acquires the closest Apache mirror to download the Apache technologies. Using the directory names and the version numbers stored as variables in the script, it downloads all the required zipped files using “wget” or “curl” and saves the zipped folders in a particular directory for future re-installations. 3.2.2 Executing the tests This benchmark test was developed to compare and evaluate three different data stream processing technologies, namely, Apache Spark Streaming, Apache Storm and Apache Flink. Hence the bash script enables the user to run tests for each of these technologies. Running the script with different parameters execute the benchmark for the different technologies. For example, if the script is run with parameter “SPARK_TEST”, the evaluation test is executed for Apache Spark Streaming. Similarly, with parameter “STORM_TEST”, the test executes for Apache Storm.
Figure 16: A representation of how the control bash script is executed to run the evaluation test for Apache Spark Streaming.
Each of these tests executes multiple steps in the order as described below: 1) The Zookeeper server is started first. Zookeeper needs to be instantiated before the Kafka server as it works in unison with Apache Kafka to manage activities such as electing a leader server for Kafka brokers, configuring the Kafka topics and maintaining the information about consumer-partition mapping, etc. 33
2) The Redis server is instantiated in order to ensure that it is running before Kafka starts updating or querying anything from it. 3) The Apache Kafka server is instantiated and if the Kafka topic does not already exist, it is created with the number of partitions required as mentioned in the corresponding variable. 4) The data stream processing technology is initialised and started. For Apache Storm, this includes starting the Nimbus and Supervisor daemons, instantiating Storm UI and logviewer. Similarly for Apache Spark Streaming, this command starts the Spark Master and Worker processes. 5) The topology is defined for Apache Storm. This step is not required for Apache Spark Streaming. 6) The input data is created as a JSON documents and then passed on to Apache Kafka which creates streaming events out of it. These events are continuously fed into the data stream processing technology. 7) The actual processing task is executed on the data events and finally the count of all advertisements related to a campaign and generated in a particular time span is calculated and stored in Redis along with the time at which the update is being made. 8) Processing of continuously generating input data goes on for a particular amount of time specified by the user in a variable, before stopping Apache Kafka to emit any more events as input. 9) The topology running for Apache Storm is killed. This step is not required for Apache Spark Streaming. 10) The data stream processing technology process is stopped. This includes killing the Master and Worker processes for Apache Spark Streaming and Nimbus, Supervisor, Storm UI and logviewer processes for Apache Storm. 11) The Apache Kafka server is stopped. 12) The Redis server is stopped. 13) The Zookeeper server is stopped. All the steps mentioned above are coded in such a way that the operations may be reused for each data stream processing technology. [58] 3.2.3 Stopping execution of test The control script provides with the facility to kill all processes and hence stop the execution of the test in case of any undesired event. Normally the test execution is automatically stopped when the processing has run for the amount of time as specified by the user. In case of any anomalies, the processing can be forced to stop. This is done by executing the control script using the “STOP_ALL” parameter. All the server 34
instances and processes are stopped one by one following the order as mentioned in 3.2.2.
3.3 The Input Data For all data stream processing technologies evaluated here, the format and process of generating and feeding the input data to the stream processing program remains the same. The schema of the input data for this benchmark test is as follows: 1) User ID: This specifies a unique number related to the user performing the event. It comprises random numbers generated from the range of 1 to 100. 2) Page ID: This corresponds to a unique number given to the online website or application accessed by the user. This too comprises random numbers generated form the range 1 to 100. 3) Ad ID: This is the advertisement on which the user has performed an event on. This comprises random numbers generated from the range 1 to 1000. 4) Ad Type: This corresponds to specifying the type of advertisement. It is a string field which is randomly chosen from a finite list of advertisement types. The values which this field may attain are “banner”, “modal”, “sponsored-search”, “mail” and “mobile”. 5) Event Type: This corresponds to the actual event that the user has performed on the advertisement. It is represented as a string field which is randomly chosen from a finite list of event types. The values which this field may attain are “view”, “click” and “purchase”. 6) Event Time: This is the time at which the event is performed and is stored in milliseconds. 7) IP address: This variable is not actually put into use but is filled in as “1.2.3.4” for each input event. When the bash script is executed to run one of the evaluation tests, firstly random campaign IDs ranging from 1 to 100 are generated and stored in Redis for future reference. Then the advertisement IDs are created as random numbers ranging from 1 to 1000. For each campaign, ten advertisement IDs are allotted and this campaign to advertisement mapping is stored in Redis. Also random numbers for user ID and page ID are created. After all the IDs have been generated, the event time for each input document is calculated. This corresponds to the time at which the input event will be emitted by Kafka for processing. In order to calculate this, firstly the current system time is recorded. Then based on the throughput value set by the user, the fraction of a second is calculated at which each tuple has to be generated in order to be able to emit all the tuples in a second. This fraction is practically 1 second divided by the throughput value.
35
This fraction is incrementally added to the current time in order to get the event time for each tuple in a second. Now for the total number of event times calculated, random selections from corresponding ranges are for campaign, advertisement, user, page, advertisement type and event type are made and arranged to make a single input document and is passed on to the Apache Kafka system for emission. [59]
3.4 The Benchmark Processing logic This section discusses the actual processing logic that is executed for the data stream processing technologies. In the previous section, the format of the input JSON strings was discussed and a detailed explanation as to how the data is prepared and sent to Apache Kafka for emission was given. After this, the actual processing logic gets executed in multiple parallel jobs. The logic has been individually developed for each processing technology as the way in which the two technologies define the logic and handle data is different. Below is a detailed explanation of how the processing logic is defined for each technology. 3.4.1 Apache Spark Streaming The processing logic for Apache Spark Streaming has been developed in Scala. Firstly all the relevant parameter values required to run Apache Spark Streaming are accessed from the YAML configuration file. The parameters include batch duration, Kafka and Redis IP addresses and port numbers, Kafka topic name, etc. The StreamingContext object which is the main entry point for accessing Spark Streaming functionality is created using the batch duration value from the configuration file. Similarly connections to Kafka and Redis are established using the IP addresses and port numbers.
Figure 17: A source code screen shot of how the configuration YAML file is accessed by Apache Spark Streaming in order to fetch configuration parameter values.
All data records processed in a job are first parsed as JSON strings and stored in an array. Next, all records with event type set to “view” are eliminated from the data set and then only the advertisement ID and the event time are extracted and stored in another array. A connection is then established with Redis and the Campaign ID to Advertisement ID mapping is accessed and copied in a HashMap object and is used to 36
access the Campaign ID for each advertisement in the data records. Eventually a new array with all the three components, that is, Campaign ID, Advertisement ID and event time is created. The next transformation that is done is on the event time which is truncated and again multiplied by 10,000 to make all events generated in a 10 second time span to have the same event time. This benchmark defines the time span or the “window” to be of 10 seconds. So the event time, which is in milliseconds is first converted to Long number, divided by 10,000 milliseconds (or 10 seconds) and then again multiplied by 10,000 to convert it to milliseconds again. This ensures that all events generated during a window period of 10 seconds have the same event time. Finally the advertisement IDs against each campaign in a window are counted and incrementally updated in Redis along with the current time stamp of the time which indicates the last updated time for that window. 3.4.2 Apache Storm The processing logic for calculating the windowed count of advertisements for campaigns in Apache Storm has been developed using Java. The logic and program flow is quite similar to that developed for Apache Spark Streaming. The major difference here is that the logic is specified by creating a topology containing spouts and bolts. Here too, firstly parameter values from the configuration file are accessed. These parameters specify the number of Storm workers, ackers and executors per worker have to be instantiated as per the user requirement. Also details such as the IP addresses and port numbers of Kafka and Redis are accessed to connect to them.
Figure 18: A source code screen shot of how the configuration YAML file is accessed by Apache Storm in order to fetch configuration parameter values.
Apache Storm defines processing logic as part of a topology. The TopologyBuilder object is first created and all spouts and bolts are defined for this object.
Figure 19: A source code screen shot of how the TopologyBuilder is used to create spouts and bolts to define the processing logic for Apache Storm.
37
A spout is defined to accept data tuples from Apache Kafka. Then the data tuples are parsed as a JSON string and converted to JSON objects. This is accomplished by a separate bolt which reads the key value pairs for each data record. Another bolt then removes tuples which have event type set as “view”. This is done by just “emitting” the tuple and not using the “ack” method on it to suggest successful processing of the tuple. The filtered data tuples are then sent to another bolt which is responsible for selecting just the Advertisement ID and event time fields to be sent forward to the next bolt. Now the Campaign ID and Advertisement ID table in Redis is accessed and the Campaign IDs for the advertisements are fetched. A new data structure containing the campaign ID, advertisement ID and event time is created and maintained. Again just like for Apache Spark Streaming, the event times are truncated and then again changed to milliseconds by multiplying by 10,000 in order to make events generated in a particular time span of 10 seconds have the same event time. Finally the advertisement IDs against each campaign in a window are counted and incrementally updated in Redis along with the current time stamp of the time which indicates the last updated time for that window.
3.5 The Output Data Generated This section discusses how the output data generated as a result of the execution of the benchmark for a particular data stream processing technology. When the processing is executed on Apache Spark Streaming or Apache Storm, it is run for some time to let window data get accumulated and stored. During execution, all the windowed counts of advertisements against a combination of campaigns and event times are stored in Redis, which is an in-memory data store. This means that the data stored and maintained in Redis is only available till the execution is active. When the execution duration completes, all the data structures created in Redis get destroyed. In order to not lose the data, this benchmark copies the relevant output information in to text files and stores it under a particular folder for easy access. There are two data files that are created and stored, namely “seen.txt” and “updated.txt”. After the execution completes, the advertisement counts for each window is copied from Redis and saved in a file named “seen.txt”, and the difference between the last updated time of window and the truncated event time, based on which the counts were generated, is maintained in the file “updated.txt”. When all the tuples for a window have been processed, the last updated time of the window is recorded shortly before the processing completes. So the difference between the last updated time of the window and the window creation time yields a latency data point. As the processing completes, and the execution stops, the last updated time of the window is taken and the window creation time is subtracted from it. This is the end-to-end latency that was incurred for this window, which is the time lapsed in processing the tuples and generating the output since the tuples entered into the system for processing. This information is stored in the “Updated.txt” for future reference. Subtracting the window duration from this value will further give us the final event latency or the time taken by the final tuple in the window to reach Redis through the application right from its emission at Kafka. This can be shown as below: 38
window.final_event_latency = (window.last_updated_time – window.creation_timestamp) – window.duration
39
Chapter 4 Experiment Setup This section discusses the steps followed and actions undertaken in order to run the benchmark for Apache Spark Streaming and Apache Storm on EPCC‟s NeXtScale nx360 M4 server machine [68]. After the detail theoretical study of the data stream processing technologies and the benchmark test developed by Yahoo!, the next step was to build up the environment for the experiments to be performed. In order to go ahead, it was important to make sure that all the pre-requisites for running the benchmark on the processing technologies are present. It needed a few software and runtime environments to be installed. Finally, the benchmark source code available was pulled from Yahoo!‟s GitHub repository and modified to run for this specific environment.
4.1 Working Node To run the benchmark for Apache Spark Streaming and Apache Storm, the first and foremost step was to ensure that a dedicated working node was available for all the installations and executions required. A working node was assigned for this project, with the provision of getting three more, if required. The node that was assigned belongs to a NeXtScale nx360 M4 server, which is designed to optimise the performance within normal infrastructure limits of a typical data centre. It has access to two Intel® Xeon® CPU E5-2660 v2 processors running at 2.20 GHz each, each with 10 cores. The memory allotted is around 128 GB for each node. The operating system installed is CentOS 8.22.
4.2 Pre-requisite Software Installations The code for the benchmark was written in multiple languages such as Clojure, Scala and Java. In order to support these languages some additional software has to be installed. A step by step approach as to how the installations were done is as follows:
GNU Wget is a program that retrieves or downloads contents from a web server. As a lot of software downloads were required to be done in order to render the node a usable one for the benchmark, it was necessary to have a 40
working version of Wget. Wget was installed using the sudo yum package using the following command: sudo yum install wget
It was found out that Redis programs are written in C programming language. In order to install Redis and get a working version of it running, it was mandatory to have GNU C compiler installed. It was also installed using the sudo yum package as follows: sudo yum install gcc
The Yahoo! Benchmark source code was uploaded and made available through GitHub. It is a repository hosting service and can be used to access and maintain code changes in a systematic manner. Source codes uploaded to GitHub may be downloaded and accessed in local directories using command line tools provided by GitHub. In order to download code, the Git service was required to be installed. The following command was used to install Git: sudo yum install git
The processing logic for Apache Spark Streaming is written in Scala and in Java for Apache Storm. Java and Scala both required developments kits and runtime environments installed in order to run the evaluation tests. For java, JDK 1.8.0 was installed. Also, the environment variables JAVA_HOME and PATH were changed to include the path to access the Java folder. Both these variables being set to include the Java address was also mentioned in “bashrc” script which permanently included the changes, every time the system was accessed. Similarly, for Scala, Scala 2.10.6 was installed. As the working node uses CentOS operating system, the Scala installation was done by downloading and installing the RPM file.
Apache installations are managed by Apache Maven, which helps to build the various projects. Apache Maven is a software project management tool which manages building, reporting and documentation of all Apache technologies. As three Apache technologies, namely, Apache Kafka, Apache Spark Streaming and Apache Storm are used here, it was mandatory to associate these with Apache Maven. Hence Apache Maven 3.3.9 was installed and its path appended to the PATH environment variable.
The data preparation logic, data events sent to Apache Kafka for emission and finally generating the output files by accessing the data structures in Redis are written in Clojure. This required the runtime environment for Clojure to be installed. Also as mentioned in the Yahoo! benchmark, Leiningen was needed to be installed to allow easy execution of Clojure programs. Hence Clojure1.8.0 and Leiningen were installed and the environment variable PATH was appended with the address path to access Leiningen.
41
4.3 Downloading and Setting up Benchmark After making sure that the working node was ready with all the required software installations, the actual benchmark code was pulled from the repository at https://github.com/yahoo/streaming-benchmarks. As mentioned in Section 3.2, the benchmark has been so designed that all activities are automated by the use of a single bash script. It handles all software installations and execution of evaluation tests on Apache Spark Streaming and Apache Storm. The script is also dynamic enough to handle installations of older and newer versions of the same technology. This does not require any change in the source code. The control script maintains all versions of technologies that need to be loaded in specific variables. Just changing the version number in the variables will run the script to install the required version. As Yahoo! benchmark was released in December, 2015 and since then there has been other newer versions of the various technologies available, it was decided that newer versions will be used instead of the versions Yahoo! used. The versions that were used for this evaluation test are as follows:
Apache Kafka version 0.8.2.1
Redis version 3.2.0
Apache Spark Streaming version 1.6.1
Apache Storm version 0.10.0
All the required versions of the technologies were installed by the command “./streambench.sh SETUP”. The control parameters that were set for the benchmarks are as follows:
The window duration was set to be 10 seconds for both Apache Spark Streaming and Apache Storm.
Apache Spark Streaming and Apache Storm, due to the vast difference in their architecture, handled updates to Redis in very different ways. Apache Spark Streaming uses micro-batching in order to process the data which Apache Storm uses topologies which ensure continuous processing of data. So the updates to Redis for Apache Spark Streaming jobs are called when the job completes execution. However for Apache Storm, the updates to Redis have to be triggered at particular intervals. The SLA for updating Redis with the calculated count of advertisements and last updated time is set as 1 second for Apache Storm. In order to compare the performance with Apache Storm, the batch duration for Apache Spark Streaming was kept to 1 second as well.
The data streams are prepared with a combination of 100 campaigns and 10 advertisements per campaign. An explanation for how the data is generated and emitted as JSON events is given in Section 3.3.
42
One Kafka node with one partition enabled to emit data tuples to the data stream processing technologies.
There was one Redis node enabled to handle all in-memory data updates and queries.
One Apache Storm worker was enabled to handle data processing.
The processing was set to run for 120 seconds, that is, 2 minutes.
4.4 Troubleshooting While trying to test whether a running version of the benchmark code was established or not, it was found that the Zookeeper server, which works to manage the producers and consumers of Apache Kafka, could not be started. The problem was analysed and it was found that the default port that Zookeeper uses, which is 2181, was inaccessible as it was already being used by some other service. In order to make Zookeeper work, the port number for it was changed to 9999. This change was made to all the required files such as the YAML configuration files, “zookeeper.properties” file and “server.properties” configuration file.
Figure 20: A screen shot showing that the zookeeper port had to be changed to 9999 in all configuration files due to port conflict.
Another problem faced was an error in the control script. While writing code for starting the Zookeeper server, the original control script wrongly mentioned the path to access the Apache Storm directory instead of the Apache Kafka directory.
Figure 21: A screen shot showing that the Yahoo! code for starting Zookeeper server was erroneous and mentioned the Storm directory instead of the Zookeeper directory.
This caused an error when the evaluation tests were run. Identifying this problem, the code was changed in the local version.
Figure 22: A screen shot showing that the Zookeeper directory was changed in the project implementation.
43
Another constraint that was noticed in the Benchmark implementation was the hardcoding of the Apache Kafka topic name in one of the files whereas storing it in a variable in the control script, thereby rendering it reusable even when the topic name is changed. In the control bash script and in the configuration YAML files, the Kafka topic name has been maintained as variables. This provides with a lot of flexibility as the same code can be used for a different topic name. It just requires changing the value of the variables. However, in the Clojure file which creates data events and manages the data movement to Apache Kafka and finally from Redis to the output files, the Kafka topic name while creating data events at Kafka is hardcoded. This renders the code to be non-reusable. The Kafka topic name was therefore kept to be what was initially specified by Yahoo!.
Figure 23: A screen shot showing that the Kafka topic name has been hardcoded in the Yahoo! benchmarking source code.
44
Chapter 5 Experimental Details This chapter discusses the detailed plan and methodology followed in order to evaluate the two chosen data stream processing technologies. As explained in Chapter 3, the benchmark chosen was functionally and technically understood in detail. This helped in achieving a clear understanding of how the data is being generated as tuples, what format is it generated in and what processing steps are being executed in order to transform the data and generate the desired output. Based on this knowledge, the experiments were planned and successfully performed. Also, the knowledge gained about the design, architecture and configurations available for the participating technologies helped in identifying the various control parameters which had the potential to alter the performance of the technologies. These control parameters were included as part of the evaluation process. These factors in combination formed the basis for drawing conclusions as to how one can improve the performance of the technologies. Lastly the individual experiments conducted on the technologies were compared keeping the basic control parameter values and the processing logic same. This helped to gain insight as to which technology can be preferred more than the other in the given hardware, software and network environment.
5.1 General Experiments This section covers the common experiments that were performed on both Apache Spark Streaming and Apache Storm in order to understand their performance statistics. These experiments also formed the basis of the comparison between the two technologies. These experiments were based on the general characteristics or requirements of a data stream processing technology. 5.1.1 Maximum Throughput threshold Measurement The aim of this experiment was to find out the maximum throughput value beyond which a particular technology fails to keep up with the rate of data ingestion. To carry out this experiment, a throughput value was first selected as the maximum number of tuples per second that would be sent as input to the system. Based on this maximum value, specific percentages or fractions were defined and specified, for which the test was individually run. For each run, the processing times logged for all the windows in 45
the output file “updated.txt” were averaged to get a single value per percentage of tuples processed. These values were then plotted against the percentages. This experiment indicated two things. Firstly, how the processing time varies with increasing percentages of tuples processed and secondly, the maximum throughput value at which the processing time significantly increases, thereby indicating that the system is not being able to cope up with the number of tuples ingested into the system. This experiment was run for both the technologies to record the maximum throughput beyond which it fails to keep up with the rate of data ingestion. Graphs for this test were plotted with processing times in milliseconds, also known as the end-to-end latency with respect to the percentage of tuples for which processing was completed. The results and analysis for this experiment has been explained in Section 6.1.1 for Apache Spark Streaming and in Section 6.2.1 for Apache Storm. Section 6.3.2 compares the experimental results for both the technologies. 5.1.2 Latency Recording The main aim of this experiment was to find how the final event latency varies with the number of tuples processed by the system. As explained in Chapter 3, the Yahoo! benchmark attempts at logging a windowed count of the number of advertisements per campaign and event time. For this, the window duration has been universally set as 10 seconds. This means that the count of all advertisement per campaign generated in a time span of 10 seconds are periodically updated to Redis against the particular unique Window ID. Now the difference between the time logged during the last periodic update and the window creation time gives us an idea of how much time was required for all the tuples in that window to be processed. Now as the last periodic update was logged just before the window expired, the difference between the processing time logged and the window duration gives us the final event latency. This may be described as the time taken by the last tuple in the window to reach from Apache Kafka to Redis after processing. The calculation may be shown as follows: Final event latency = (last periodic update time logged for window – window creation time) – window duration In this experiment, the test was run for different throughput values defined in the control script. For each run, the processing times logged for each window in the file “updated.txt” were averaged to reach a final value. Next, the window duration was subtracted from the processing time to get the final event latency figures for each throughput and plotted against the throughput value for both the technologies. This experiment clearly indicates what kind of latency figures are returned by each technology, thereby providing a ground for comparison. The results and analysis for this experiment has been explained in Section 6.3.3.
5.2 Technology Specific Experiments This section discusses about all the experiments that were conducted on configuration and other parameters provided for each technology. While gathering background information about the technologies, laid out in Chapter 2, certain technology specific 46
parameters were identified, controlling which the performance of the technologies were suspected to change. These parameters were considered while conducting experiments so that a complete picture for performance was available for each technology. 5.2.1 Apache Spark Streaming Apache Spark Streaming allows a number of ways in which the performance of the system may be controlled or optimised. These following parameters were identified while gathering knowledge about the specific technologies. 5.2.1.1 Controlling batch duration For a Spark Streaming application to be stable it is necessary for the system to process data as fast as it is being received. In other words, the system should be able to process batches of data as fast as they are being created. Depending on the application being run, the batch duration can be changed, that is, increased or decreased in order to get the optimum batch interval which can handle the required data rates. [61] The batch duration can be changed by specifying the required value in the configuration files as follows:
Figure 24: A screen shot showing how the batch duration is controlled by mentioning the value in the configuration file.
The parameter “spark.batchtime” is read by the Spark Streaming application along with others and the value specified here is used to define the individual batch duration while defining the Spark Context.
Figure 25: A screen shot showing how the value set in Figure 23 is used to define the batch duration of each job in StreamingContext object.
For this experiment, the batch duration as specified in the configuration YAML files were increased and decreased keeping the maximum throughput same. The processing times received for all batch durations were recorded and plotted against the percentage of tuples processed. This experiment indicates which batch interval or duration works best for the specific application. One thing to be noted here is that the maximum throughput set has to be kept the same for all batch intervals. The results and analysis for this experiment has been explained in Section 6.1.2.
47
5.2.1.2 Applying Backpressure Backpressure is a concept introduced in Apache Spark Streaming 1.5 to allow the system to behave in a dynamic manner towards handling the rate of data ingestion into the system. If the resources of the cluster are not large enough to handle the throughput, then this feature may be used to automatically and dynamically set the rate of ingestion of data according to the condition of the resources processing data and batch scheduling delays. This ensures that the system receives data only as fast as it can process. [64] Backpressure can be enabled or disabled as per the requirements of the application. The parameter has to be set to “true” or “false” in the SparkConf object, as shown below:
Figure 26: A screen shot showing how Backpressure is enabled by setting the spark.streaming.backpressure.enabled parameter as true in the SparkConf object.
In this experiment, the backpressure parameter was enabled by adding the code for it, as shown in the above figure. Then the test was run for a particular maximum throughput. All processing times returned for each percentage of tuples processed were averaged to get a single value. These figures were plotted against the percentage of tuples processed to understand how the processing varies with the tuples processed. Also the two graphs, one for backpressure enabled and the other for disabled are plotted compared to understand the behaviour of the system. The results and analysis for this experiment has been explained in Section 6.1.3. 5.2.1.3 Increasing the level of Data Receiving parallelism For data stream processing technologies, which aim at real time processing of data, it has to be made sure that data receiving is not a bottleneck. In other words, these systems should de-serialise the data and provide with ways to increase the parallelism of data receiving [62]. Apache Spark Streaming also provides with mechanism for this. In this benchmark, Apache Kafka has been integrated with Apache Spark Streaming using the No Receiver or Direct Approach. In this mechanism, instead of using receivers to get data, Apache Spark Streaming periodically queries Kafka for the latest messages using the offset values in each partition of a topic. Each batch receives offset ranges which are used to query the Kafka partitions. When the jobs are launched to process the data, the consumers defined in Apache Kafka reads the particular offset range of messages and delivers it to the Spark Streaming job. Spark Streaming on the other hand, creates as many RDD partitions as there are Kafka partitions, thereby creating a one-to-one mapping of RDD partitions with Kafka partitions to parallelise the data read. So if the number of partitions defined for a topic in Apache Kafka is increased, the RDD partitions will increase as well, thereby increasing the level of parallelism in data receiving. [63] 48
The benchmark has been designed to specify the name of the Kafka topic and the number of partitions required in the control script as shown below:
Figure 27: A screen shot showing how Kafka topic name and the number of partitions for that topic are specified in the configuration file.
While creating the topic, Kafka creates the required number of partitions using the following command as mentioned in the control script.
Figure 28: A screen shot showing how a Kafka topic is created along with the partitions required.
Later when Spark Streaming integrates with Apache Kafka, the Direct Streams method is used to implement the Direct Approach mechanism as shown below:
Figure 29: A screen shot showing how Apache Spark Streaming connects to Apache Kafka using the createDirectStream method where it creates a one-to-one mapping between the RDD partitions and the Kafka partitions.
While conducting this test, a new Kafka topic was created with more than three partitions. And the evaluation test was executed for particular maximum throughput value and batch duration. The processing times obtained for different percentages of tuples processed were recorded. When the individual plots of processing time with respect to the percentage of tuples processed for each partition were obtained, all of them were clubbed together in one graph in order to understand and analyse the differences. The results and analysis for this experiment has been explained in Section 6.1.4. 5.2.2 Apache Storm Apache Storm also allows a number of ways in which the performance of the system may be controlled or optimised. These following parameters were identified while gathering knowledge about the specific technologies.
49
5.2.2.1 Disabling ACKing ACKing is the process of throttling the input data into the topology of Apache Storm application. Just like backpressure in Apache Spark Streaming, ACKing enables the system to dynamically regulate the rate of data ingestion in order to match up with processing slowness or load on the system. This ensures that the rate of processing of data is at par with the rate of tuples entering the system per second. This method also ensures at-least-once message delivery guarantee. So for applications which do not have the requirement of at-least-once delivery guarantees may opt to disable ACKing in order to let go of performance penalties. [65] In order to disable ACKing, the number of ackers for Apache Storm has to be set to 0. To do this the corresponding parameter “storm.ackers” in the configuration YAML file has to be set to 0 as shown below:
Figure 30: A screen shot showing how the number of acker is specified by user for Apache Storm in the configuration file.
When Apache Storm is initialised and a StormConfig object is instantiated, this parameter is read from the configuration file and the number of ACKers for this application is set to that number. Setting the parameter to zero disables ACKing for the application as shown below:
Figure 31: A screen shot showing how the parameter for number of ackers is read from the configuration file and set in Apache Storm.
For this experiment, the “storm.ackers” parameter in the YAML file was set to 0 and the test was run for a particular maximum throughput value. The processing times recorded for all windows for each specific percentage of tuples completed are averaged to get a single value for each percentage. These values are then plotted against the percentage of tuples completed to understand how disabling ACKing changes the system behaviour. The results and analysis for this experiment has been explained in Section 6.2.2. 5.2.2.2 Increasing the number of executors and tasks In order to implement parallelism in Apache Storm, the concepts of workers, executors and tasks are introduced. A worker process is one of the cores participating in the processing of a subset of the topology defined in Storm. These Worker processes may 50
have one or more executors or threads running one or more components of the topology, which is, spouts or bolts. An executor is a thread spawned by the worker process which is responsible for the execution of one particular spout or bolt of the topology. These executors may run one or more tasks which do the actual processing or data emission. All tasks belonging to an executor run instances of the same component in the topology. [17] Apache Storm allows specifying the workers, executors and tasks needed for a particular application. According to the user requirements, these can be increased to facilitate parallelism. In order to control these parameters for this benchmark test, the number of process cores need to be specified in the YAML configuration file as follows:
Figure 32: A screen shot showing how the number of workers and executors are specified by user for Apache Storm in the configuration file.
The parameter values of “storm.workers” and “process.cores” are read by the system from the configuration files. The number of workers for the system is set to the value of “storm.workers” using the “setNumWorkers” method. As this project focuses on the experimenting with implementation on a single node, the number of workers is kept to 1. The number of executors is calculated from the parameter “process.cores” set in the configuration file. The logic here implemented takes the maximum between one and the value of “process.cores” divided by the total number of topology components, which is seven in this case. Finally the number of tasks for each spout or bolt is specified using the “setNumTasks” method. By default, if nothing is specified by the user, there is one task spawned for each executor and one executor spawned for each worker. The methods that are used to implement the parallelism are shown in the diagram below:
Figure 33: A screen shot showing how the number of workers, executors and tasks are set in Apache Storm for an application.
51
In this experiment, single node execution was concentrated on first. So the number of workers was kept as one. Three test cases were identified, which are as follows:
One worker with one executor and one task per executor.
One worker with two executors and two tasks per executor, that is, four tasks in total.
One worker with two executors and four tasks per executor, that is, eight tasks in total.
The evaluation test was then run for a maximum chosen throughput. The average processing time obtained for specific percentage of tuples processed were recorded and plotted in a single graph in order to notice the variations. The results and analysis for this experiment has been explained in Section 6.2.3.
52
Chapter 6 Results and Analysis This section discusses the results obtained after running the evaluation benchmark tests on Apache Spark Streaming and Apache Storm. To systematically perform the tests and log the results, a plan was first created as to how the evaluation will be carried out, as specified in Chapter 5. It was decided that the technologies will first be evaluated individually. Also certain factors or parameters which may affect the performance of the system were tested to analyse whether a change in these parameters yield better results. After a complete analysis of the tests on each technology, a comparative analysis is done in order to find out which technology worked better in the specific hardware, software and network conditions.
6.1 Apache Spark Streaming This section discusses the results of all evaluation tests run on Apache Spark Streaming. All the experiments as explained in Sections 5.1 and 5.2.1 were executed and the results were logged. The details of the experiments performed and analyses done on the outcome are as follows: 6.1.1 Maximum Throughput Threshold Measurement As explained in Section 5.1.1, in this experiment, the main objective was to understand how the processing time varies with respect to the percentage of tuples processed. The evaluation test was executed for maximum throughputs of 80,000, 100,000 and 130,000 tuples per second. The batch duration was uniformly set as 1 second and each evaluation test was run for 120 seconds. The processing time for each throughput recorded is shown in the following table:
53
Maximum Throughput (tuples / second)
Percentage of tuples processed (%) (Batch Duration: 1 second) 1
10
25
35
50
75
90
80,000
8974
1,00,000 1,30,000
100
9494
10594
18034
24675
31005
46258
56987
8897
9515
9848
10323
16745
26464
32128
45786
9006
10489
11056
11321
11227
24106
26907
28154
Table 1: A tabular representation of the variations in processing time with respect to maximum throughput.
The results obtained can be graphically represented as follows:
Figure 34: A graphical representation of the variations in processing time with respect to maximum throughput.
We see that with the increase in the percentage of tuples, the time required by the tuples to reach from Kafka to Redis gradually increases for each throughput. For the maximum throughput of 100,000 tuples per second, a very steep rise in the processing time is observed at 100% of tuples processed. The same pattern is noticed in the processing time recorded at 90% of the maximum throughput of 130,000 tuples per second, which is 117,000 tuples per second. Analysing this behaviour of a sudden and sharp rise in the processing time figures at and after 100,000 tuples per second, it is concluded that the threshold for handling throughput for Apache Spark Streaming here is 100,000 tuples per second. 54
6.1.2 Controlling Batch duration As explained in Section 5.2.1.1, for this particular experiment, the batch duration was increased and decreased in order to understand how the batch duration affected the endto-end latency of the system, also known as the total processing time. The evaluation tests were run for batch durations of 1 second, 3 seconds, 10 seconds, 15 seconds and 20 seconds respectively for a maximum throughput of 100,000 tuples per second. The experiment was executed for 120 seconds each time. The processing time values retrieved for specific percentage of tuples processed are as follows: Percentage of tuples processed (%)
Batch Duration (seconds)
(Maximum throughput: 100,000 tuples / second) 1
10
25
35
50
75
90
1
8897
9515
3
10939
10
100
9848
10323
16745
19197
21859
33398
11108
11507
12238
16080
20325
24506
39179
10296
11015
13122
17046
19390
21866
25244
49168
15
14646
15552
18415
21559
25991
32859
36221
47067
20
15438
16475
18181
23625
28021
33462
42319
52149
Table 2: A tabular representation of the processing times with respect to batch duration.
Plotting the recorded processing time values retrieved against the percentage of tuples processed, the graphical representation obtained is as follows:
Figure 35: A comparative graphical representation of the effect of controlling the batch duration on the processing time.
55
It is noted here that decreasing the batch duration decreases the end-to-end latency for the same percentage of tuples processed. However, it is common knowledge that increasing the batch duration results in a decrease in the overhead of switching context from one job to another. More data tuples are processed in the same jobs. It is important here to experiment and find out the optimum batch duration for a particular processing job at hand. Long batch durations for less amount of data per job will lead to holding up of resources while there is not much work to be done. Similarly, a job with very low batch duration but handling very high throughput of data is not desirable, as it lead to very long processing times. Here we see that a batch duration of 1 second provides with the lowest processing time figures. 6.1.3 Applying Backpressure As explained in Section 5.2.1.2, this experiment was related to observing the variations in processing times of Spark Streaming if the backpressure feature was enabled. The backpressure parameter was enabled and the test was run for a maximum throughput of 100,000 tuples for second. The batch duration was fixed to be 3 seconds and the experiment was run for 120 seconds. The results obtained are as follows:
Percentage of tuples processed (%) Maximum Throughput: 100,000 tuples per second
Backpressure 1
10
25
35
50
75
90
100
Enabled
11145
11606
11270
12383
17637
25401
53751
58015
Disabled
10940
11108
11508
12238
16081
20326
24507
39179
Table 3: A tabular representation of the effect of backpressure enabled and disabled on the processing times retrieved with respect to the percentage of tuples processed.
56
The results obtained may be graphically represented as follows:
Figure 36: A comparative graphical representation of the effect of enabling or disabling backpressure on the processing time.
The above graphical representation shows that with backpressure enabled, the processing time or the end-to-end latency of the system increases than with backpressure disabled. The experiment was conducted keeping the objective in mind that if throughput is controlled, the end-to-end latency will also be regulated. Backpressure dynamically handles the rate of data ingestion into the system and hence tries to lower the batch processing time with respect to the batch interval. But it was noticed that although it might have helped in stabilizing the system, it only increased the processing time. This can be due to the fact that with backpressure enabled, whenever there will be a disparity in the processing load and the rate of ingestion of data, there will be a requirement of buffering the messages. This is because backpressure will regulate the throughput and lower it to match with the processing rate of jobs. This can lead to an overhead, increasing the total processing time of the tuples. 6.1.4 Increasing the level of parallelism in Data Receiving As explained in Section 5.2.1.3, in this experiment, the aim was to record the variations in processing time with respect to the percentage of tuples processed when the level of parallelism in data receiving was increased. By default, this benchmark was set to use one partition at Kafka to emit the tuples. This was increased to three partitions and the results were noted down. The experiment was conducted on 3 second batch duration with a maximum throughput set to 100,000 tuples per second. A new Kafka topic with 3 partitions was created and used to run the tests for 120 seconds. The variations in the processing time noted down are as follows: 57
Percentage of tuples processed (%) Number of partitions
Maximum Throughput: 1,00,000 tuples per second 1
10
25
35
50
75
90
100
1
10940
11108
11508
12238
16081
20326
24507
39179
3
10912
10854
10593
11924
17654
49898
52432
65489
Table 4: A tabular representation of the processing times retrieved in Apache Spark Streaming with respect to the increase in Kafka partition.
Graphically representing the above information, we get the following:
Figure 37: A comparative study of the effect of increasing the level of parallelism on the processing time.
It is observed that for lesser percentages of tuples the processing time observed for both one partition and three partitions are more or less the same. As the percentage level increased the processing times observed while using three partitions greatly shot up. One possible explanation for this unexpected result can be that the level of parallelism is required to be increased more at the data processing side rather than data receiving. More number of partitions and RDD instances result in more jobs being generated to be processed at the same time, the extent of which the system is not capable to handle. This increases the end-to-end latency or the total processing time of the tuples.
58
6.1.5 Conclusion By the experiments conducted on Apache Spark Streaming, the following observations were made: Apache Spark Streaming is unable to handle throughput as high as 100,000 tuples per second in this case. Reducing the batch duration resulted in lower end-to-end latency figures or processing times. Increasing the parallelization of data input affects the system adversely, increasing the latency recorded for the jobs. This may be due to the fact that job scheduling becomes the bottleneck with more jobs waiting to be executed at the same time. Increasing the working nodes in Spark Streaming cluster should normalise this issue to an extent. Applying Backpressure to let the system dynamically decide as to how much rate of data will be ingested depending on the load of the system increases the processing time figures. This may be due to the fact that there is a lot of buffering done for the messages waiting to be ingested when the system throttles the data input rate and lowers it.
6.2 Apache Storm This section discusses the results of all evaluation tests run on Apache Storm. All the defined experiments as explained in Sections 5.1 and 5.2.2 were performed and the results carefully recorded. The results obtained against each test and analyses of the results are presented below: 6.2.1 Maximum Throughput threshold Measurement As explained in Section 5.1.1, the aim of this experiment was to find out the maximum throughput threshold for Apache Storm for the given evaluation conditions. The experiment was conducted separately for four different maximum throughputs set, which are 90,000, 110,000, 130,000 and 150,000 tuples per second. For each throughput, the variations in processing time with respect to the percentage of tuples processed were recorded. The results obtained are as follows:
59
Maximum Throughput
Percentage of tuples processed (%)
(tuples / second)
1
10
25
35
50
75
90
90,000
10012
10056
10197
10248
10892
12354
14796
20154
1,10,000
10065
10156
10258
10376
11712
14258
17956
23451
1,30,000
10425
10894
11240
11897
12432
15879
20348
36784
1,50,000
10875
11237
11985
12745
15647
26497
37214
45213
100
Table 5: A tabular representation of the processing times retrieved in Apache Storm with respect to the maximum throughput.
A graphical representation of the above observation led to understanding how the processing time varies for each throughput.
Figure 38: A graphical representation of the change in processing time in milliseconds with varying maximum throughput handled.
It was observed that the processing time or the end-to-end latency of the application when run on Apache Storm keeps increasing as more number of tuples is processed by the system. Also a very steep rise in the processing time is noticed when the system processes 130,000 tuples per second. The time taken for the tuples to be processed and 60
the output to be updated in Redis is much longer while trying to handle throughputs of and above 130,000 tuples per second. So it may be concluded that for the given application being run on the specific hardware, software and network setup, the maximum throughput threshold for Apache Storm is 130,000 tuples per second. 6.2.2 Disabling ACKing As explained in Section 5.2.2.1, in this experiment, the aim was to find out whether disabling ACKing or Automatic backpressure has any effect on the end-to-end latency figures or not. The experiment was conducted for a maximum throughput of 100,000 tuples per second. The test was run for 120 seconds for both ACKing enabled and disabled. The processing time or end-to-end latency figures obtained are as follows:
Percentage of tuples processed (%) Maximum Throughput: 100,000 tuples per second
ACKing 1
10
25
35
50
75
90
100
Enabled
9788
9777
9857
10310
12318
19728
25618
39927
Disabled
10107
9855
9896
9239
9841
17689
18394
32445
Table 6: A tabular representation of the processing times obtained for Apache Storm with respect to the ACKing enabled and disabled.
Graphical representation of the above information is as follows:
Figure 39: A comparative graphical representation of the effect of ACKing on the processing time for Apache Storm.
61
It is noted here that with ACKing disabled, the processing time figures are reduced to a certain extent than with ACKing enabled. ACKing is the process of dynamically controlling the data ingestion rate in order to stablise the system and protect it from sudden data surges. It also guarantees that there is no loss of messages as the messages currently not being accepted into the system are buffered and stored for future pocessing. However the extra work being done introduces slowness and hence the processing figures are a little high with ACKing enabled. 6.2.3 Increasing the number of executors and tasks This experiment as explained in Section 5.2.2.2, involved recording the variations in processing time with respect to percentage of tuples processed when the number of executors and tasks are increased. The results obtained for a maximum throughput of 100,000 tuples per second are as follows: Percentage of tuples processed (%) Maximum Throughput: 100,000 tuples per second
Parallelism 1
10
25
35
50
75
90
100
1 worker, 1 executor and 1 task
9908
10080
10032
10585
26070
42308
50870
51660
1 worker, 2 executors and 2 tasks
9797
10287
10261
10009
13710
30917
43296
46985
1 worker, 2 executors and 4 tasks
9788
9777
9857
10310
12318
19728
25618
39927
Table 7: A tabular representation of the processing times obtained for Apache Storm with respect to the number of workers, executors and tasks.
62
The above information can be represented using the following graph:
Figure 40: A graphical representation of the variations in processing times when the number of executors and tasks are increased.
It was observed that with the increase in the number of executors or tasks per executor, the processing times decreased to an extent. This indicated that with the increase in the number of executors and tasks, the level of parallelism increased. The system was able to process data faster and better keep up with the rate of ingestion of data. 6.2.4 Conclusion Looking at the various experiments performed on Apache Storm, the following observations are made: Apache Storm is not able to handle throughput more than 130,000 tuples per second in this evaluation test. The processing time or the end-to-end latency figures surge up suddenly when the throughput reaches 130,000 tuples per second or more. Increasing the parallelism of the system by increasing the number of executors and tasks reduce the end-to-end latency figures. As this project concentrated on a single node execution of the evaluation benchmark, the effect on processing time when more nodes or workers are used has not been experimented with. However increasing the number of executors and tasks brings in performance benefits. Disabling Automatic Backpressure, although does not guarantee “at-least-once” delivery of input data messages, surely helps reducing the processing time figures. 63
6.3 Comparative Analysis In this section a comparative analysis is done between Apache Spark Streaming and Apache Storm based on the detailed study and experimental analysis done. This section throws some light on which technology is better suited for processing data streams in similar hardware, software and network conditions. The analysis and comparisons are done looking at the various important factors and requirements of a data stream processing technology, which are as follows: 6.3.1 Computation Model This refers to how the data is handled according to its basic architecture. A comparative analysis of the architecture points out the basic difference in how the data is handled in each system and how it is made available for processing. It also points out to performance differences rising out of difference in the nature they handle or process data. Apache Spark Streaming and Apache Storm follow very different architectures to process data streams. Apache Spark Streaming is a batch processing system and uses the core Apache Spark engine to process data. It takes in data streams and creates micro-batches of tuples or data records. These small sets of data batched together are immutable in nature and thus can be processed as normal data batches by the core Spark engine. Apache Storm on the other hand is a pure streaming technology and uses topologies to define processing logic. It processes data events one at a time using spouts and bolts defined in the topology. These basic differences in their architecture point out that while Apache Storm, being a pure streaming technology, processes data just as it is injected into the system, Apache Spark Streaming has to first spend some time in batching events before assigning them to jobs for processing. Due to this Spark Streaming incurs some time lag in processing data compared to Apache Storm. 6.3.2 Maximum Throughput Threshold The Maximum Throughput threshold is the maximum rate at which a data stream processing technology is able to accept input data into the system for processing in a given hardware, software and network setup. Knowing the characteristics of big data, a technology will be better than the other if it can handle more throughputs without any processing delay. Performing specific tests on Apache Spark Streaming and Apache Storm in order to understand how resistant the technologies are to higher throughputs gave an idea as to which technology can handle more data rate than the other. It was understood from individual experiments on Apache Spark Streaming and Apache Storm, as explained in Sections 6.1.1 and 6.2.1, that for the given setup and data processing requirement, Apache Spark Streaming could not handle throughputs of and above 100,000 tuples per second where as for the same setup and data processing requirement, Storm faced problems in handling data rates of and higher than 130,000 tuples per second. This shows that Apache Storm as a data stream processing 64
technology is slightly better at handling higher throughput than Apache Spark Streaming. In order to compare variations of the performance results, experiments were run for the same evaluation parameters on Apache Spark Streaming and Apache Storm. As the SLA for updating Redis is 1 second for Apache Storm, the batch duration was set to 1 second for Apache Spark Streaming. The maximum throughput for both the technologies was kept as 130,000 tuples per second and the test was run for 120 seconds. The results obtained can be represented as follows:
Figure 41: A comparative graphical representation of the performance results of Apache Spark Streaming and Apache Storm.
From the above figure, it is implied that for a given set of conditions, Apache Storm provides with lower processing time figures than Apache Spark Streaming. However the project timeline did not allow the experiments to be conducted on multiple nodes. By increasing the number of executors and tasks for the same worker, parallelism of data processing was still tested for Storm. But similar experiments could not be done on Apache Spark Streaming due to time constraints. It might be interesting to observe the results obtained from the same application when run on a multi-node clustered or distributed environment. It may be concluded here that as standalone systems, Apache Storm could handle higher throughput than Apache Spark Streaming.
65
6.3.3 Latency Recording Latency can be defined as the time taken for a data stream processing technology to process data and generate the desired output after the input data has been accepted or injected into the system. If the characteristics of big data are looked into, a technology will be better than the other if it shows lower latencies figures. A very important aspect of data stream processing technologies is to be able to process data and provide results with minimum delay. It should be fast and accurate in its processing. This experiment was conducted to understand which technology was able to provide with lower latencies. For this, the window processing time was recorded for different throughputs for both Apache Spark Streaming and Storm. The batch duration for Apache Spark Streaming was set to 1 second. In order to get the final event latency the processing time was subtracted by the window duration, as explained in details in Section 5.1.2. The results obtained were as follows: Throughput (tuples / second) Batch Duration for Spark Streaming: 1 second
Technology 10K
20K
40K
60K
80K
100K
120K
Apache Spark Streaming
85
112
4352
5712
35215
43769
49943
Apache Storm
66
125
236
1154
1569
1747
2424
Table 8: A tabular representation of the final event latencies obtained for different throughput values for Apache Spark Streaming and Apache Storm.
66
Graphical representation of the above figures is as follows:
Figure 42: A comparative graphical representation of the final event latency variation with respect to increasing throughput.
From the above representation, it is analysed that Apache Storm is capable of providing with much lower latencies than Apache Spark Streaming. The difference in the latency figures between Apache Storm and Spark Streaming increases to a great extent for higher throughputs. For lower throughputs, Apache Storm achieves sub second latencies. For higher throughput, it increases slightly and goes up to a maximum of around 2 seconds. On the other hand, Apache Spark Streaming provides with latencies going up to several seconds. Hence its concluded that Apache Storm is capable of achieving sub-second latencies and keeps it to very low levels, whereas Apache Spark Streaming provides with latencies which go up to a few seconds. However as the experiments have only been done on a standalone node, it is not known whether the same results would be replicated in a multi-node arrangement as well. 6.3.4 Fault Tolerance Fault tolerance is the mechanism followed by the data stream processing technologies to handle faults such as network or process failure. For a data stream processing technology, it is very important to follow a proper message delivery semantic as data is not stored anywhere before processing. In case of any failure, the technology should be able to retrieve or recall the message.
67
By default, Apache Spark Streaming allows exactly-once message delivery whereas Apache Storm guarantees at-least-once. The details of these message delivery semantics have been discussed in Sections 2.1.1.2.1 and 2.1.2.2.1 respectively. Exactlyonce delivery is by far the most desired fault tolerance behaviour out of the three. For this, a technology has to ensure that no messages remain undelivered or are duplicated. In case of any failure, where a delivery confirmation has not reached the sender, the sender will only re-send the message after ensuring that the message has not been delivered. On the other hand, at-least-once message delivery semantic ensures that each message is delivered at least once. In case of failures such as network failures, where it cannot be determined whether the message has reached the destination or not, the system will re-send the message. This semantic ensures that no messages are missed but also results in duplicate deliveries and processing. Going by default settings, Apache Spark Streaming provides with better fault tolerance techniques than Apache Storm. It is however possible to make Apache Storm apply exactly-once semantic through the use of Trident, which is another layer of abstraction on Apache Storm to do real time computations. [67]
68
Chapter 7 Conclusions and future work The main aim of this project was to firstly get a good understanding of the different data stream processing technologies available, select two of these to further evaluate the differences in their approach towards processing data streams experimentally by performing benchmark tests and finally be able to provide with a detailed comparative analysis to understand and note their suitability in different scenarios. In order to achieve this, few data stream processing technologies available were looked at in detail. Their architecture and design were analysed in order to understand how each one handles fast and parallel processing of data streams continuously entering into the system. Out of these, two of the most popular open source technologies used these days, that is, Apache Spark Streaming and Apache Storm were selected as candidates for a detailed evaluation in order to compare and find out which technology is more favourable in what conditions. The selection was made on the basis of popularity, that is, two most widely used technologies were chosen. Apache Spark Streaming is the most popular among all the technologies available with a user community size of more than 280 contributors followed by Apache Storm with more than 100 contributors [69]. Also, Spark Streaming and Storm, both being Apache projects, getting help from their developer community, if required, and getting issues solved was ensured. Thirdly, being open source helped in the fact that this project was executed and completed without any cost incurred to use the technologies. The next requirement was to choose an appropriate benchmark to execute tests to better understand the performance and capability of the two technologies. For this few of the available benchmarks, built to evaluate different data stream processing technologies were studied in detail. Most of the benchmarks were strong with a good scenario implemented to measure performance of these technologies. However the constraint faced was that most of them did not share much knowledge about the data sets that were used. Also with the unavailability of source code, fundamental concepts were not cleared and doubts about the implementation remained. The requirement here was of a strong benchmark that provides access to its data, processing logic and code in order to use the same to conduct performance experiments for this project. Hence, the benchmark designed and developed by Yahoo! was chosen. Yahoo!, an avid user of data stream processing technologies, came up with a strong benchmark by implementing a real world scenario where data is processed several times before 69
generating output without much time lag. Hence factors such as availability of resources, simulation of a real world scenario, etc. influenced the decision in favour of the Yahoo! benchmark. The next task was to concentrate on how to use the benchmark for Apache Spark Streaming and Apache Storm. These included various software installations to be done before proceeding with the evaluation. A node with satisfactory hardware and network parameters was chosen and the software stack was built up for it to be able to execute the benchmark. Also many issues came up which had to be taken care of. For example, there was port conflicts faced, for which changes to port numbers had to be done in multiple configuration files. Working through such issues ensured that the benchmark could be successfully used. Finally the benchmark was executed to install all the required technologies and then evaluation tests were run for Apache Spark Streaming and Apache Storm. Certain technology specific experiments were planned as well to see how the change of certain control parameters affected the performance of the system. The main focus was on how fast the data is being processed and how well the technologies can handle higher rates of data ingestion. Multiple experiments were conducted to understand their behaviour and explanations were sought to correlate with the findings. Lastly a detailed comparative analysis was done to reach a conclusion as to which technology worked better in this particular hardware, software and network setup. It was found that Apache Storm was able to handle a maximum throughput of 130000 tuples per second beyond which its performance deteriorated. Apache Spark Streaming fell behind Storm in performance here as it was able to handle a maximum throughput threshold of 100000 tuples per second only. Also Apache Storm took lesser time to process the data then Apache Spark Streaming. Although tuning control parameters such as reducing the batch duration for Apache Spark Streaming returned better performance results, it still could not match up to the results obtained for Apache Storm. A couple of other parameter tuning were experimented with for Apache Spark Streaming but unfortunately did not return better results. For example, it was thought that enabling backpressure or the facility available in Apache Spark Streaming to dynamically regulate the load of incoming data with respect to the rate of processing of jobs would make the performance results better. But on the contrary it was not found to be so. A reason for this could be that there is an overhead for buffering messages which are not accepted by the system momentarily. Another parameter experimented with was increasing the number of Apache Kafka partitions in order to increase the level of parallelism at data receiving. This too, unfortunately returned with poorer performance results for Apache Spark Streaming. As Apache Kafka has been integrated with Spark Streaming using the Direct Approach method in this benchmark, it was thought that increasing the number of Kafka partitions would result is more number RDD partition thereby increasing the number of jobs being generated for processing at a particular time. However it was observed that that it took more time for the jobs to get completed, which led to the conclusion that more number of jobs at the same time increased the overhead of scheduling them. One thing to be noted here is that all the above explained experiments were conducted for a 70
single node implementation. The results obtained might differ for a multi-node implementation, which was not experimented with in this project due to time constraints. A few parameter-tuning experiments were conducted for Apache Storm as well. For example, The ACKing or automatic backpressure facility was disabled to see it effect on the performance. It was observed that disabling ACKing resulted in better performance from Apache Storm. ACKing controls the rate at which data is received for processing depending on the load of the system and hence has to buffer messages which are momentarily not accepted by the system due to processing load. Disabling this facility eliminates the overhead of buffering and hence provides with better results A very important observation made was that increasing the number of executors and tasks for a worker in Storm resulted in lesser processing time proving that increasing the level of parallelism at data processing increases performance. The effect of increasing the number of workers could not be checked due to time constraints. All experiments conducted were for a single node.
7.1 Recommendations This section discusses the better suitability of each technology based on particular requirements. After the detailed analysis that was done on Apache Spark Streaming and Apache Storm based on the experimental results, the suitability of these technologies in different scenarios are recommended below. Based on the observations obtained in this project, it was noticed that Apache Storm was able to perform better than Apache Spark Streaming in the given setup and scenario. It recorded higher throughput threshold than Spark Streaming and logged much lower latency figures. The main reason for this was found out to be the difference in their approach towards handling data processing. Apache Storm is a task-parallel system which focuses on distributing tasks and executing them in parallel in multiple nodes. In contrast to this Apache Spark Steaming is a data parallel system which focuses on executing the same task on multiple data sent across multiple nodes. For task intensive scenarios, or logic which involves a lot of different tasks to be processed, Apache Storm is recommended as the technology to be used. Apache Storm can be useful in areas of scientific research and financial fraud detection where the complexity lies more in the programming logic than on the data volume. Similarly for data intensive problems, where the data load is much more than the number of tasks performed in the problem, Apache Spark Streaming is recommended. Problem scenarios such as processing huge amounts of social media data, which do not require strict sub-second latencies, can use the benefits of Apache Spark Streaming. Also for problem scenarios where one of the major requirements is to complete processing as fast as possible, Apache Storm is recommended technology. This is due to the fact that Apache Storm has much lower latencies than Apache Spark Streaming. Apache Storm is able to complete execution of data streams with sub-second latencies, whereas Apache Spark Streaming logs latencies which are in seconds. For critical use 71
cases such as trying to know whether a financial transaction was fraudulent or not, it is very important process the data and generate alerts as soon as possible. Considering problem scenarios where robustness and fault tolerance are the major requirements, Apache Spark Streaming should be considered as the technology to be used for data processing. Apache Spark Streaming provides with exactly once message delivery guarantees. This is due to the fact that Spark Streaming uses the concept of Resilient Distributed Datasets (RDDs) which are immutable sets of data for processing. Any data lost, can be retrieved from the RDDs. On the contrary Apache Storm provides with at least once message delivery guarantee which ensures no loss of data but can lead to data duplication. Though Apache Storm may be configured to provide exactly once message delivery guarantee, it will need to work with Trident, which is an extra layer of abstraction. If fault tolerance is a major factor to be looked at, Apache Spark Streaming is more suitable for use. A use case for Apache Spark Streaming here would be maintaining and processing huge amounts of data generated by financial stock buying and selling. Similarly, processing Twitter messages and suggesting an impression of a topic, where it is not necessary to process or count all the tweets is better handled by Apache Storm.
7.2 Future Work Building upon the work that has already been done in this project, there can be various ways in which the work can be taken forward in order to make the project more enriching and useful. Some of the enhancements that may be worked on are as follows: 7.2.1 Evaluating Apache Spark Streaming and Apache Storm in a multi-node environment This project executed the technologies in a standalone single-node environment. As extension to the work done here, it may be observed how the different technologies perform in a multi-node environment. These technologies are built to process huge amounts of data in a parallel environment and hence it is very important to evaluate which technology fares better in a multi-node distributed or clustered environment. This task was planned as an extension work to this project but due to time constraints, could not be pursued. 7.2.2 Extending this project to include other data stream processing technologies This project involved the evaluation of two major data stream processing technologies. Although a lot of insight has been gained for Apache Spark Streaming and Apache Storm, there are few other data stream processing technologies which have not been experimented with. As extension to this project work, other technologies such as Apache Flink, Google Dataflow, Amazon Kinesis, Apache Samza, etc. may be evaluated using the same platform. This can give us an idea as to which data stream processing technology is by far the strongest.
72
References [1] From data gathering to competitive strategy: The evolution of big data. Online at http://searchcio.techtarget.com/essentialguide/From-data-gathering-tocompetitive-strategy-The-evolution-of-big-data. [2] Gali Halevi, MLS, PhD & Dr. Henk F. Moed. 2012 The Evolution of Big Data as a Research and Scientific topic: Overview of the Literature. Online at https://www.researchtrends.com/issue-30-september-2012/the-evolution-of-bigdata-as-a-research-and-scientific-topic-overview-of-the-literature/. [3] Bringing Big Data to the Enterprise. Online at https://www01.ibm.com/software/data/bigdata/what-is-big-data.html. [4] Big Data. Online at http://www.gartner.com/it-glossary/big-data/. [5] Bernard Marr. 2015 The Difference between Big Data and a lot of Data. Online at http://data-informed.com/the-difference-between-big-data-and-a-lot-of-data/. [6] William Vorhies. 2014 How many “V’s” in Big Data? The Characteristics that define Big Data. Online at http://www.datasciencecentral.com/profiles/blogs/how-many-v-s-in-big-datathe-characteristics-that-define-big-data. [7] Kai Wahner. 2014 Real Time Stream processing as game changer in a Big Data world with Hadoop and Data Warehouse. Online at https://www.infoq.com/articles/stream-processing-hadoop. [8] Spark Streaming Programming Guide at https://spark.apache.org/docs/1.6.1/streaming-programming-guide.html. [9] Cluster Mode Overview at http://spark.apache.org/docs/1.6.1/clusteroverview.html. [10] Apache Spark Documentation at http://spark.apache.org/docs/1.6.1/. [11] Discretised Streams at http://spark.apache.org/docs/latest/streamingprogramming-guide.html#discretized-streams-dstreams. [12] Fault-Tolerance Semantics at http://spark.apache.org/docs/1.6.1/streamingprogramming-guide.html. [13] Input DStreams and Receivers at http://spark.apache.org/docs/1.6.1/streamingprogramming-guide.html. [14] Building Robust, Adaptive Streaming Apps with Spark Streaming at 73
http://www.slideshare.net/databricks/building-robust-adaptive-streaming-appswith-spark-streaming [15] Storm (event processor) at https://en.wikipedia.org/wiki/Storm_%28event_processor%29 [16] Tutorial at http://storm.apache.org/releases/0.10.0/Tutorial.html. [17] What makes a running topology: worker processes, executors and tasks at http://storm.apache.org/releases/0.10.0/Understanding-the-parallelism-of-aStorm-topology.html. [18] Fault Tolerance at http://storm.apache.org/releases/0.10.0/Faulttolerance.html. [19] Erik Smit. 2015 Apache Storm’s fault tolerance in practise at https://www.anchormen.nl/apache-storms-fault-tolerance-in-practice/. [20] Rationale at http://storm.apache.org/releases/0.10.0/Rationale.html. [21] Overview at https://ci.apache.org/projects/flink/flink-docs-release-1.1/. [22] Fast Big Data: Apache Flink vs Apache Spark for Streaming Data at http://www.kdnuggets.com/2015/11/fast-big-data-apache-flink-sparkstreaming.html/. [23] Apache Flink at https://en.wikipedia.org/wiki/Apache_Flink. [24] Apache Flink at https://flink.apache.org/index.html. [25] Component Stack at https://ci.apache.org/projects/flink/flink-docsmaster/internals/general_arch.html. [26] The Processes at https://ci.apache.org/projects/flink/flink-docsmaster/internals/general_arch.html. [27] Distributed Execution at https://ci.apache.org/projects/flink/flink-docsmaster/concepts/concepts.html. [28] Programs and DataFlows at https://ci.apache.org/projects/flink/flink-docsmaster/concepts/concepts.html. [29] Parallel Dataflows at https://ci.apache.org/projects/flink/flink-docsmaster/concepts/concepts.html. [30] Data Streaming Fault Tolerance at https://ci.apache.org/projects/flink/flinkdocs-master/internals/stream_checkpointing.html. [31] Amazon Kinesis Streams at https://aws.amazon.com/kinesis/streams/. [32] Amazon Kinesis Streams Key Concepts at http://docs.aws.amazon.com/kinesis/latest/dev/key-concepts.html. [33] Amazon Kinesis Streams at http://docs.aws.amazon.com/kinesis/latest/dev/amazon-kinesis-streams.html. [34] Producers for Amazon Kinesis Streams at http://docs.aws.amazon.com/kinesis/latest/dev/amazon-kinesis-producers.html. 74
[35] Consumers for Amazon Kinesis Streams at http://docs.aws.amazon.com/kinesis/latest/dev/amazon-kinesis-consumers.html. [36] What is Google Cloud DataFlow at https://cloud.google.com/dataflow/what-isgoogle-cloud-dataflow. [37] Architecture: Real Time Stream Processing – Internet of Things at https://cloud.google.com/solutions/architecture/streamprocessing. [38] Service Optimization and Execution at https://cloud.google.com/dataflow/service/dataflow-service-desc. [39] High throughput, low-latency, and exactly-once stream processing with Apache Flink at http://data-artisans.com/high-throughput-low-latency-andexactly-once-stream-processing-with-apache-flink/. [40] Top Apache Spark Use Cases: Spark in the Real World at https://www.qubole.com/blog/big-data/apache-spark-use-cases/. [41] Apache Storm: Powered By at http://storm.apache.org/releases/current/Powered-By.html. [42] SQLstream Blaze and Apache Storm: A comparative performance, productivity and cost benchmark report at http://www.sqlstream.com/wpcontent/uploads/library/SQLstream-Blaze-Whitepaper-PerformanceBenchmark.pdf. [43] Jonathan Samosir, Maria Indrawan-Santiago, Pari Delir Haghighi. 2016 An Evaluation of Data Stream Processing Technologies for Data Driven Applications at http://www.sciencedirect.com/science/article/pii/S1877050916307116. [44] Benchmarking Streaming Computations at Yahoo! at https://yahooeng.tumblr.com/post/135321837876/benchmarking-streamingcomputation-engines-at. [45] Apache Kafka Documentation: Introduction at http://kafka.apache.org/documentation.html#introduction. [46] Apache Kafka Documentation: Topics and Logs at http://kafka.apache.org/documentation.html#intro_topics. [47] Apache Kafka Documentation: Producers at http://kafka.apache.org/documentation.html#intro_producers. [48] Apache Kafka Documentation: Consumers at http://kafka.apache.org/documentation.html#intro_consumers. [49] Apache Kafka Documentation: Distribution at http://kafka.apache.org/documentation.html#intro_distribution. [50] Apache Kafka Documentation: Guarantees at http://kafka.apache.org/documentation.html#intro_guarantees. 75
[51] Apache Kafka Documentation: Message Delivery Semantics at http://kafka.apache.org/documentation.html#semantics. [52] Apache Kafka at http://kafka.apache.org/. [53] Margaret Rouse, August 2012 In-Memory Database at http://whatis.techtarget.com/definition/in-memory-database. [54] Redis at http://redis.io/. [55] Using Redis as an LRU Cache at http://redis.io/topics/lru-cache. [56] Replication at http://redis.io/topics/replication. [57] Redis Sentinel Documentation at http://redis.io/topics/sentinel. [58] Yahoo! Benchmark for Evaluation of Data Stream Processing Technologies: Control batch script at https://bitbucket.org/triparna_dasgupta/yahoobenchmark-data-stream-processingtechnologies/src/6df9ca647507d8eadf8cc70bcd400301bbc59ed0/streambench.sh?fileviewer=file-view-default. [59] Yahoo! Benchmark for Evaluation of Data Stream Processing Technologies: Input Data Creation, Emission and Storage at https://bitbucket.org/triparna_dasgupta/yahoo-benchmark-data-streamprocessingtechnologies/src/6df9ca647507d8eadf8cc70bcd400301bbc59ed0/data/src/setup/ core.clj?at=master&fileviewer=file-view-default. [60] Apache Maven Project at https://maven.apache.org/. [61] Setting the Right Batch Interval at https://spark.apache.org/docs/1.6.1/streaming-programming-guide.html#settingthe-right-batch-interval. [62] Level of Parallelism in Data Receiving at http://spark.apache.org/docs/1.6.1/streaming-programming-guide.html#level-ofparallelism-in-data-receiving. [63] Approach 2: Direct Approach (No Receivers) at http://spark.apache.org/docs/1.6.1/streaming-kafka-integration.html. [64] Deploying Applications at http://spark.apache.org/docs/1.6.1/streamingprogramming-guide.html#deploying-applications. [65] Automatic Backpressure at http://storm.apache.org/2016/04/12/storm100released.html. [66] BackPressure at https://jaceklaskowski.gitbooks.io/mastering-apachespark/content/spark-streaming-backpressure.html. [67] Guaranteeing message processing at http://storm.apache.org/releases/0.10.1/Guaranteeing-message-processing.html. [68] NeXtScale nx360 M4 at 76
https://lenovopress.com/tips1051?cm_mc_uid=41940995188714665069758&c m_mc_sid_50200000=1466506975. [69] A comprehensive Analysis – Data Processing Part Deux: Apache Spark vs Apache Storm at https://www.linkedin.com/pulse/comprehensive-analysis-dataprocessing-part-deux-apache-fazelat.
77