Evaluation of Video Browser Features and User Interaction with VAST MM Alexander Haubold
Promiti Dutta
John R. Kender
Dept. of Computer Science Columbia University New York, NY 10027
Dept. of EHS Columbia University New York, NY 10032
Dept. of Computer Science Columbia University New York, NY 10027
[email protected]
[email protected]
[email protected]
ABSTRACT In this paper, we present extensive user studies on browsing and information retrieval in the domain of unstructured videos using the VAST MM video library browser. Our studies were performed over a 3-year period with more than 1,000 participants in the university setting. The majority of students use the video library for retrieval of student presentations in a large engineering design course. Through iterative analysis of context-specific audio, visual, and textual cues, we are able to measure significant improvements on typical retrieval tasks, such as searching for unfamiliar content in a large database with over 300 hours of video. We also present user studies conducted in two videotaped core computer science courses to measure the usefulness of the VAST MM (Video Audio Structure Text MultiMedia) resource for final exam preparation. We find that students who use the lecture video library experience significant improvement in final exam scores. To better compare video browsers featuring rich content cues to standard video players without cues, we have performed a large experiment to collect measurable data on search tasks. In general, the lack of index cues can be described by an inverse relationship between amount of matching video content and time required to find it. When index cues are available, the relationship is constant, that is, rare content is found in the same time as common content. We evaluate this data and provide additional insight into two common user interaction techniques: audio-visual browsing and visual-only browsing. We show that user preference is uniform, but that audio-visual browsing is significantly more effective for search and retrieval of video data.
Categories and Subject Descriptors H.3.4 [Information Storage and Retrieval]: Systems and Software – Performance evaluation, H.3.7 [Information Storage and Retrieval]: Digital Libraries – dissemination, H.5.1 [Information Interfaces and Presentation]: Multimedia Information Systems – evaluation/methodology, H.5.2: User Interfaces – graphical user interfaces (GUI).
Permission to make digital or hard copies of all or part of this work for personal or classroom use is granted without fee provided that copies are not made or distributed for profit or commercial advantage and that copies bear this notice and the full citation on the first page. To copy otherwise, or republish, to post on servers or to redistribute to lists, requires prior specific permission and/or a fee. MM ’08, October 26 – 31, 2008, Vancouver, British Columbia, Canada. Copyright 2008 ACM 978-1-60558-303-7/08/10…$5.00.
General Terms Measurement, Verification.
Design,
Experimentation,
Human
Factors,
Keywords Presentation video, video library, structure in videos, speaker segmentation, visual segmentation, text augmentation, transcript analysis, automatic speech recognition, speaker index, streaming video, evaluation, measures, user studies.
1. INTRODUCTION Video has become a mainstream production medium in many settings where traditionally other means of communication and archival of material were used. On-line and off-line libraries for video material are far outpacing the ability to perform effective information retrieval on this massive amount of data. In the university setting, for example, large video libraries of lecture and presentation videos are effectively unused due to the cost of manual indexing and the difficulty of automatic processing. Lecture videos are a common means of reaching distant-learning and increasingly also on-campus student, even though some critics worry about declining class attendance. Instructional videos have received much attention, and were investigated in passive [1] and invasive environments [2]. Structuring and indexing of content is performed using visual cues [1,3] and textual cues within [4], and across [5] lectures. Presentation videos have been investigated with much less rigor in the university environment, where they are used to record and evaluate student performance [6]. This genre has nonetheless found significant commercial appeal, in particular for recording and dissemination of conference and corporate presentations (MediaSite, Tri-Digital). Video indexing, search, and browser user interfaces have been investigated most rigorously for popular video genres, such as news videos. Informedia [7] and Físchlár [8] are two examples of systems among many others. These systems have been designed for highly edited audio-visual data, which exhibit known structure (e.g. well-delineated news stories) and carefully tuned cues (e.g. scene cuts, fades, etc.). Consequently, user interfaces for news videos tend to focus on highly segmented scenes based on video shots or stories. Lecture and presentation videos are dissimilar to news videos in many respects; for example, they are generally unstructured (topics are not well-delineated) and also unedited (few or no visual cuts). Indices and user interfaces must be sensitive to these characteristics.
Video player User login
Visual summary controls • Segmentation granularity • Temporal zoom • Temporal keyword/phrase clustering
Video category browser List of videos
Thumbnail keyframes Timeline
Personal bookmarks
Visual concept annotation tool
Text-based search
Speaker segments
Video comparison
Visual segmentation (events)
Video summary (shown here)
Filtered keywords/phrases
Keyword search result • Temporally aligned; color and placement emphasizerd descriptiveness/usage
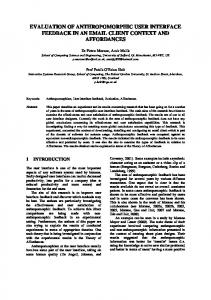
Personal bookmarks Public text annotations Figure 1: VAST MM video browser. Users can browse categories; search and view videos and their summaries; create public annotations and personal bookmark. Shown in this view is the browsable video summary for one video. Content from different modalities (thumbnails, speaker segments, keywords, etc.) are temporally (vertical) aligned. In prior work, we have introduced a practical video indexer and browser (VAST MM, see Figure 1), which we use to disseminate a large amount of unstructured lecture and presentation video information to students [6]. In an automatic indexing step, we extract visual, audio, and textual cues, including visual snapshots for video scenes (keyframes), speaker segments, and keywords and phrases from speech. Because these videos are unedited, visual segmentation is based on abrupt and gradual changes, modeling events such as presentation slide changes (abrupt) and camera zoom/pan (gradual) [6]. We use commercial speech-totext software (IBM ViaVoice) to generate highly inaccurate automatic transcripts without applying custom language or speaker models. The transcripts are filtered for keywords and phrases using an external text index, in our case student presentation slides and course textbook indices [9]. The VAST MM browser disseminates the browsable and searchable video library. A category browser groups videos by a manually designed taxonomy, a text-based search engine provides keyword and phrase search across all videos, and a detailed video summary visually lays out index cues from a video (see Figure 1). In addition to automatically extracted cues, the video browser makes available manual annotation tools, such as visual concept annotation, personal bookmarks and publicly accessible annotations temporally aligned to specific video content. For 3 years we have studied, evaluated, and improved video indexing methods and interactive browsing tools. Through extensive analysis of user interaction we were able to improve common tasks, such as searching for specific video content. We show that over a series of semesters and with the introduction of useful index cues, average time to complete search tasks for
previously unknown content drops from 436 to 128 seconds and successful completion of tasks increases from 57% to 97%.
2. BACKGROUND We use lecture videos produced semi-professionally by the Columbia Video Network (CVN). Videos are made available to off-campus and selectively also to on-campus students. Classroom lectures tend to be captured by dedicated camera operators in classrooms set up with professional audio-visual equipment. Presentation videos are produced more informally in typical classrooms by amateur camera operators. We have investigated student presentation videos from a large introductory engineering design course aimed in part at developing professional skills. Coursework requires student teams to hold two formal presentations each semester to report on their ongoing work to students, instructors, and clients. The videotaped presentations are used by instructors for archival, and by students to evaluate their own and peer performance. Additionally, archived material is used by students to research past project work. One of the main difficulties encountered by course staff is the effective dissemination of videotaped presentations. With more than 150 students per semester in more than 30 teams, manual duplication of videos is impractical and was, in fact, never performed. With the introduction of the VAST MM video library browser (Figure 1), the growing archive of videos is automatically indexed and is readily available for students and instructors. We administer user studies once or twice every semester to evaluate new and modified features and index cues. A user study typically consists of several search and retrieval tasks, which students complete using the VAST MM video browser, and which
are logged in great detail. Search-related tasks include finding familiar content, e.g. “find and mark your first appearance in the midterm presentation videos”, “find and mark your team’s discussion on functional requirements”; and finding unfamiliar content, e.g. “find the presentation on the design and construction of the wheelchair swing”. Summarization tasks include locating and formulating a general idea about a presentation from reading only the filtered keywords and phrases. In addition to these recurring tasks, we also include tasks directed at special implementations in a given semester. In evaluating the video face index [6], for example, we added a directed task on finding faces. In this paper, we report on a large collection of user studies, which were conducted to evaluate specific human interaction with the VAST MM browser for presentation videos (section 3), for lecture videos (section 4), and common human interaction with standard video players (sections 5 and 6).
3. PRESENTATION VIDEOS For over 3 years (6 semesters), we have administered user studies to measure overall performance changes of video search and retrieval using the VAST MM browser. We are able to attribute some of the improvements to specific index and user interface elements because changes to VAST MM were made incrementally. In this section, we report on some of the most interesting observations we have made.
3.1 Structure in Video Structure in information helps in the dissemination of ideas and in the understanding of otherwise massive and complex concepts. Especially when information is dense, like in a textbook or a technical paper, structure in the form of chapters, sections, and subsections are imposed to better organize the material. Tables of contents and alphabetized indices serve as fast retrieval methods. Structuring information in videos can benefit dissemination of its contents similar to how it works with books. This is particularly true of unstructured, i.e. unedited videos, such as presentation videos. In their unedited state, presentation videos feature several presentations back to back. A helpful structural cue for such a video would indicate transitions between presentations. With the addition of this cue, we are able to better describe a video’s content in a form equivalent to book chapters (presentations) and sections (individual presentation slides). To evaluate the added benefit of providing structure cues in presentation videos, we have built an audio-based detector to identify the clapping of hands, which generally marks the end of a presentation. The UI was then modified to provide a visual mark at each presentation transition so detected. Finally, we administered a user study to measure the utility of this information. In this study, we used an ablation method. Of the four most relevant sources of information (1. streaming video, 2. keywords/ phrases, 3. keyframes for each “scene” of near-constant visual similarity, and 4. presentation segmentation), participants were presented with only two of these cues to complete the user study; the remaining two cues were disabled. If we consider presentation segmentation and keyframes to be structural cues, and streaming video and text to be unstructured, we identify 4 interesting pairs to test: (1) structured: segmentation + keyframes; (2) semistructured: segmentation + video; (3) semi-structured: text + keyframes; and (4) unstructured: text + streaming video.
Table 1: Evaluation of search tasks performed with four variations of an index-cue driven browser: Keyframes + Presentation Segmentation, Keyframes + Text, Video + Pres. Seg., and Video + Text. Users who had access to features based on structure generally finish search tasks in the least amount of time. Table cells colored in green emphasize the best, while those colored in red point out the worst results. Participant sample size: Presentation Seg. Text
Keyframe 40 37
Video 39 40
Task: “Find the beginning of your first (or only) appearance in which you spoke during the presentation” Duration (sec) Presentation Seg. Text
Keyframe 31.78 38.94
Video 72.43 87.80
Task: “Find the beginning on your team's discussion on Functional Requirements” Duration (sec) Presentation Seg. Text
Keyframe 57.38 68.14
Video 125.77 106.58
Task: “Find the presentation on the in any of the provided videos” Duration (sec) Presentation Seg. Text
Keyframe 190.24 217.69
Video 348.70 353.22
Completion Presentation Seg. Text
Keyframe 68% 46%
Video 64% 46%
Task: “Summarize presentation X” Duration (sec) Presentation Seg. Text
Keyframe 59.95 48.59
Video 126.44 71.30
Participants were randomly assigned one pair of cues, and we ensured that the distribution was close-to-even. All participants in the user study were assigned the same search and summarization tasks. Results from our study suggest a strong correlation between time required to complete search tasks and the availability of structural cues (Table 1). In most cases, unstructured cues demand 100% more time for task completion. In the particularly difficult task of finding previously unfamiliar content, structural cues also help significantly with successful task completion. In each task, minimum time required for completion and maximum completion score involved key frames, while maximum time required and minimum score always involved streaming video. We also note that summarization is the only task that clearly benefits from the availability of text cues. However, this is also the only task that does not involve search. Interestingly, the presence of streaming video still increased the time required to complete this type of task.
Table 2: Task duration and completion as a function of availability of video playback. When video is not available, participants complete tasks significantly faster at equivalent completion rates. Video Streaming
Table 3: Average task duration and completion in user studies performed at home and in-class. Students are much more focused on completing tasks quickly in class.
No Video Streaming
Complet’n
Duration
Complet’n
Duration
Spr. ‘05
90%
84.81 s
91%
57.73 sec
Fall ‘05
89%
126.78 s
90%
103.67 sec
Spr. ‘06
89%
131.71 s
89%
75.82 sec
Prep. Actions
Completion
Duration
Fall 2006
In Class
949 sec
902
96%
107.18 s
Home
323 sec
108
89%
208.13 s
Fall 2007
In Class
668 sec
492
97%
148.38 s
Home
76 sec
33
76%
334.90 s
Effect of Availability of Streaming Video
Effect of various Face Indices 160
Task Duration (sec)
140
Task Duration (sec)
Prep. Time
120 100 80 60 40 20
140 120 100 80 60 40 20 0
0
Spring 2005
Fall 2005 Video
Spring 2006
No Video
Figure 2: Average task duration for user studies with and without the availability of video. Without video, participants complete tasks significantly faster.
3.2 The Availability of Streaming Video is Counterproductive Video is rich in redundant information, an observation that is exploited in the design of MPEG compression. In particular in the visual domain, many video scenes present the same information with only small changes in activity. In a series of three semester user studies, we have evaluated how this redundant information impacts the time required to complete directed search and retrieval tasks. For the completion of their user study, all participants had access to the same version of the VAST MM browser featuring browsable video summaries (keyframes). However, we enabled streaming video only for half of the participants. Tasks remain the same throughout. We observe that browsable video index cues are sufficient for successfully completing the search tasks, as demonstrated by a comparable completion measure (Table 2). Time required to complete the task, however, is significantly lower (by 20% - 40%) when streaming video is not available (Figure 2). We can attribute this difference to the “familiarity effect”. Anecdotally, we observe that when streaming video is available, students tend to make use of this more familiar medium. When streaming video is disabled, students are bound to explore the browsable video summaries.
3.3 Face Indices Save Time When videos feature several actors, it is not only important to represent what is being communicated, but also who is communicating and how often they appear. A presentation video may contain 20 or more students, speaking in variously sized time intervals and repetitions. To gain a better view of the actors in the video, we have introduced a visual face index, which can be used
Small Face
Two Small Faces
Find self appearance
Large Face
Two Large Faces
Find other person's appearance
Average
Figure 3: Time required for completion of face identification tasks. On average, more visual information, e.g. in the form of two large face images, speeds up task completion. to locate presentation segments based on speakers. The face index was implemented in four variations in which a speaker was represented by (1) an extreme close-up headshot, (2) extreme close-up head and profile shot pair, (3) a medium close-up headshot, and (4) a medium close-up head and profile shot pair. In our experiment, we have measured the time required to complete two tasks: finding themselves in the video collection, and finding a different student who they are unfamiliar with. On average, required search time decreases with increasing information content, in the order in which the face combinations are listed above. However, on an individual task basis, slight variations are apparent (Figure 3).
3.4 In-class Use is More Efficient Over a period of two semesters, we have evaluated the effect of participants completing their user study in a formal classroom setting versus a familiar home setting. While we expect students to conduct themselves very differently in these two settings, the measurable effect is not clear. A comparison shows that students in a classroom setting are likely to spend more preparation time familiarizing themselves with the browser. We note, however, that in-class user studies are also conducted with more rigorous organization, and some preparation is mandatory at the time when the administrator introduces the study. We observe a direct correlation between preparation time, and successful task completion and speed (see Table 3), discussed further in section 3.6. The dichotomy between in-class and at-home completion time is largely due to a shift in usage pattern closely related to the discussion in section 3.2. Students who completed the study at home commonly revert to streaming video and do not take
Effect of Preparation Time
Search Task Duration Preparation Time (sec)
Time in seconds
500 400 300 200 100 0
Fall 2005
Spring 2006
Fall 2006
Spring 2007
Fall 2007
800 700 600 500 400 300 200 100 0
Fall 2005
Spring 2006
Fall 2006 Incorrect
Successful Search Task Completion
Spring 2007
Fall 2007
Correct
Figure 5: Preparation time for correctly and incorrectly completed tasks. On average, the more preparation time precedes a user study, the more likely a user completes her tasks successfully.
100 80
%
60 40 20 0
Fall 2005
Spring 2006
Fall 2006
Spring 2007
Fall 2007
Figures 4a,b: Search task for unfamiliar content. Continual improvements to VAST MM result in higher successful completion and lower task duration. advantage of the summaries. In-class participants, however, were given an interactive demonstration of the tool, and were therefore prepared for use of the browsable summaries. Several other indicators confirm this hypothesis, including increased usage of keyframes in-class versus at-home, significantly more interaction with UI customization parameters in-class, etc.
3.5 VAST MM Improves Over Time Finding previously unfamiliar information is one of the most difficult video search tasks. For example, a verbal query for the desired content can prove unsuccessful if there is a mismatch in vocabularies. Likewise, dissimilarities between a user’s formulation of a visual query and the actual visual contents of a video can be equally misleading. For example, a “musical device for people with disabilities” can be interpreted as the picture of an iPod, drum set, jukebox, home stereo, etc., when in fact it can be software that specially interprets a standard PC keyboard. In our extensive user studies, we placed great emphasis on the performance improvement of such tasks over time. With constant updates to index cues and various search and user interface features in VAST MM, we were able to improve average completion times from 57% to 97%, and to lower average times required for these tasks from 436 seconds to 128 seconds (see Figures 4a,b). We note that for these results, we only consider user studies performed under similar conditions, i.e. in-class and with the availability of streaming video.
3.6 Users Improve Over Time We anticipated that a user’s familiarity with the VAST MM browser would lead to improvements in task performance. Not unlike the experienced web searcher, who selectively searches for text and images using various query styles, a user of VAST MM
should exploit different modalities to speedily complete a search task. While we have not tested this hypothesis extensively, we find a correlation between familiarity and inexperience as measured by the preparation time before a user engages in a user study. On average, users who spent more time preparing are more likely to successfully complete a task. Figure 5 demonstrates the improvement for each semester’s user study, by comparing average preparation time for all successfully versus unsuccessfully completed tasks. These results consider only search tasks and not summarization tasks, which appear to be more sensitive to nonvisual cues.
3.7 Cues Improve Time of Task Completion We determine what features of the VAST MM browser are most effective for successful completion of user studies. Under the assumption that the data obtained for the various features (variable X) in conjunction with task duration (variable Y) follows a parametric distribution, we apply the Pearson productmoment correlation coefficient [12]. In evaluating useful cues, we find significant correlations to task duration for the following features at α = 0.05. In all user studies: • Skimming of high-quality keyframes • Viewing streaming video • Zoom activity (changing amount of content displayed) • Low zoom, i.e. zoomed out (displays more information) In some of the user studies we found: • Scene segmentation activity, i.e. sensitivity of visual change (changes number of thumbnail keyframes displayed)
4. LECTURE VIDEOS We have made available the VAST MM browser, after three years of improvements, to students from two core computer science courses in the fall 2007 semester for their final exam preparation to measure a potential impact of the tool on course study. The courses include “Computer Architecture” and “Programming Languages and Translators” with a distribution of undergraduate and graduate students, most of whom major in Computer Science. Lecture videos are typically available only to long-distance students, and therefore, participants would not have had access to the videos otherwise. We introduced the tool 1-2 weeks before the final exam, so that students had access to the resource during their reading period. Limited instructions of the tool’s features were given in a short in-class demonstration.
Figures 6a,b: Midterm-to-Final exam grade improvements for students who have used the VAST MM resource (left) and students who have not (right). Average improvement is 0.29 standard deviations in the presence of VAST MM and -0.07 in its absence. The absolute difference is one third of a standard deviation.
We compute a normalized difference in midterm exam scores and final exam scores to create a measure of improvement. In this aggregation, we include all students, regardless of their participation. The normalized measure is computed in terms of difference of standard deviation from the mean for each exam:
µ midterm σ midterm αi µ final σ final βi
Mean of midterm exam grades, all students Standard deviation of midterm exam grades
Usage above 20 minutes 2
Improvement (STD)
While all students had access to the tool, participation was entirely voluntary, and of the 142 students from both courses, 91 (64%) did not attempt using it at all. There are several reasons for the lack of participation: students who are predominantly visual learners may prefer using written material; participation was not mandatory; students who attend lectures may not find it beneficial to review audio-visual material.
1.5 1 0.5 0 -0.5 -1 -1.5 -2
0
50000
100000
150000
200000
Total amount of time spent with VAST MM (sec)
Figure 7: Exam grade improvement as a function of usage for students who have used VAST MM for more than 30 minutes. Green points represent an improvement (up to 2 STD), while red points demonstrate a decline in score (at most 1 STD).
Midterm exam grade for student i Mean of final exam grades, all students Standard deviation of final exam grades Final exam grade for student i
∆ improvement
β − µ final α i − µ midterm = i − σ final σ midterm
Using ∆improvement values we are able to test statistically whether the use of the VAST MM browser had any significant effect on the improvement of student’s performance. Figures 6a,b present distributions of exam difference for the two groups of participants. On average, non-VAST MM users experience a slight drop of 0.07, whereas VAST MM-users improve by 0.29 standard deviations. The data presented here is representative only of student who have used the tool for more than 30 minutes. We determine that duration of usage is a strong indicator for improvement. At α=0.05 and using a two-tailed Pearson’s correlation, we observe a significant positive trend between duration of VAST MM use and improvement in grade: r=0.169
(N=25) for students who used the tool more than 30 minutes, and r=0.301 (N=51) for all participants. Figure 7 graphically summarizes the time students spent using VAST MM versus their improvement and decline in exam scores. We apply another Pearson's correlation test to determine VAST MM browser features correlated to grade improvement. We observe strong correlations at α=0.05 for the following features: • Skimming of keyframes • Zoom activity • Scene segmentation activity • Text context activity (changing clusters of keywords and phrases) • Viewing streaming video • Selecting videos from library • Low segmentation value (i.e. larger number of thumbnails displayed for skimming) It is generally difficult to measure the isolated effect of one variable in the presence of many unaccounted ones. As such, the demonstrated improvement of exam scores for students using the VAST MM tool could be attributed to other effects, such as extensive study from textbooks and notes. However, because we
Table 4: Distribution of search tasks and their matching video content. The entire video library contains 611,388 seconds of video material. Search tasks were designed to measure search for rare and common content. (* Note that the percentage of audio-visual data providing sufficient cues for task completion is much lower than the percentage of library content.)
Project Category
Specific Client
Specific Presentation
Type of Search
Search task “Find video content for presentations of or relating to …”
Time (sec) of Video Content
Percentage of Library Content (*)
Musical Device for People with Cerebral Palsy
1,860
0.3
Coogan's Restaurant - Food Waste to Energy
1,860
0.3
CU Study Away - A Website for the Study Abroad Program
2,160
0.4
The MTA (Metropolitan Transportation Authority)
3,600
0.6
The 125th Street BID
7,200
1.2
Dr. Gil Lopez of CMSP Math Scales
14,400
2.4
Information Technology (Web sites, Database projects, Handheld devices, etc.)
106,200
17.4
Architectural Design (e.g. Lab space design, Office design, etc.)
117,000
19.1
Disabilities
223,200
36.5
compare two exam study periods in our evaluation, one with and one without the availability of video resources through VAST MM, we can eliminate bias caused by several external factors. Under the assumption that students did not alter their fundamental study patterns between midterm and final exams, we can conclude that the use of VAST MM for video reviews was beneficial.
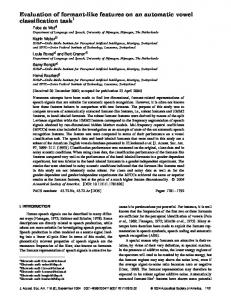
5. INDEX-CUE BROWSING: AN ORDER OF MAGNITUDE BETTER Standard video players, whether on-line or off-line, offer little beyond player controls of play, pause, stop, and a timeline-based location slider. While highly edited entertainment media tends to be played back by their audience without the need for more advanced features, videos in other genres, like presentation or instructional videos require tools for retrieval of specific content. For example, a typical university lecture encompasses more than 40 hours of video material, which is an unwieldy amount of information to search through. Audio, visual, and textual cues are necessary to provide searchable and browsable indices for larger video databases; without such cues, video material remains a cumbersome medium to use compared to the text-driven WWW. To better understand user interaction with the prevailing standard video players and to provide a baseline measure for comparison to index-cue driven browsers, we have set-up a user study with 137 participants, 79 of whom used a standard video player, and 58 of whom used a cue-driven video browser. All participants were given the same 9 search tasks in randomized order, and the same video dataset containing 204 student presentation videos with altogether 170 hours of audio-visual material (about 18 million video frames). We have established beforehand that each task contains relevant matching material in the database. Students were given 30 minutes to complete as many of the tasks as possible. The standard video player (an ablation of the browser shown in Figure 8) includes the features play, pause, stop, as well as a location slider to quickly move to any position in the video. Additionally, the location slider provides a visual fast-forward view of keyframes as the knob is moved to another position. Using this control, the user is able to view the entire video in a
Figure 8: Index-cue driven browser featuring a list of textsearchable (filtered and raw ASR) videos, video player, and browsable video summaries with audio, visual, and textual cues. Users can interactively change the amount and specificity of information in the video summary via various sliders. The standard video player used in the user study featured only a list of videos and a video player. Text-based search and browsable video cues were not available to the users. matter of seconds. For practical implementation, keyframes are cached during video loading to ensure seamless browsing of this visual data; while not available in many video players, this feature was implemented to simulate the state-of-the-art in video players. The video player is embedded in an application that lists the entire video collection by titles, e.g. “Final Presentation, Section 1, Fall 2004, Tape 2”, etc. Without search features, the user must randomly select and browse videos in search for a task’s matching content. We thereby simulate a situation in which the user has access to a directory of videos without content-defining cues. The index-cue driven browser features searchable and browsable indices in addition to the features of the standard video player (Figure 8). Raw and filtered [9] automatic transcriptions are used
Search for less-rare content
Search for common content
35
35
30
30
30
5
5
21 00
90 0
Task Duration
Task Duration
Task Duration
15 00
0
21 00
90 0
15 00
54 0
42 0
30 0
18 0
60
0
21 00
15 00
90 0
42 0
54 0
30 0
18 0
60
0
10
0
0
0
15
54 0
5
10
20
42 0
10
15
25
30 0
15
20
60
20
25
18 0
25
# attempted tasks (norm)
35 # attempted tasks (norm)
# attempted tasks (norm)
Search for rare content
Figure 9a-c: Search task results for standard video players. With the exception of finding common content, video players are ineffective for search and retrieval. Top shaded portion of each bar indicates unsuccessful, bottom shaded successful searches. Search for less-rare content
Search for common content 35
30
30
5
Tas k Duration
5
Tas k Duration
21 00
90 0
15 00
0
15 00
21 00
90 0
54 0
42 0
30 0
18 0
21 00
15 00
90 0
42 0
54 0
30 0
18 0
60
0
10
0
60
0
0
15
54 0
5
10
20
42 0
10
15
25
30 0
15
20
18 0
20
25
60
25
# attempted tasks (norm)
35
30
# attempted tasks (norm)
35
0
# attempted tasks (norm)
Search for rare content
Tas k Duration
Figure 10a-c: Search task results from an index-cue driven browser. Index cues are useful for finding video content regardless of number of matching video clips. Top shaded portion of each bar indicates unsuccessful, bottom shaded successful searches.
Search tasks are designed to span a wide spectrum of information contained in the student presentation videos, in order to provide comprehensive search criteria for rare versus common content, as outlined in Table 4. (The equivalents to rare and common content in the TRECVID news video domain are, for example, the visual concept “prisoner”, which occurs very rarely, and the visual concept “person”, which occurs very frequently.) For example, to find the presentation of a specific one-semester student project is considered a rare search – out of 170 hours of video, only 30 minutes of video count towards the correct answer. A search task to find a specific project client, who has supervised multiple projects over a series of semester, can be answered by any one of multiple instances of video content. Finally, to search for a specific category of project can be answered by as much as 36.5% of all video content, due to the breadth of specific project categories. However, matching content in the video database is not equivalent to the actual audio-visual data which provides sufficient cues to complete a task. These cues, either from presentation slides or spoken content, occur at much lower frequency, which we have not specifically measured.
5.1 Comparison between standard video players and index-cue driven browsers Without searchable and browsable cues in video browsers, the time required to locate specific content grows inversely to the
Task Time: Index-cue driven browser vs. video player
Task Time (sec)
as a searchable medium, while browsable visual cues, including thumbnail images, speaker segments, and filtered keywords and phrases are displayed alongside the video player. The index-cue driven browser is embedded in an application similar to the standard video player, listing the entire video collection by title.
1600 1400 1200 1000 800 600 400 200 0 0.1
1
10
100
Matching Video Content (%) Index-cue driven browser
Standard video player
Fit to power law
Fit to constant
Figure 11: Required time to complete a search task depends highly on available cues. With a standard video player, search time is inversely proportional to matching content, while an index-cue driven browser offers near linear search time. amount of video content that matches the query. A video browser with the salient cues, however, should show a near-constant amount of time required to locate content of varying recurrence, a phenomenon which we can document (see Figure 11). As anticipated, a standard video player is ineffective for those search tasks which seek very unusual matching content. Figures 9a and 9b show that of all attempted tasks, the majority of them failed. When completed successfully, the average time required exceeded 10 minutes. However, a search task aimed at locating
Figure 12: Distributions for duration of video clips viewed during Figure 13: Distributions for time skipped between video clips Audio-Visual Browsing (blue) and keyframes viewed during Visual- during Audio-Visual Browsing (blue) and time skipped between only browsing (red). While their temporal scales are different by a keyframes during Visual-only browsing (red). The usage pattern factor of 10, viewing patterns are the same. is the same for both approaches, with the temporal scale varying by a factor of two. common information with more than 15% of the corpus satisfying this task was typically completed successfully at reasonable speed with the same standard video player (see Figure 9c). Most significantly, when an index-cue driven browser was available to perform the same search tasks, completion and required time remain comparable throughout, regardless of difficulty (see Figure 10a-c). Overall completion rates exceed 70% as compared to 33%, and average required time of 110 seconds is also significantly lower than 646 seconds for standard video players.
Table 5: Audio-visual versus visual browsing. Their preference among users is uniformly distributed. However, audio-visual browsing tends to outperform visual-only browsing in search tasks. Users
Attempted Tasks
Task Time
Correct Answers
Audio-Visual
39
97
531 sec
36
Visual-only
40
56
846 sec
15
6. THE RIGIDITY OF BROWSING STYLE Search and retrieval using standard video players without any index cues is as expected inefficient. Students applied a variety of strategies to perform the search tasks, given the plain list of videos with only titles hinting at the semester in which they were shot. Strategies included random selection of videos; selection of only midterm or only final presentation videos, since project presentation content is similar in both of these course milestones; skipping entire years of presentations because they exhibited only one or two task-unrelated categories. The video player provided to students offered two methods of browsing video content. The “audio-visual” method reflects a sequence of video clip playbacks and temporal skips. The “visual” method is based solely on fast keyframe skimming, in which little or no video, and no audio playback take place. We observe that students generally adhere to only one of these approaches during the user study; 50% of students prefer audio-visual browsing, while the other half prefers visual browsing. However, the number of attempted and correctly completed tasks is significantly higher, and task duration is lower, for audio-visual browsing (see Table 5). The advantage of audio-visual browsing is likely due to additional cues from audio, whereas strictly visual presentation material is sometimes too terse of a representation. Using the data from user studies on standard video players we are able to qualify the user interaction during search and retrieval
tasks. Audio-visual browsing can be described as the repetitive event of listening and viewing video clips of some duration then skipping a certain amount of time to the next video clip. We found no significant correlation between these two steps, that is, the amount of video viewed does not predict amount of video skipped. We summarize the unrelated distributions of length of video clip viewed and duration of video skipped in Figures 12 and 10 (blue lines). Most users view between 1 and 8 seconds of video then skip forward between 30 and 300 seconds or backwards between 30 and 60 seconds. Visual browsing can be described as the repetitive event of viewing a keyframe then visually skimming a set of them at higher speed to the next keyframe of interest. Measuring what keyframes the user viewed and which were skimmed quickly is not well defined. Depending on the user’s cognitive abilities, the content of a keyframe can be visually processed in less than 100 milliseconds. According to the empirical evaluation reported in [10], a person can read as many as 600 words per minute in a flashcard setting, which, on average, is one word every 100 ms. Similar results were found in [11] for recognizing objects in scenes, e.g. “animals”. Subjects were able to identify scene objects within 20 ms and process the information within an additional 150 ms when previously unseen photographs were flashed before them. Based on these evaluations, we consider a keyframe skipped if it was viewed in less than 200 ms. This
duration is enough to read two words from a keyframe if it contains a presentation slide. Figures 12 and 13 (red lines) present the distributions for duration of keyframe viewed and temporal distance between keyframes skipped. Most users view a keyframe in less than 0.5 seconds before skipping forward to the next keyframe between 50 and 200 seconds or to a previous keyframe up to 50 seconds backwards. We observe that the temporal distance skipped between video content is similar between the two browsing approaches. However, the duration during which content is viewed differs between audio-visual and visual-only browsing. These results indicate that visual-only browsing occurs at much higher speeds. Nevertheless, it is insensitive to potentially important content only available in audio material, leading to lower scores.
7. CONCLUSION
video’s intended use and purpose and will likely encompass different tasks and measures.
8. REFERENCES [1] Mukhopadhyay, S., and Smith, B. Passive capture and structuring of lectures. In Proc. of the ACM International Conference on Multimedia (Orlando, FL, Oct. 30 – Nov. 5, 1999). MM ’99. ACM Press, New York, NY, 477-487. [2] Abowd, G.D., Atkeson, C.G., Feinstein, A., Hmelo, C., Kooper, R., Long, S., Sawhnet, N., and Tani, M. Teaching and Learning as Multimedia Authoring: The Classroom 2000 Project. In Proc. of the ACM International Conference on Multimedia (Los Angeles, CA, Oct. 30 – Nov. 3, 2000). MM ’00. ACM Press, New York, NY, 187-198. [3] Haubold, A., and Kender, J.R. Analysis and Interface for Instructional Video. In Proc. of the IEEE International Conference on Multimedia & Expo (Baltimore, MD, Jul. 6-9, 2003). ICME ’03. IEEE Press, New York, NY, 704-708.
We have reported on a variety of extensive user studies in video browsing, search, and retrieval. In experiments designed to measure the impact of index-enabled, searchable, and browsable video interfaces, we demonstrate the significant drawbacks of standard video players and libraries. We identify two typical interaction patterns: audio-visual browsing, which refers to a playback-and-skip methodology, and visual-only browsing, by which users quickly skim video content by means of keyframes. While audio-visual browsing is a much slower process, it is more effective for search and retrieval. We can therefore deduce that audio-derived cues are equally as important as visual cues in browsable video summaries.
[4] Lin, M., Nunamaker, J.F., Chau, M., and Chen, H. Segmentation of Lecture Videos based on Text: A Method Combining Multiple Linguistic Features. In Proc. of the 37th Hawaii International Conference on System Sciences (Big Island, HI, Jan. 5-8, 2004). HICCS ’04. IEEE Computer Society Press, New York, NY, 3-11.
In user studies aimed at evaluating the continual index and interface changes applied to VAST MM, we show how a combination of multi-modal cues result in significant improvements to search and retrieval. We were able to consistently increase successful completion of tasks and lower their required time. Finally, we show in two user studies how VAST MM can become a useful tool for course study. On average, students who have used the tool during final exam preparation experience an improvement over their midterm grades, unlike those students who chose not to participate.
[6] Haubold, A. Kender, J.R. VAST MM: Multimedia Browser for Presentation Video. In Proc. of the ACM Conference on Image and Video Retrieval (Amsterdam, The Netherlands, Jul. 9-11, 2007). CIVR ’07. ACM Press, New York, NY 4148.
While our indexing and content browsing approaches were evaluated for lecture and presentation videos, they are generally applicable to unstructured and semi-structured videos. Visual segmentation and cue extraction were designed to capture a variety of common abrupt and gradual visual events. Speaker segmentation is equally as applicable to other video genres. However, keyword and key phrase filtering requires an appropriate vocabulary representative of each video. We have successfully experimented with mapping presentation videos to presentation slides, lecture videos to course text book indices, and also audio lectures to external course material, such as research journal articles. Videos of different genres necessarily need text corpora that best cover their content. However, with increasing manual editing and structuring such as exhibited in television entertainment and news, the automatic segmentation and multi-modal cue extraction tools demonstrated here become less relevant. Domain-specific vision and audio analyses that are better tuned to known scene structure are better suited to such video content. Similarly, our performance measures have been specifically designed for content retrieval from presentation videos. Such metrics are highly dependent on a
[5] Haubold, A., and Kender, J.R. Analysis and Visualization of Index Words from Audio Transcripts of Instructional Videos. In Proc. of the IEEE International Workshop on Multimedia Content-based Analysis and Retrieval (Miami, FL, Dec. 15, 2004). MCBAR ’04. IEEE Press, New York, NY, 570-573.
[7] Christel, M. and Martin, D. Information Visualization within a Digital Video Library. In Journal of Intelligent Information Systems, Volume 11, Number 3 (1998). 235-257. [8] Lee H. and Smeaton, A.F. Designing the User Interface for the Físchlár Digital Video Library. In Journal of Digital Information, Volume 2, Issue 4 (May 2002). [9] Haubold, A. Selection and Ranking of Text from Highly Imperfect Transcripts for Retrieval of Video Content. In Proc. of the ACM SIGIR Conference on Research and Development in Information Retrieval (Amsterdam, The Netherlands, Jul. 23-27, 2007). SIGIR ’07. ACM Press, New York, NY, 791-792. [10] Yu, D., Cheung, S.H., Legge, G.E., and Chung S.T. Effect of letter spacing on visual span and reading speed. In Journal of Vision, Vol. 7, Nr. 2, Article 2 (Feb. 2007). 1-10. [11] Thorpe, S., Fize, D., and Marlot C. Speed of processing in the human visual system. In Nature, Volume 381, (6 Jun. 1996). 520-522. [12] Walpole, R.E., Myers, R.H., Myers, S.L., Ye, K. Probability and Statistics for Engineers and Scientists, 7th Edition, 2002. Prentice Hall, New Jersey.