force platform in athletes specializing in strength and power events (6 elite weight-lifters and 16 ... Vertical jumping on a force platform has been suggested.
Journal of Sports Sciences, 2001, 19, 99–105
EVects of external loading on power output in a squat jump on a force platform: A comparison between strength and power athletes and sedentary individuals TARAK DRISS,1,2 HENRY VANDEWALLE,3* JACQUES QUIÈVRE,3 CHRISTIAN MILLER3 and HUGUES MONOD1 1
Laboratoire de Physiologie du Travail et du Sport, Faculté de Médecine Pitié-Salpêtrière, Université Paris VI, Paris, UFR STAPS, Université Paris X, Nanterre and 3Département des Sciences du Sport, Institut National du Sport et de l’Éducation Physique, Paris, France 2
Accepted 5 September 2000
The aim of this study was to determine the eVects of external loading on power output during a squat jump on a force platform in athletes specializing in strength and power events (6 elite weight-lifters and 16 volleyball players) and in 20 sedentary individuals. Instantaneous power was computed from time–force curves during vertical jumps with and without an external load (0, 5 or 10 kg worn in a special vest). The jumps were performed from a squat position, without lower limb counter-movement or an arm swing. Peak instantaneous power corresponded to the highest value of instantaneous power during jumping. Average power throughout the push phase of the jump was also calculated. A two-way analysis of variance showed signiWcant interactions between the load and group eVects for peak instantaneous power (P < 0.01) and average power (P < 0.001). Peak instantaneous power decreased signiWcantly in sedentary individuals when moderate external loads were added. The peak instantaneous power at 0 kg was greater than that at 5 and 10 kg in the sedentary individuals. In contrast, peak instantaneous power was independent of load in the strength and power athletes. Mean power at 0 kg was signiWcantly lower than at 5 kg in the athletes; at 0 kg it was signiWcantly higher than at 10 kg in the sedentary males and at 5 and 10 kg in the sedentary females. In all groups, the force corresponding to peak instantaneous power increased and the velocity corresponding to peak instantaneous power decreased with external loading. The present results suggest that the eVects of external loading on peak instantaneous power are not signiWcant in strength and power athletes provided that the loads do not prevent peak velocity from being higher than the velocity that is optimal for maximal power output. Keywords: ergometry, force platform, jumping, maximal anaerobic power.
Introduction Vertical jumping on a force platform has been suggested for estimating maximal anaerobic power. However, the speed and force of the movement must be matched for the production of optimal power output during a vertical jump (Davis and Young, 1984). In isolated muscle, maximal power corresponds to the optimal conditions for velocity and resistance (Fenn and Marsh, 1935; Hill, 1938). In humans, Wilkie (1950) reported * Address all correspondence to Henry Vandewalle, Département des Sciences du Sport, Institut National du Sport et de l’Éducation Physique, 11 Avenue du Tremblay, F-75012 Paris, France.
similar results for monoarticular movements, such as elbow Xexion. This is also true for polyarticular movements, such as isokinetic cycling (Sargeant et al., 1981), cranking (Vandewalle et al., 1983, 1989) and cycling (Nakamura et al., 1985; Vandewalle et al., 1985, 1987; Seck et al., 1995; Buttelli et al., 1996), on a friction-loaded ergometer. According to Caiozzo and Kyle (1980), power output increased with external loading when measured during running upstairs. Similarly, Kitagawa et al. (1980) found that excess fat in obese men induced an increase in power output in running upstairs. The opposite eVect of external loading was reported in a study of power output during a vertical jump with
Journal of Sports Sciences ISSN 0264-0414 print/ISSN 1466-447X online © 2001 Taylor & Francis Ltd http://www.tandf.co.uk/journals
Driss et al.
100 a counter-movement in children and sedentary males (Davies and Young, 1984). These authors concluded that the addition of an external load to body weight led to a decrease in peak instantaneous power proportional to that load and that ‘body size and speed of movement in children and young adults would appear to be optimally matched for the production of lifting work during vertical jumping’. The eVects of external loading should theoretically depend on strength. It is possible that the participants in the study of Davies and Young were not strong or were slightly overweight because of excess adipose tissue; consequently, their body weight alone might have corresponded to a resistance high enough for the production of maximal power. On the other hand, in very strong and lean individuals, body weight may be lower than the optimal resistance for power output and the eVects of external loading could have been diVerent. However, the validity of the results of Davies and Young (1984) has been questioned. Davies and Young (1984) unexpectedly concluded that ‘with external loading the force exerted on the platform remains constant and W [power] declines pari passu with the change in velocity’. Moreover, power output in their study was lower than previously found for sedentary individuals in the same laboratory (Davies and Rennie, 1968; Davies, 1971) or in other laboratories in similar individuals (Grassi et al., 1991; Ferretti et al., 1992, 1994). Bosco et al. (1982) assessed the eVects of external loading using barbells on the shoulders (from 15 to 220% of body weight) on average power output during squat jumps and counter-movement jumps. The eVect of external loading on average power depended on the individual. Average power was independent of external loading in one participant but decreased with increasing load in the other two participants (Bosco et al., 1982). However, their computational procedures were not clearly explained and their results have been questioned. Power output during a vertical jump is equal to the sum of power produced at the trunk, hip, knee and ankle. The additional loads used by Bosco et al. (1982) were not distributed on the trunk and legs but located on the shoulders. The addition of heavy barbells (>100% of body weight) on the shoulders should modify the knee and hip articular angles before and during jumping. This protocol should generally modify the respective parts of the diVerent muscle groups (erector spinae, gluteus maximus, hamstrings, quadriceps and plantar Xexors) in terms of power output and the motor pattern during jumping. Moreover, only the eVect of external loading on average power output during diVerent vertical jumps (squat jump, counter-movement jump) was reported, not the eVect on peak power output. The aim of the present study was to determine the eVects of physical activity and external loading on power output during vertical jumps performed on a force
platform. Peak and average power output were assessed among strength and power athletes and sedentary individuals during vertical jumps with and without additional loads. In contrast with previous studies, the vertical jump was a squat jump (vertical jump without counter-movement) and the loads were distributed on the trunk.
Methods Participants There were three experimental groups: (1) a group of strength and power athletes consisting of 16 male volleyball players from a district and a national league and six male weight-lifters of the French national team; (2) a group of 10 sedentary males; and (3) a group of 10 sedentary females. The physical characteristics of the participants are shown in Table 1. Percent body fat was determined according to Durnin and Womersley (1974). Experimental procedures Maximal instantaneous muscle power was determined during standardized vertical jumps with both legs, performed on a Kistler force platform according to the protocol of Ferretti et al. (1987). The force platform was linked to the data acquisition card of a PC Dell/Phoenix Pentium 100 microcomputer. Force data were sampled at 200 Hz before, during and after a jump for a total of 3 s. The jump was performed from a squat position with the heels on the platform and the thighs in a horizontal plane, corresponding to knee angles of about 75°. To avoid the possible eVects of negative work (Luhtanen and Komi, 1978; Ferretti et al., 1987), lower limb counter-movement and swinging of the arms were not allowed; the participants grasped the collar of their shirts with their hands. The external loads consisted of Xat steel weights distributed over the trunk using a special vest. The participants jumped with no load (0 kg) or an external load of 5 or 10 kg. After a warm-up, they performed seven vertical jumps at each load (0, 5 and 10 kg) with 90 s between jumps in random order, with one-third of them each starting with 0, 5 or 10 kg. The Wrst two jumps served as practice jumps; thus the forces exerted on the platform were recorded for Wve or seven jumps only at each load. Instantaneous velocity (v) was obtained by time integration of the instantaneous acceleration (a); that is, the force exerted on the platform (F ) minus body weight (BW ) divided by body mass (m):
E
t
E
t
v = a dt = (1/m) (F - BW ) dt 0
0
External loading and power output in squat jumping
101
Table 1. Physical characteristics of the strength and power athletes and of the sedentary males and females (mean ± s)
Athletes (n = 22) Sedentary males (n = 10) Sedentary females (n = 10)
Age (years)
Body mass (kg)
Height (m)
Body fat (%)
20.9 ± 3.1 27.4 ± 2.6 23.0 ± 3.7
75.1 ± 9.8 72.2 ± 11.2 64.9 ± 6.7
1.77 ± 0.12 1.80 ± 0.13 1.66 ± 0.05
12.3 ± 2.5 14.9 ± 4.4 28.9 ± 4.8
Table 2. Power outputs in the diVerent load conditions (mean ± s) Load (kg)
Peak power (W · kg-1)
Mean power (W · kg-1)
Athletes
0 5 10
55.8 ± 8.1 56.7 ± 7.8 56.0 ± 7.6
24.9 ± 4.9 25.8 ± 4.8 25.4 ± 4.6
Sedentary males
0 5 10
43.2 ± 6.0 41.9 ± 5.2 41.2 ± 5.6
19.7 ± 2.3 18.9 ± 2.0 18.1 ± 2.2
Sedentary females
0 5 10
33.3 ± 8.2 32.1 ± 7.9 31.6 ± 8.3
15.5 ± 3.6 13.9 ± 3.6 14.1 ± 3.9
Instantaneous power output ( p) was calculated as the product of F and v. Peak instantaneous power output ( ppeak) corresponded to the highest instantaneous power output before take-oV at each load. Mean power ( p¯ ) throughout the push phase of the jump was calculated by integrating the time–power curve for p > 0.02 Ppeak and dividing by the integration time. The velocity and the force corresponding to peak power and the velocity at take-oV (vT) were calculated. For each external load (0, 5 and 10 kg), the best trial was that corresponding to the highest peak instantaneous power. The velocity at peak power, the force at peak power, peak velocity and peak force, which are represented in the Wgures and tables, correspond to those recorded as the best trial at each load. For each participant, the values recorded at each of the three loads (0, 5 and 10 kg) were compared to determine the trial with the highest peak power and the velocity at peak power corresponding to this trial (i.e. the velocity at the highest peak power). The results were analysed using two-way analysis of variance (ANOVA) for repeated measures on the second factor (load); that is, a two-way ANOVA with one between-individuals factor (three groups) and one within-individuals factor (0, 5 and 10 kg loads). This ANOVA was followed by a Student-NewmanKeuls test for multiple comparisons. All statistical tests were processed using Sigma-Stat Software ( Jandel ScientiWc, Erkrath, Germany).
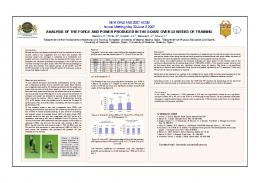
Fig. 1. Relationships between peak power and load expressed as a percentage of body weight (mean ± sx¯) in the diVerent groups: VB + L = volleyball players and weight-lifters; ME = sedentary males; WO = sedentary females.
Results Values of peak instantaneous power and mean power in the diVerent loading conditions are reported in Table 2 and Fig. 1. The interactions between the load and group eVects were signiWcant for peak instantaneous power (F4,78 = 3.82, P = 0.007) and mean power (F4,78 = 7.18, P = 0.001). The eVects of load (F2,78 = 6.55, P < 0.002) and of group (F2,39 = 39.2, P < 0.001) were signiWcant for peak instantaneous power. In both sedentary males and females, peak instantaneous power at 0 kg was
Driss et al.
102 Table 3. EVects of external loading on the diVerent indices of force and velocity before take-oV (mean ± s)
Load (kg)
Peak force (N)
Force at peak power (N)
Athletes
0 5 10
1675 ± 241 1721 ± 235 1776 ± 261
1607 ± 233 1652 ± 220 1702 ± 244
Sedentary males
0 5 10
1374 ± 199 1410 ± 183 1459 ± 199
Sedentary females
0 5 10
1134 ± 93 1182 ± 101 1207 ± 110
Velocity at peak power (m · s-1)
Velocity at take-oV (m · s-1)
2.87 ± 0.25 2.83 ± 0.23 2.71 ± 0.21
2.60 ± 0.23 2.56 ± 0.21 2.46 ± 0.20
2.70 ± 0.26 2.65 ± 0.25 2.54 ± 0.24
1325 ± 196 1365 ± 177 1410 ± 200
2.46 ± 0.25 2.38 ± 0.17 2.26 ± 0.19
2.33 ± 0.21 2.19 ± 0.17 2.09 ± 0.17
2.36 ± 0.24 2.19 ± 0.18 2.07 ± 0.20
1098 ± 93 1134 ± 100 1163 ± 118
2.18 ± 0.41 1.95 ± 0.33 1.87 ± 0.34
1.93 ± 0.31 1.80 ± 0.31 1.73 ± 0.32
1.90 ± 0.39 1.74 ± 0.37 1.64 ± 0.38
signiWcantly higher than at 5 and 10 kg; in contrast, the diVerences in peak instantaneous power at 0, 5 and 10 kg were not signiWcant in the strength and power athletes. Similarly, diVerences between the groups (F2,39 = 27.6, P < 0.001) and the eVect of load (F2,78 = 6.37, P < 0.003) were signiWcant for average power. In the strength and power athletes, mean power at 5 kg was higher than at 0 kg, in contrast with the sedentary individuals. In sedentary males, mean power at 0 kg was signiWcantly higher than at 10 kg. In sedentary females, mean power at 0 kg was signiWcantly higher than at 5 and 10 kg. There was no interaction between load and group for peak force or the force at peak power (0.73 < F4,78 < 0.86, P > 0.05). Peak force and the force at peak power increased with increasing loading (53.6 < F2,78 < 54.4, P < 0.001) and were signiWcantly diVerent between groups (25.3 < F2,39 < 25.9, P < 0.001). Both were higher in the athletes than in the non-athletes. In the athletes, the increases in both forces were almost equal to the external loading (Table 3). The group eVect (F2,39 = 35.4, P < 0.001), the load eVect (F2,78 = 152.6, P < 0.001) and the interaction between the two (F4,78 = 6.66, P < 0.001) were signiWcant for take-oV velocity. Similar results were observed for peak velocity (F4,78 = 2.96, P < 0.03; F2,39 = 37.5, P < 0.001; F2,78 = 40.4, P < 0.001). For all loads, the take-oV and peak velocities were higher in the athletes than in the non-athletes (P < 0.001). The group eVect (F2,39 = 34.6, P < 0.001), the load eVect (F2,78 = 103, P < 0.001) and the interaction between the two (F4,78 = 4.33, P < 0.003) were signiWcant for velocity at peak power. In contrast with the force at peak power, the velocity at peak power decreased signiWcantly with increasing load in the athletes and both groups of non-athletes.
Peak velocity (m · s-1)
Fig. 2. Relationship between velocity at peak power and the velocity at the highest peak power (mean ± sx¯). VB + L = volleyball players and weight-lifters; ME = sedentary males; WO = sedentary females. The circles, triangles and squares correspond to 0, 5 and 10 kg, respectively. The dotted line is the line of identity.
A one-way analysis of variance showed that the velocity at the highest peak power in the strength and power athletes (2.58 ± 0.23 m · s-1 ) was signiWcantly higher (F2,39 = 23.9, P < 0.001; Fig. 2) than in the sedentary males (2.31 ± 0.22 m · s-1) and females (1.92 ± 0.32 m · s-1).
Discussion In the present study, large peak powers with no load were observed in the strength and power athletes. Their
External loading and power output in squat jumping peak powers were similar to those of the national and international volleyball players assessed by Ferretti et al. (1994), who were presented with a similar vertical jump protocol (i.e. no counter-movement). The values for the male non-athletes were similar to those of the sedentary men studied by Grassi et al. (1991) and Ferretti et al. (1992, 1994), but higher than those reported by Davies and Young (1984). As expected, the various velocity indices decreased with increasing external load, in line with the results of Davies and Young (1984). In contrast to the results of Davies and Young, however, there was an increase in the peak force and the force at peak power with increasing load in all participants in the present study. The eVects of external loads depend on the strength of the individual. In sedentary individuals, a 5 kg load led to a decrease in mean power, whereas a signiWcant increase was observed in the strength and power athletes. Body weight alone could correspond to a resistance high enough for the production of maximal mean power in sedentary individuals and, consequently, a decrease in mean power would result from external loading. On the other hand, body weight could be lower than the optimal resistance for mean power in strength and power athletes. When peak power was adopted rather than mean power, the eVect of moderate external loads on power output was small and non-signiWcant in the strength and power athletes (Fig. 1). The small decrease in the velocity at peak power with increasing load was compensated by an increase in the force at peak power, which explains why peak power was independent of load in these athletes. In contrast, the eVect of load on the force at peak power was less than that on the velocity at peak power in the sedentary individuals, and peak power at 0 kg was signiWcantly higher than that at 5 and 10 kg in both sedentary males and females. The eVect of a 10 kg load in the study of Davies and Young (1984; calculated from the equation given in Fig. 2) corresponded to a 5.3% decrease in peak power for a counter-movement jump, which is similar to the results for the squat jump by sedentary males in the present study (-4.7% for peak power with a 10 kg load). There are several possible explanations for the independence of peak power at diVerent loads in the strength and power athletes. First, given the shape of the force–power relationship, relatively large variations (~10%) around the optimal force correspond to small variations in power output. A second explanation is suggested by the results of previous studies on the eVect of braking force on power output during allout sprinting on a friction-loaded cycle ergometer (Lakomy, 1986; Seck et al., 1995). Maximal power was shown to depend on braking force if mean power (power averaged over one revolution) was measured at peak
103 velocity. When variations in kinetic energy of the Xywheel were taken into account in the computation of power output, peak power was found to be independent of braking force (Lakomy, 1986; Seck et al., 1995). Indeed, the participants were able to produce the same peak power with low (20 or 40 N), medium (60 N) and high (70 or 80 N) braking forces. The same peak power was produced both during the acceleration phase (20, 40 or 60 N) and at peak velocity (70 or 80 N) when the participants reached their optimal velocity (Seck et al., 1995). Maximal peak power can be produced on a cycle ergometer, whatever the braking force, provided that peak velocity is higher than the optimal velocity for power output. Similarly, an individual should produce his or her maximal peak power for a vertical jump, whatever the external load, provided that he or she is able to reach the optimal velocity for power output during the jump. In this case, peak velocity should be higher than (or at least equal to) the optimal velocity and, consequently, the external load should not be too heavy. The diVerences between the velocity at peak power and the velocity corresponding to the best peak power in the various load conditions were small in our strength and power athletes (Fig. 2). It is probable that the value of the latter velocity was close to the optimal one in these individuals, while the diVerences in peak power were independent of load. In the sedentary individuals in the present study, peak velocity at a load of 10 kg was much lower than the velocity at the highest peak power, which could explain why peak power was signiWcantly lower at this load. In the present study, the average value was 11% higher in the strength and power athletes than in the sedentary males (Fig. 2). This suggests that the optimal velocity for a vertical jump was higher in the strength and power athletes, who were, consequently, not only stronger but also faster than the sedentary participants. The optimal velocity in jumping depends on the percentages of muscle Wbre types, as in cycling (Sargeant et al., 1984; Hautier et al., 1996); it is probable that the strength and power athletes had a higher percentage of type II Wbres than the sedentary individuals. It is possible that the velocity at the highest peak power was a slight overestimate of optimal velocity in six of the athletes, whose best recorded peak power corresponded to 10 kg if they were able to produce a higher peak power at a higher load – that is, at a lower velocity at peak power. On the other hand, it is possible that the velocity at the highest peak power was a large underestimate of optimal velocity in the male and female sedentary individuals, because body weight alone was higher than the optimal resistance for power output in these participants. Indeed, in the 16 sedentary individuals, the velocity at the highest peak power corresponded to the velocity at peak power in the 0 kg
Driss et al.
104 condition, which was higher than that at 5 and 10 kg. It is possible that peak power and, consequently, the velocity at the highest peak power would have been higher in the unloaded condition in these participants. Therefore, its low value and the negative eVect of external loading on peak power in the sedentary participants could indicate that the value of peak power measured during a vertical jump with no extra load will be an underestimate of maximal power in these individuals. It is probable that ‘peak velocity higher than optimal velocity’ is not a suYcient condition for maximal power output. For example, studies of isolated muscle Wbres (Gordon et al., 1966) and monoarticular movements (Singh and Karpovich, 1966) have shown that force depends on Wbre length (force–length relationship) and joint angle. It is possible that, in the 5 kg load condition, the sedentary individuals reached optimal velocity too late and beyond the range of articular angles that are optimal for force and power output. The velocity at the highest peak power corresponded to the velocity of the centre of mass, while peak power was measured on the force platform. The velocity of the centre of mass is the summation of the eVects of the angular velocities of the diVerent joints acting in a vertical jump (ankle, knee and hip). The optimal velocity of the centre of mass is probably a compromise and may correspond to angular velocities at the joints that are not optimal for the diVerent muscle groups. Moreover, the external loads were applied using a special vest, which should lead to an increase in trunk inertia and a small displacement of the centre of mass, thus modifying the respective part of the trunk and leg extensors. The combination of a change in the location of the centre of mass, a compromise in the diVerent optimal velocities and the eVect of the force–length relationship on power could in part explain why the strength and power athletes were able to produce the same peak power at slightly diVerent values of the velocity and force at peak power. In conclusion, the present results support the hypothesis that the eVect of external loading on power output in a squat vertical jump depends on physical activity. During squat jumps, mean and peak power decreased with increasing load in sedentary individuals. The magnitude of this decrease was similar to that previously reported for the same loads during a vertical jump with counter-movement in sedentary individuals. In contrast, mean power was signiWcantly higher with a 5 kg load in power-trained athletes. Moreover, peak power did not vary signiWcantly in the three load conditions (0, 5 and 10 kg) in power-trained athletes. Our results suggest that peak power is independent of load provided that peak velocity is higher than the optimal velocity for power output. The velocity of the centre of mass at peak
power was signiWcantly lower in the sedentary individuals than in the strength and power athletes. It is possible that peak power on a force platform underestimates maximal power in sedentary individuals.
References Bosco, C., Viitasalo, J.T., Komi, P.V. and Luhtanen, P. (1982). Combined eVect of elastic energy and myoelectrical potentiation during stretch–shortening cycle exercise. Acta Physiologica Scandinavica, 114, 557–565. Buttelli, O., Seck, D., Vandewalle, H., Jouanin, J.C. and Monod, H. (1996). EVect of fatigue on maximal velocity and maximal torque during short exhausting cycling. European Jour nal of Applied Physiology, 73, 175–179. Caiozzo, V.J. and Kyle, C.R. (1980). The eVect of external loading upon power output in stair climbing. European Journal of Applied Physiology, 44, 217–222. Davies, C.T.M. (1971). Human power output in exercise of short duration in relation to body size and composition. Ergonomics, 14, 245–256. Davies, C.T.M. and Rennie, R. (1968). Human power output. Nature, 217, 770–771. Davies, C.T.M. and Young, K. (1984). EVects of external loading on short term power output in children and young male adults. European Journal of Applied Physiology, 52, 351–354. Durnin, J.V. and Womersley, J. (1974). Body fat assessed from total body density and its estimation from skinfold thickness: Measurements on 481 men and women aged from 16 to 72 years. British Journal of Nutrition, 32, 77–97. Fenn, W.O. and Marsh, B.S. (1935). Muscular force at diVerent speeds of shortening. Journal of Physiology, 85, 277–297. Ferretti, G., Gussoni, M., Di Prampero, P.E. and Cerretelli, P. (1987). EVects of exercise on maximal instantaneous muscular power of humans. Journal of Applied Physiology, 62, 2288–2294. Ferretti, G., Ishii, M., Moia, C. and Cerretelli, P. (1992). EVects of temperature on the maximal instantaneous power of humans. European Journal of Applied Physiology, 64, 112–116. Ferretti, G., Narici, M.V., Binzoni, T., Gariod, L., Le Bas, J.F., Reutnauer, H. and Cerretelli, P. (1994). Determinants of peak muscle power: EVects of age and physical conditioning. European Journal of Applied Physiology, 68, 111–115. Gordon, A.H., Huxley, A.F. and Julian, F.J. (1966). The variation in isometric tension with sarcomere length in vertebrate muscle Wbres. Journal of Physiology, 184, 170–192. Grassi, B., Cerretelli, P., Narici, M.V. and Marconi, C. (1991). Peak anaerobic power in master athletes. European Jour nal of Applied Physiology, 62, 394–399. Hautier, C.A., Linossier, M.T., Belli, A., Lacour, J.R. and Arsac, L.M. (1996). Optimal velocity for maximal power production in non-isokinetic cycling is related to muscle
External loading and power output in squat jumping Wbre type composition. European Journal of Applied Physiology, 74, 114–118. Hill, A.V. (1938). The heat of shortening and the dynamic constant of muscle. Proceedings of the Royal Society B, 126, 136–195. Kitagawa, K., Suzuki, M. and Miyashita, M. (1980). Anaerobic power output of young obese men: Comparison with non-obese men and the role of excess fat. European Journal of Applied Physiology, 43, 229–234. Lakomy, H.K.A. (1986). Measurement of work and power output using friction-loaded cycle ergometers. Ergonomics, 29, 509–517. Luhtanen, P. and Komi, P.V. (1978). Segmental contribution to forces in vertical jump. European Jour nal of Applied Physiology, 38, 181–188. Nakamura, Y., Mutoh, Y. and Miyashita, M. (1985). Determination of the peak power output during maximal brief pedalling bouts. Journal of Sports Sciences, 3, 181–187. Sargeant, A.J., Hoinville, E. and Young, A. (1981). Maximum leg force and power output during short-term dynamic exercise. Jour nal of Applied Physiology, 51, 1175–1182. Sargeant, A.J., Dolan, P. and Young, A. (1984). Optimal velocity for maximal short-term (anaerobic) power output in cycling. International Journal of Sports Medicine, 5 (suppl.), 124–125.
105 Seck, D., Vandewalle, H., Decrops, N. and Monod, H. (1995). Maximal power and torque–velocity relationship on a cycle ergometer during the acceleration phase of a single all-out exercise. European Journal of Applied Physiology, 70, 161–168. Singh, M. and Karpovich, P.V. (1966). Isotonic and isometric forces of forearm Xexors and extensors. Journal of Applied Physiology, 21, 1435–1437. Vandewalle, H., Pérès, G. and Monod, H. (1983). Relation force-vitesse lors d’exercices cycliques réalisés avec les membres supérieurs. Motricité Humaine, 2, 22–25. Vandewalle, H., Pérès, G., Heller, J. and Monod, H. (1985). All-out anaerobic capacity test on cycle ergometers: A comparative study on men and women. European Journal of Applied Physiology, 54, 222–229. Vandewalle, H., Pérès, G., Heller, J., Panel, J. and Monod, H. (1987). Force–velocity relationship and maximal power on a cycle ergometer: Correlation with the height of a vertical jump. European Journal of Applied Physiology, 56, 650–656. Vandewalle, H., Pérès, G., Sourabié, B., Stouvenel, O. and Monod, H. (1989). Force–velocity relationship and maximal anaerobic power during cranking exercise in young swimmers. Inter national Jour nal of Sports Medicine, 10, 439–445. Wilkie, D.R. (1950). The relation between force and velocity in human muscle. Journal of Physiology, 110, 249–280.