Working Paper No 25/09 Is labor mobility a channel for spillovers from multinationals? Evidence from Norwegian manufacturing by Ragnhild Balsvik
SNF project no 1373 “Research Institution-Based Strategic Project in Labour Economics” Funded by the Norwegian Ministry of Labour and Social Inclusion
INSTITUTE FOR RESEARCH IN ECONOMICS AND BUSINESS ADMINISTRATION
BERGEN, JULY 2009 ISSN 1503-2140 © Dette eksemplar er fremstilt etter avtale med KOPINOR, Stenergate 1, 0050 Oslo. Ytterligere eksemplarfremstilling uten avtale og i strid med åndsverkloven er straffbart og kan medføre erstatningsansvar.
SNF Working Paper No 25/09
Is labor mobility a channel for spillovers from multinationals? Evidence from Norwegian manufacturing.∗ Ragnhild Balsvik† 18 July 2009
Abstract This paper documents labor mobility flows from multinationals (MNEs) to nonMNEs in Norwegian manufacturing during the 1990s. 14,400 workers in MNEs move to non-MNEs during this period. By the year 2000, 28 percent of the non-MNEs employed workers with experience from MNEs. Consistent with spillovers through mobility, I estimate a robust and significantly positive correlation between the share of workers with MNE-experience and the productivity of non-MNEs. Workers with MNE-experience contribute 20% more to the productivity of their plant than workers without experience from MNEs, even after controlling for differences in unobservable worker characteristics. The difference between the private returns to mobility and the productivity effect at the plant level suggests that labor mobility from MNEs to non-MNEs represents a true knowledge externality. Keywords: spillovers, labor mobility, linked employer-employee data, wages JEL Classification: D24, F23, J31, J60 ∗
I am grateful for discussions with and comments from Jarle Møen, Holger G¨org, Gorm Grønnevet, Stefanie A. Haller, Jan I. Haaland, Arngrim Hunnes, Beata Javorcik, Victor Norman, Kjell G. Salvanes and Frode Steen. † Norwegian School of Economics and Business Administration, Helleveien 30, 5045 Bergen, Norway; email:
[email protected]
1
SNF Working Paper No 25/09
1
Introduction
The empirical literature on knowledge spillovers from foreign direct investment to host country firms, treats the channels through which such spillovers may occur as a black box. The labor mobility channel for spillovers has been highlighted both in theoretical models (Fosfuri et al., 2001; Glass and Saggi, 2002), and in the empirical literature (for a recent survey of the empirical spillover literature see G¨org and Greenaway, 2004). The general approach of the empirical spillover literature is to regress a measure of domestic plant productivity on a measure of foreign presence at the industry level. When measuring foreign presence at the industry level it is not possible to capture the fact that domestic firms may have different links with foreign-owned firms. The more contact domestic firms have with foreign-owned firms, the more likely they are to benefit from spillovers. One type of contact with foreign-owned firms is to hire workers from these firms. I use linked employer-employee data to construct plant-specific measures for the share of workers in domestic plants with recent experience from multinationals. By using this measure of an explicit link between domestic and multinational firms in a productivity regression, I am able to go beyond the ‘black box’-treatment of spillovers in the existing empirical literature. The paper starts from the premise that foreign-owned firms are a relevant source of spillovers because they are part of MNEs with firm-specific assets that can be transferred across borders within the firm (Dunning, 1981; Markusen, 1995). It has recently been argued that the firm-specific advantage hypothesis, which is thought to be a reason for firms becoming multinational, should apply equally to domestic multinationals of the host country (e.g. Bellak, 2004). The argument implies that the potential for spillovers should primarily go from multinationals to purely local firms, regardless of whether a multinational is foreign or domestically owned. The empirical analysis in this paper will therefore distinguish between plants that are part of multinational enterprises and plants that are part of firms that only operate in Norway, hereafter called MNEs and non-MNEs, respectively. In order for labor mobility to be a channel for spillovers from MNEs to non-MNEs, we would expect to observe the following: First, MNEs should have a firm-specific advantage that could be the basis for spillovers. If firms share rents with their workers, observing a wage premium for workers in MNEs (that is not related to worker selection) would be consistent with a potential for spillovers. Second, we need to observe some labor mobility from MNEs to non-MNEs. Third, non-MNEs that hire workers with previous experience from MNEs should benefit in terms of increased productivity. Fourth, workers who move from MNEs to non-MNEs should benefit from mobility in terms of their own wages, as 2
SNF Working Paper No 25/09
their experience from foreign-owned firms should be valued by their new employers. In this paper, I use linked employer-employee data to assess the evidence on all four points for Norwegian manufacturing during the 1990s. The existence of a firm-specific advantage combined with evidence of actual mobility can only suggest that a potential for spillovers through labor mobility does exist, while a productivity benefit at the plant level due to mobility is consistent with labor mobility actually working as a channel for spillovers. To what extent such spillovers can be regarded as an externality, and not only as knowledge diffusion through market transactions, cannot be determined from a positive productivity effect alone.1 An assessment of the size of the productivity benefit together with information about the wage increase obtained by the mobile workers may indicate to what extent a possible spillover is an externality. If the productivity benefit at the plant level is larger than the wage premium granted to workers with experience from MNEs, the evidence is consistent with a knowledge externality. As a first exercise to assess the potential for knowledge spillovers from MNEs to nonMNEs in Norwegian manufacturing, I look for evidence of a multinational advantage by estimating individual wage equations for manufacturing workers. Following the recent approach by Abowd et al. (2002), I estimate wage equations where both plant and worker fixed effects can be identified. After controlling for positive selection of workers into MNEs, there is still a remaining plant-specific component giving rise to a wage premium of 3% in foreign MNEs. The results are consistent with a potential for spillovers from MNEs to non-MNEs. Little is known about the extent and pattern of labor mobility between MNEs and nonMNEs in a developed country, despite the frequent claim that labor turnover is a potential channel for spillovers.2 Martins (2006) is the first to provide such evidence for a developed country, using a large panel of linked employer-employee data that covers virtually all firms and their employees in Portugal from 1986 to 2000. He finds relatively small labor flows between foreign and domestic firms. In this paper focus is on labor mobility within manufacturing. I find that during my sample period from 1990-2000 14,400 workers leave MNEs and start working in non-MNEs. This flow of workers translates into a growing percentage of non-MNEs that have workers with experience from MNEs. In the year 2000 28% of non-MNEs employed one or more workers with recent MNE-experience, against 1 Møen (2005) argues that if the hiring firm pays wages according to the marginal productivity of the new employee, a productivity benefit in the hiring firms is not an externality. 2 Some case study evidence of foreign to domestic mobility in developing countries exists, see references in Saggi (2002) and G¨org and Strobl (2005). Poole (2009) documents mobility flows in linked employeremployee data between foreign and domestic firms in Brazil.
3
SNF Working Paper No 25/09
11% of non-MNEs in 1993. Given the extent of mobility from MNEs to non-MNEs, I proceed to estimate the effect of this mobility on the productivity of non-MNEs.3 Previously, this has only been examined empirically by G¨org and Strobl (2005), who use firm level data for a sample of manufacturing plants in Ghana. They find that firms whose entrepreneurs worked in multinationals in the same industry prior to joining or setting up their own firm are more productive than other firms, while experience from multinationals in a different industry has no effect on firm productivity. In contrast to the data from Ghana, I can determine the recent work history of all workers in non-MNEs. I include annual plant level measures of the share of workers with recent MNE-experience in a Cobb-Douglas production function. Based on an interpretation provided by Griliches (1967, 1986), I find that workers with MNE-experience contribute 20% more to total factor productivity than workers without experience from MNEs. This result cannot be explained by differences in worker characteristics, and is consistent with the idea that labor mobility from MNEs to non-MNEs is a channel for spillovers. When looking at the wages of movers compared to colleagues with similar characteristics in their new plant, I find that movers from MNEs to non-MNEs with more than 3 years’ of tenure from the MNE receive a wage premium of 5% compared to stayers in non-MNEs. Thus experience from MNEs is clearly valued in non-MNEs. The difference in the private returns to mobility for movers from MNEs to non-MNEs and the productivity effect these movers have at the plant level, suggest that the hiring non-MNEs do not fully pay for the value of these workers to the firm. Hence, labor mobility from MNEs to non-MNEs seems to be a source of knowledge externality in Norwegian manufacturing. The remainder of this paper is structured as follows. Section 2 presents the data sources, followed by the empirical results regarding multinational wage premia in section 3. Section 4 contains descriptive evidence of labor mobility from MNEs to non-MNEs and section 5 investigates whether non-MNEs that hire workers with MNE-experience benefit in terms of productivity. Section 6 asks whether movers benefit from mobility in terms of wages, while section 7 concludes. 3
Poole (2009) finds evidence consistent with mobility acting as a channel for spillovers in Brazil using an approach of estimating wage regressions.
4
SNF Working Paper No 25/09
2
Data
I use four different annual data bases for the years 1990-2000, all of which are censuses that can be linked to each other by firm or plant identifiers. All the data sources are administered by Statistics Norway. The starting point is the Norwegian Manufacturing Statistics, which is collected at the plant level. From the Manufacturing Statistics, I use information about production, input use, investment and industry classification (ISIC Rev. 2). As the main aim of the paper is to include measures of labor mobility into a plant level productivity framework, plants with insufficient information to calculate a measure of total factor productivity are excluded from the analysis. After this cleaning the remaining data still contains around 90% of manufacturing output and employment. In order to classify plants as MNEs or non-MNEs, I combine information obtained from the record of foreign ownership of equity in Norwegian firms (the so-called SIFON-register), and information from the register of outgoing foreign direct investment (FDI) from Norway. Both registers can be linked to the Manufacturing Statistics with firm identifiers. For the purpose of classifying plants as MNEs or non-MNEs, I use the information on the shares of equity in Norwegian firms owned by foreigners from the SIFON-register, and the shares of equity in firms abroad owned by firms in Norway from the register of outgoing FDI. I define a Norwegian MNE as a firm that is not itself majority owned from abroad, while it has direct ownership shares of more than 20% in operations abroad. A foreign MNE is more than 20% foreign owned and at the same time not classified as a Norwegian MNE. Finally, I link the administrative files containing the whole population of residents aged 16-74 to the plant level data. The administrative files contain, among other things, information on age, gender, identification of the current employer, weekly work-hours, annual earnings, start and end dates for the current employment spell and detailed education codes.4 Weekly work-hours are recorded as a categorical variable in 4 groups, with the longest work-hours being 30 hours or more per week. I use only workers that are recorded as working 30 hours or more per week, and call these workers full-time workers (more than 90% of workers are full-time workers). As a proxy for wages, I use the recorded earnings variable in the data, where earnings are measured as annual taxable labor income.5 Table 1 shows the total number of matched plants and full-time workers by type of 4
See Møen et al. (2004) for documentation of the Norwegian linked employer-employee data sets. For the analysis of wages in Sections 3 and 6 I drop 135 000 individual observations (6% of the sample), where the recorded earnings are considered too low for a regular full time earning. I set this threshold to be below 12 000 NOK per month in 2001 prices. Dropping these low-wage observations does not affect the results. 5
5
SNF Working Paper No 25/09
Table 1: Foreign and domestic plants and workers
1990 1991 1992 1993 1994 1995 1996 1997 1998 1999 2000
Number of plants 1 2 3 5211 249 216 4849 362 218 4739 390 240 4411 435 240 4455 497 219 4389 482 220 4296 512 203 4353 531 179 4352 559 169 4203 627 184 3996 619 212
Mean empl. 1 2 3 27 83 179 26 97 163 25 96 161 23 102 165 24 92 177 24 102 160 24 103 151 26 104 156 27 99 173 26 97 160 26 94 122
Full-time workers 1 2 3 141435 20634 38719 124921 35038 35607 119181 37474 38677 102155 44439 39600 106481 45742 38815 107243 49248 35108 101375 52715 30651 111495 55465 27958 115337 55217 29193 109798 60614 29381 104071 58237 25959
Notes: 1=Non-MNE; 2=Foreign MNE; 3=Domestic MNE
plant. The total number of manufacturing plants decreased from 5 676 in 1990 to 4 827 in 2000, and the total number of full-time workers went down from around 200 000 in 1990 to 190 000 in 2000. While the number of Norwegian MNEs and non-MNEs and the number of workers in these plants declined from 1990 to 2000, the number of foreign MNEs and the number of workers in foreign MNEs tripled during the same period. Plants of Norwegian MNEs are substantially larger in terms of the average number of workers than plants of foreign MNEs.
3
Is there a multinational wage premium?
A potential for spillovers from MNEs to non-MNEs requires that the local firms have something to learn from MNEs. One piece of evidence that would suggest such a potential is that MNEs pay higher wages than non-MNEs. Through on-the-job-experience (or training), workers in MNEs may get access to part of the MNE’s superior technology, and bring valuable knowledge with them to a new employer, or even set up competing business. In order to prevent such knowledge diffusion, MNEs may share rents with their workers by paying a wage premium to reduce labor mobility, as discussed in the theoretical models of Fosfuri et al. (2001) and Glass and Saggi (2002). Budd and Slaughter (2004) argues that a multinational wage premium could arise because of rent sharing across borders. Other explanations for the wage premium are that it is a compensation for a higher probability 6
SNF Working Paper No 25/09
of plant closure (Bernard and Sj¨oholm, 2003), or higher labor demand volatility (Fabri et al., 2003). Both these hypotheses of compensating differentials are consistent with the existence of a foreign wage premium, but do not necessarily imply that the MNE has a firm-specific advantage that could be the basis for spillovers.6 For Norwegian manufacturing there are clear differences in unconditional mean wages between non-MNEs, domestic MNEs and foreign MNEs, as can be seen from table 2. The table further shows that in terms of individual characteristics, the three groups of plants seem very similar, though education and tenure levels are slightly higher in MNEs than in non-MNEs. The difference in education levels is reflected in the plant level skill shares, where MNEs have higher shares of workers with 12 or more years of education than nonMNEs. In terms of plant size and labor productivity, the domestic and foreign MNEs are relatively similar; both types of MNEs are larger and have higher productivity than non-MNEs.7 Table 2: Worker and plant characteristics: Average 1990-2000 Non-MNEs Foreign MNEs Domestic MNEs Mean Sd Mean Sd Mean Sd Real monthly wage 23,549 13,087 26,638 11,528 25,069 15,196 Tenure 7.35 6.13 7.90 6.42 9.29 6.56 Experience 22.46 12.45 22.49 12.02 22.55 12.35 Age 40.10 11.74 40.56 11.25 40.71 11.52 Years of schooling 10.64 2.03 11.07 2.30 10.92 2.33 Plant size 30.61 70.29 107.24 183.24 163.02 234.35 Labor Productivity 1224 1631 2102 8458 1817 1359 Skill share 0.38 0.23 0.45 0.21 0.40 0.20 Female share 0.21 0.22 0.20 0.19 0.24 0.21 Worker/Plant obs. 1,243,480/49,000 514,820/5,250 369,670/2,290 Notes: Experience=(age-years of education-7), plant size=number of employees, labor productivity=real output per employee, skill share=share of workers with 12 or more years of education. 6
Several papers investigate the extent of so-called wage-spillovers, see Aitken et al. (1996), Girma et al. (2001) and Driffield and Girma (2003). Foreign direct investment by high productivity firms might lead to increased wages by affecting labor demand directly, but there could also be an indirect effect through knowledge diffusion. As noted by Aitken et al. (1996), labor turnover and knowledge diffusion should eventually increase wages also in domestic firms and thus reduce or eliminate the foreign wage premium. As these studies do not follow workers between plants, they cannot say whether labor mobility played any role in facilitating the wage-spillovers. 7 Regressions of the characteristics in table 2 on year and industry dummies and dummies for MNE status show that the differences between non-MNEs and MNEs in table 2 are not caused by MNEs and non-MNEs being systematically located in different industries.
7
SNF Working Paper No 25/09
When using plant level data for average wages it is a common finding that foreign firms pay higher average wages than domestically owned firms, and that the foreign wage premium is larger in developing countries than in developed countries.8 In many plant level datasets it is not possible to control for the quality of the labor force when estimating the foreign wage premium, thus part of the wage premium may be due to foreign firms using more skilled labor than domestic firms. Studies of foreign wage premia using individual wage data typically find smaller wage premia than studies using only plant level average wages, confirming that part of the plant level premium can be explained by skill composition (Heyman et al., 2007). With the matched employer-employee data for Norwegian manufacturing, I estimate the following individual wage regression 0 wit = β0 + β1 DM N Ej(i,t) + +β2 F M N Ej(i,t) + Xit0 β3 + Fj(i,t) β4 + vt + vI + eit .
(1)
wit is the log real monthly wage of worker i at time t, Xit is a vector of observable individual characteristics and Fj(i,t) is a vector of observable plant characteristics for the plant j where individual i is observed, while eit is an idiosyncratic error term. vt and vI are a set of time and industry dummies. The main variables of interest are the indicator variables for domestic and foreign MNEs; DM N Ej(i,t) and F M N Ej(i,t) . Table 3 reports the results from estimating equation (1) with additional sets of control variables in each column. Column 1, which only includes year and industry dummies, show a wage premium in foreign MNEs of 5.7% relative to non-MNEs, while the wage premium in domestic MNEs is 3.2%. Adding variables for plant characteristics in column 2 decreases the estimated wage premium, and adding individual characteristics in column 3 further decreases the wage premium; to 3% in foreign MNEs and 0.6% in domestic MNEs.9 The results in column 3 are comparable to the 2% MNE premium found by Heyman et al. (2007) in a very similar regression using Swedish data. One interesting difference is that they find almost no difference in wage premia between foreign and domestic MNEs in Sweden.10 Regressions based on equation (1) do not control for unobserved worker or firm-fixed 8
See Heyman et al. (2007) and references therein. One explanation for the small change in the wage premium when adding individual characteristics, once plant level characteristics are controlled for, is that the observable characteristics of workers are quite similar in MNEs and nonMNEs, as Table 2 shows. Further, Norway is characterized by a relatively compressed wage structure. 10 Martins (2004) do similar OLS wage regressions using data from Portugal, and finds a foreign wage premium of around 10% when controlling for both worker and plant characteristics. 9
8
SNF Working Paper No 25/09
Table 3: Wage premia in multinational plants Domestic MNE Foreign MNE Year and industry dummies (140) Plant characteristics Worker characteristics Number of observations R2
.032
OLS .009
.006
FE -.004
(.001)
(.001)
(.001)
(.001)
.057
.036
.030
.003
(.001)
(.001)
(.001)
(.001)
yes no no 2,122,584 .19
yes yes no 2,122,584 .22
yes yes yes 2,122,584 .44
yes yes yes 2,122,584 .28
Notes: Dependent variable is log individual wage. Plant characteristics are log(number of employees) and its square, share of female workers, share of workers with 12 or more years of education, and log(capital per unit of output). Worker characteristics are education, a quadratic in tenure, a quartic in experience, a gender dummy, and interaction terms between gender and individual characteristics. All coefficients reported above are significant at the 0.1% level. Standard errors clustered on individuals in parentheses.
effects. The results reported in columns 1-3 of table 3 are therefore likely to be affected by omitted variable bias. If MNEs to a larger extent tend to select workers with ‘better’ unobserved (to the researcher) characteristics, this may explain part of the wage premium. Similarly, if MNEs make use of better technology, intermediate inputs or management, this is a plant-specific advantage that may give rise to a wage premium through rent sharing with workers.11 The argument that a multinational wage premium could signal a potential for spillovers relies on the presence of such a plant-specific component in the wage premium. Such a component of the wage premium could be related to the technology or management of the firm, but should not be related to worker selection. Adding worker fixed effects, vi , to equation (1) is one way of taking out the effect of possible selection of workers into MNEs. 0 wit = β0 + β1 DM N Ej(i,t) + +β2 F M N Ej(i,t) + Xit0 β3 + Fj(i,t) β4 + vt + vI + vi + eit .
(2)
The results from estimating equation (2) are shown in column 4 of table 3. The wage premium in foreign MNEs falls substantially, indicating a wage premium of 0.3%, while there is a small negative wage premium in domestic MNEs. 11
If MNEs do not share rents with workers, a plant-specific advantage may exist even though we do not observe a wage premium in the data.
9
SNF Working Paper No 25/09
The identification of the dummies for multinational status in equation (2) comes from individuals that move between MNEs and non-MNEs, or from plants that change status. Hence, the coefficient on the dummy variables for multinational status will capture a mix of a mobility effect and an effect from changes in plant status.12 As 80% of the workers in my sample are observed in only one manufacturing plant, the MNE dummies are mainly identified from changes in plant status, and not from mobility. In cases where the worker stays in the same plant, the unobserved worker fixed effect will fully absorb the unobserved plant fixed effect. Martins and Esteves (2008), in their study of foreign wage premia in Brazil decompose the wage premium from wage equations like (2) into parts due to mobility, foreign acquisitions and foreign divestures by doing separate regressions on movers and stayers, depending on the direction of move and the direction of change in plant status. Since the main purpose of this section is to investigate whether there is a plant-specific component in the wage premium, I proceed to estimate these unobserved plant fixed effects directly. The starting point is a wage equation like (2) with the addition of a plant fixed effect, vj(i,t) . 0 wit = β0 + β1 DM N Ej(i,t) + +β2 F M N Ej(i,t) + Xit0 β3 + Fj(i,t) β4 + vt + vi + vj(i,t) + eit . (3)
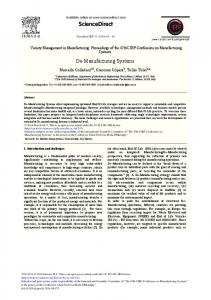
Recent work by Abowd et al. (2002) has shown how the presence of labor mobility in linked employer-employee data sets makes it possible to identify both the unobserved worker and plant fixed effects. The identification of the two types of fixed effects in equation (3) relies on worker mobility between firms, and the assumption of mobility being exogenous to the included regressors. The method identifies in the data separate groups of workers and plants that are connected via mobility. In my 11 year sample the largest group contains around 99% of the observations used in table 3.13 The distribution of the plant fixed effects identified by estimating equation (3) is plotted in the left part of figure 1. The kernel density plots show that the distribution of the plant fixed effects of MNEs are shifted to the right relative to those of non-MNEs. This is consistent with a plant-specific wage premium in MNEs relative to non-MNEs even after controlling for worker selection on both observable and unobservable characteristics. The right hand panel of figure 1 exhibits the distribution 12
The changes in plant status that are captured by the foreign MNE dummy are foreign acquisitions and foreign divestures. Changes in plant status captured by the domestic MNE dummy are establishment or closure of affiliates abroad. 13 I use the Stata routine developed by Cornelissen (2008) to implement the approach in Abowd et al. (2002).
10
SNF Working Paper No 25/09
of worker fixed effects for workers in MNEs versus workers in non-MNEs, the pattern for the distribution of the unobserved worker fixed effects is similar to the pattern for the distribution of plant fixed effects. Thus there is also evidence consistent with positive worker selection into MNEs.14 Figure 1: Distribution of plant and worker fixed effects in MNEs and non-MNEs Worker fixed effects
0
0
1
.5
2
1
3
1.5
4
2
5
Plant fixed effects
−1
−.5
0
.5
MNEs Non−MNEs
8.5
9
9.5
10
10.5
Workers in MNEs Workers in non−MNEs
Notes: Kernel density plots for 1997. Density plots for all other years are very similar.
I also regress the calculated plant and workers fixed effects on dummies for MNE status and 5 digit industry dummies. Column 1 of table 4 show the results for the regression with the plant fixed effects as dependent variable. Foreign MNEs pay higher wages than non-MNEs when unobserved heterogeneity in workers is taken into account in addition to observed worker and plant characteristics. The plant-specific wage premium in foreign MNEs is in the order of 3.5%, while there is no significant plant component of the wage premium for domestic MNEs.15 Results for the worker fixed effect show that worker selection is of equal importance in domestic and foreign MNEs. Hence, I conclude that although worker selection is an issue, there is also evidence of a plant-specific component of the wage premium in foreign MNEs that could be the basis for potential spillovers. 14
Martins and Esteves (2008) also find that the distribution of firm and worker fixed effects across foreign and domestic firms in Brazil show a similar pattern as in figure 1 when they use a similar approach of estimating both firm and worker fixed effects. 15 The number of plants that identify the domestic MNE dummy in this regression are only 95, while 229 plants are classified as foreign MNEs all years.
11
SNF Working Paper No 25/09
Table 4: Unobserved plant and worker fixed effects Domestic MNEs
Plant fixed effect -.006
Worker fixed effect .037
(.009)
(.002)∗
.035
.035
Foreign MNEs
∗
Industry dummies (140) Number of plants/workers R2
(.007)
(.002)∗
yes 5,185 .14
yes 182,412 .08
Notes: Dependent variables are the unobserved plant and worker fixed effects identified when estimating equation (3). ∗ = significant at 0.1%. The reference group in column 1 consists of plants that are non-MNEs throughout the sample. The reference group in column 2 consists of workers always employed by nonMNEs.
4
The extent of labor mobility
If labor turnover is to act as a channel for spillovers from MNEs to non-MNEs, we must observe workers who switch from MNEs to non-MNEs. The wage premium in MNEs may induce workers to stay in MNEs rather than move to non-MNEs, and worker flows may therefore be small. This section documents the size of the worker flows between MNEs and non-MNEs from 1990 to 2000. In this period my data set contains in total 450 000 different manufacturing workers. 80% of these workers are only observed in one manufacturing plant, while around 20% of the workers change plants within manufacturing and generate around 110 000 incidents of job change. These 110 000 moves are classified according to the direction of move and shown in table 5. Around 28,150 of these plant moves are from MNEs to other MNEs (25% of 110 000), while 14,400 are from MNEs to non-MNEs. Thus, 2 out of 3 workers moving from a MNE go to another MNE. Since more than half of the jobs in manufacturing during this period is found in non-MNEs (see table 1) there is a disproportionate pattern of moves within the group of MNEs. The extent of ‘internal labor markets’ turns out to be more pronounced within the group of domestic MNEs. One explanation for this feature is that domestic MNEs are more likely to be part of multi-plant firms, with workers moving between plants within the firm. Table 5 further shows that 45% of the plant changes in my sample occur between nonMNEs. For the group of workers with low education this percentage is 49%, while only 28% of the job changes among the university educated workers occur between non-MNEs. For
12
SNF Working Paper No 25/09
Table 5: Job changes by direction of mobility
Between non-MNEs From non-MNE to MNE From MNE to non-MNE Between MNEs Total moves (=100%)
All 45.51 15.91 13.06 25.52 110,377
Education 1 2 49.25 43.72 15.65 16.19 12.25 13.93 22.85 26.17 61,736 39,431
3 28.08 16.45 14.78 40.69 9,210
Notes: 1=Non-technical education; 2=Vocational/technical education; 3=University education.
the university educated, the largest share of plant moves (40%) occurs between MNEs.16 Table 6: Share of workers in non-MNEs with MNE-experience All 1993 Experience from Experience from Experience from Total workers 2000 Experience from Experience from Experience from Total workers
Education 1 2
3
MNEs domestic MNEs foreign MNEs
1.0 0.8 1.6 2.2 0.5 0.3 0.8 0.9 0.7 0.5 1.0 1.5 89,795 64,254 22,890 2,651
MNEs domestic MNEs foreign MNEs
2.7 2.1 3.9 3.9 0.8 0.5 1.3 1.5 2.0 1.6 2.9 2.5 95,314 62,360 23,246 9,708
Notes: For definition of education groups 1, 2 and 3, see table 5.
As the analysis in this paper focuses on the possibility for spillovers through labor mobility from MNEs to non-MNEs, we want to know to what extent workers in non-MNEs have experience from MNEs, and to what extent non-MNEs have hired workers with MNEexperience. Table 6 shows the percentage of workers in non-MNEs in 1993 and 2000 with recent experience from MNEs. Recent MNE-experience is defined as having worked in an MNE for one or more of the last three years. Thus, a worker must have worked in 16
I have divided the workers into 3 groups based on detailed educational codes from Statistics Norway. Group 1, the low-education group, includes individuals with missing education code and workers that have completed up to 1 year of education after compulsory schooling. In addition, this group includes workers with completed high school without technical fields. Group 2 includes workers with technical/vocational education at the high school level, while group 3 includes workers with university education.
13
SNF Working Paper No 25/09
a multinational for one or more of the years 1990-1992 to be counted as having MNEexperience in 1993. In 1993 only 1% of the workers in non-MNEs have experience from MNEs; roughly equally divided between foreign and domestic MNE-experience.17 In 2000 this share is more than doubled to 2.7%. The majority of those with MNE-experience have experience from foreign MNEs, in line with the evidence reported above that internal labor markets are more pronounced in domestic MNEs. Although table 6 shows that only a small share of workers in non-MNE have recent MNE-experience, in terms of the potential for spillovers, the interesting issue is how these workers spread across the group of non-MNEs. This is illustrated in table 7, which tabulates the percentage of non-MNEs in 1993 and 2000 that employ workers with recent experience from MNEs. The percentage of plants employing workers with MNE-experience is much larger than the percentage of such workers; 11.4% in 1993 (against 1% of workers) and 28.1% in 2000 (against 2.7% of workers). Hence, during the 1990s there is an increasing share of plants that employ workers with previous experience from MNEs. In the next section I proceed to investigate whether these workers have an impact on the productivity of their new plants. Table 7: Share of non-MNEs employing workers with MNE-experience All 1993 Experience Experience Experience 2000 Experience Experience Experience
from MNEs from domestic MNEs from foreign MNEs
11.4 5.5 7.2
from MNEs from domestic MNEs from foreign MNEs
28.1 10.8 22.8
Education 1 2 3 7.6 3.4 4.7
5.1 1.0 2.5 0.4 3.1 0.7
18.0 14.0 6.1 5.8 5.1 2.2 14.0 11.2 4.6
Notes: For definition of education groups 1, 2 and 3, see table 5.
17
The percentage of workers with experience from domestic and foreign MNEs respectively, do not sum to the percentage of workers with overall MNE-experience, because some of the workers may have recent experience from both types of MNEs.
14
SNF Working Paper No 25/09
5
Productivity spillovers through labor mobility?
The empirical spillover literature surveyed by G¨org and Greenaway (2004) has looked for evidence of productivity spillovers from foreign to domestic firms by regressing a measure of domestic plant productivity on a number of covariates, including a measure of foreign presence in the industry or region. As argued by G¨org and Strobl (2005), this approach treats the channels through which spillovers may occur as a black box. A measure of foreign presence at the industry level is not able to capture the fact that firms within the same industry have different degrees of contact with foreign firms.18 Domestic firms with explicit contacts with foreign firms may be the most likely to benefit from knowledge diffusion. Examples of contacts between foreign and domestic firms could be technology licensing, R&D cooperation, or exchange of intermediate inputs. Unfortunately, information at the firm or plant level on such links between MNEs and non-MNEs is rarely available. G¨org and Strobl (2005) use a firm level data set from Ghana with information on whether the owners of domestic firms have previous experience from MNEs, and thus has information on a firm-specific link between domestic firms and multinationals. They find a positive effect on the productivity of domestic firms if the manager has previous experience from MNEs. With matched employer-employee data it is possible to establish measures of explicit links between non-MNEs and MNEs by constructing plant-year specific measures of the share of workers in non-MNEs with recent experience from MNEs. I include such measures in a Cobb-Douglas production function framework in order to study productivity spillovers through labor mobility. Poole (2009) uses matched employer-employee data from Brazil for the period 1996-2001 in order to study wage spillovers. She estimates wage equations for incumbent workers in domestic firms and finds that their wages are positively affected by the share of workers with experience from multinationals. Empirical specification In the following, the interpretation of the coefficient on the share of workers with MNEexperience is based on Griliches (1967). He argues that in a Cobb-Douglas production function one could ask whether different types of R&D expenditure are equally ‘potent’ 18 If foreign presence is measured in the same industry as the domestic plants are located, this measure picks up intra-industry (also called horizontal-) spillovers, for examples see Aitken and Harrison (1999) and Haskel et al. (2007). Regressions that include foreign presence in upstream or downstream industries from the domestic plants pick up inter-industry (also called vertical-) spillovers, see Smarzynska-Javorcik (2004).
15
SNF Working Paper No 25/09
in generating productivity growth. I apply this idea to different types of workers: those with experience from MNEs, (LM ), and those without such experience (LN ). Under the spillover hypothesis, we would expect that LM should be weighted by a positive ‘premium’ δ in the production function. With two types of labor in the production function, effective labor use, L∗ , is L∗ = LN + LM (1 + δ) = L(1 + δs), where s is the share of labor with MNE-experience in the total use of labor. In the log linearized version of a Cobb-Douglas production function where labor input is L∗ , the βL ln L∗ term can be approximated by βL ln L + βL δs. Hence, I estimate ln Yit = βK ln Kit + βM ln Mit + βL ln Lit + βL δsit + vi + vt + vt ∗ vI + εit ,
(4)
where ln Y , ln K, ln M , and ln L are the natural logs of output, capital, material and hours in plant i, year t.19 The main variable if interest is sit ; the share of workers with experience from MNEs. When constructing the measures of sit , I use the same definition of recent MNE-experience as used in tables 6 and 7 of the previous section: for a worker to be counted as having MNE-experience in year t, the worker has to be observed in a multinational for one or more of the years t − 3 to t − 1.20 Plant and time fixed effects, υi and vt , are included in equation (4). Any permanent differences in productivity levels between different industries will be absorbed by the plant fixed effects as long as plants do not change industries.21 By including a large number of interaction terms between industry and year dummies in addition to the year dummies, any systematic correlation between the share of workers with MNE-experience at the plant level and both overall and industry-specific business cycles are controlled for.22 The large 19
For variable construction, see the variable definitions in the appendix. sit is constructed from head counts in the matched employer-employee data, while Lit is taken from the Manufacturing Statistics and is measured as total hours worked in the plant during the year. The use of Lit together with sit in the same equation amounts to assuming that the share of matched workers with MNE-experience approximates the share of hours by workers with MNE-experience. At the aggregate manufacturing level the match of individuals to plants generates total manufacturing employment that corresponds to what we would get by using the employment information from the Manufacturing Statistics. At the plant level, the employment correspondence is more variable, thus I prefer to use the hours variable from the Manufacturing Statistics in the production function rather than constructing labor input from the number of individuals that I match to the plant level data. 21 Only very few plants in the data set change industry, and all results reported in this section are unchanged if industry dummies are included. 22 The industry-year interaction terms are based on 28 industry dummies corresponding to the 3 digit ISIC level. 20
16
SNF Working Paper No 25/09
number of industry-year interaction terms will also indirectly control for industry level timevarying variables that proxy competitive pressure (e.g. concentration ratios and measures of competition from abroad). Such variables are commonly used in the spillover literature, see for instance Haskel et al. (2007).23 The use of firm fixed effects remove all permanent productivity differences between plants that might be correlated with the propensity to hire workers with MNE-experience. Hence the main variable of interest is identified by time-variation within plants in the share of workers with MNE-experience. Therefore, I restrict the estimations of equation (4) to non-MNEs that at some point during the time period from 1990 to 2000 hire workers with MNE-experience. The way I have constructed the measure for the share of workers with MNE-experience implies that this measure captures the newly hired employees with MNE-experience in the plant, where newly hired means hired in year t, t-1 or t-2. If workers that change plants are better or more motivated than stayers in general, the effect of newly hired workers with MNE-experience may apply equally to newly hired workers coming from non-MNEs. Therefore I also include a measure for the share of newly hired workers coming from nonMNEs. Hence, the possible identification of a spillover effect relies on the differential impact of hiring a worker with MNE-experience over hiring a worker from another non-MNE. Results Table 8 presents results of estimating equation (4) on the sample of non-MNEs that at some point hire workers with MNE-experience. In column 1 the coefficient on the share of new workers with MNE-experience is positive and significant. The estimated coefficient is 0.1, and combined with the estimated labor input coefficient, this implies that δ = 0.27 (δ is significant at the 1% level). This means that newly hired workers with experience from MNEs contribute on average 27% more to the productivity of the plant than the incumbent workers. The coefficient on newly hired workers without MNE-experience is positive, but not significant. The difference in productivity premiums associated with the two types of newly hired workers is 20% and is significant at the 10% level. In column 2, the measure of MNE-experience is split into the shares of workers with experience from foreign and domestic MNEs, respectively. The coefficient on the share of workers with domestic MNE-experience is larger than that on the share of workers 23 Such proxies for competition were first proposed by Nickell (1996) and include market shares, profit margins, industry concentration and a measure of import competition. The inclusion of such variables do not affect the results presented here.
17
SNF Working Paper No 25/09
with foreign MNE-experience, but less precisely estimated. Hence the two coefficients are not significantly different. If each of the shares are included alone the coefficients remain more or less the same, but only the coefficient on the share of workers with experience from foreign MNEs is significant. As shown in table 7 there are fewer plants that employ workers with experience from domestic MNEs than foreign MNEs, in addition some of the workers have experience from both types of MNEs. In the remainder of the paper I combine the two types of MNE-experience and refer to MNE-experience in general. Table 8: Spillovers from workers with MNE-experience Sample Share of workers with experience from: MNEs Non-MNEs
Non-MNEs
.104 (.038)∗∗ .026 (.019)
Domestic MNEs Foreign MNEs
.099 (.037)∗∗ .025 (.019) .132 (.076)(∗) .066 (.037)(∗)
Large non-MNEs
MNEs
.108 (.038)∗∗ .028 (.018)
-.058 (.050)
MNEs (lagged) Non-MNEs (lagged) Log(Capital) Log(Materials) Log(hours) N R2
.039 (.022)(∗) -.047 (.047)
.051 (.007)∗∗ .526 (.011)∗∗ .376 (.013)∗∗ 17016 .86
.051 (.007)∗∗ .526 (.011)∗∗ .376 (.013)∗∗ 17016 .86
.051 (.007)∗∗ .527 (.011)∗∗ .377 (.013)∗∗ 17016 .86
.048 (.007)∗∗ .525 (.011)∗∗ .389 (.013)∗∗ 17015 .86
.091 (.030)∗∗ .024 (.019) .050 (.008)∗∗ .518 (.012)∗∗ .378 (.013)∗∗ 14667 .85
.046 (.012)∗∗ .508 (.014)∗∗ .400 (.013)∗∗ 10568 .82
Notes: Dependent variable: Log(Output). All regressions include year and industry-year interaction dummies. ∗∗ , ∗ , (∗ )= significant at 1, 5 and 10%, respectively. Standard errors clustered on plants in parentheses.
As multinationals tend to be larger than other firms, the effect we find may be due to experience from large firms rather than experience from MNEs. If this is the case, we would 18
SNF Working Paper No 25/09
expect workers coming from large non-MNEs to have a similar effect in the productivity regression as the share of workers coming from MNEs. Column 3 of table 8 report the results from a regression where a measure of the share of new workers coming from large non-MNEs is included. The coefficient on this measure is not statistically significant.24 If new hires are systematically correlated with time varying unobserved productivity shocks at the plant level, this will lead to an upward bias in the estimated coefficients on the shares of newly hired workers. Since I have included new hires from both MNEs and non-MNEs, correlation between time varying unobserved productivity shocks and new hires in general would not cause bias in the difference between new hires from MNEs and non-MNEs. But time varying productivity shocks that are correlated with the propensity to hire workers with MNE-experience gives rise to an upward bias in the differential impact of workers with MNE-experience. One example could be that plants investing in new machinery consciously seek out workers with MNE-experience to implement these investments. In column 4 I repeat the regression from the first column and include as control variables investment and the change in employment, to proxy for time varying shocks at the plant level. This does not change my results. As an alternative way to control for the possible correlation between productivity shocks and the propensity to hire workers with MNE-experience, I lag the shares of newly hired workers with MNE experience. This exercise is reported in column 5, again the results are largely unchanged.25 Columns 1-5 have all used the sample of non-MNEs in the regressions. The premise of the analysis so far has been that the direction of spillovers through worker mobility is from MNEs to non-MNEs, and consequently that spillovers are not relevant in the opposite direction. In section 3 I argued that a plant-specific wage premium would be consistent with a potential for knowledge diffusion through labor turnover. Since the results showed that the plant fixed effect was on average higher in MNEs than in non-MNEs, my argument implies that we should not find evidence consistent with spillovers from non-MNEs to MNEs if we estimate equation 4 on the sample of plants that are not always non-MNEs. The results from this exercise are reported in the last column of Table 8, and are consistent with my argument. 24
Non-MNEs are defined as large when they have more than 100 employees. An alternative method to control both for unobserved plant fixed effects and input simultaneity is to use the GMM-System estimator recently developed by Blundell and Bond (1998). I have tried variations of the GMM-System estimator using different lags of inputs and output as instruments. In all cases the validity of the instrument set was rejected. 25
19
SNF Working Paper No 25/09
Robustness: Spillovers or worker selection? The results presented so far cannot rule out the natural alternative explanation for the productivity premium associated with new workers with MNE-experience: that workers with MNE-experience are better educated, have more experience or are positively selected on unobservable characteristics compared to the other workers in the plant. Table 9 reports results from different ways to control for human capital when estimating equation (4). In column 1 I split labor input into 2 groups according to the length of their education, with workers classified as having low education if they have less than 12 years of schooling. I also split the shares of newly hired workers according to this classification. The results, reported in column 1 of table 9, show a positive and significant effect for workers with MNE-experience and low education, while none of the other coefficients are significant. Table 9: Spillovers: Controlling for observed and unobserved human capital Share of workers with experience from: MNEs, with education < 12 years
.115 (.041)∗∗
MNEs, with education >= 12 years
.006 (.115)
Non-MNEs, with education < 12 years
-.034 (.075)
Non-MNEs, with education >= 12 years
.031 (.020)
MNEs
.084 (.036)
Non-MNEs
.131 ∗
.020
N R2
17016 .86
.081
∗∗
(.039)
.037
(.029)∗∗
.029
(.019)
∗
(.018)
(.018)
17016 .86
17016 .85
15658 .86
Notes: Dependent variable: Log(Output). All regressions include log of capital, materials and hours, and year dummies and year-industry interaction dummies. In column 1 labor input is split into two groups according to education level. In columns 2-4 labor input is defined according to equation (5) and adjusted with the average of education, experience and unobserved worker fixed effects, respectively. ∗∗ , ∗ , (∗ )= significant at 1, 5 and 10%. Standard errors clustered on plants in parentheses.
If we believe that labor input is more effective at higher levels of education, effective labor input L∗ in the Cobb-Douglas production function could be weighted with education 20
SNF Working Paper No 25/09
levels. Hence I replace effective labor L∗ with L∗ = LI e¯I +
X
Li e¯i (1 + δi ) = L¯ e(1 + δM sM + δN sN ).
(5)
i=M,N
Subscripts I, M and N refer to incumbent workers, newly hired workers from MNEs and new hires from non-MNEs, respectively. The shares of newly hired workers of type N and M are adjusted with the average education level of the group relative to the average education level in the plant: si = (Li e¯i )/(L¯ e) for i = M, N . Results are reported in column 2 of table 9 and are similar to the results in column 1 of Table 8, though the coefficient on the share of workers with MNE-experience is smaller than without controlling for the education levels of the different types of workers. In column 3 I repeat the exercise of column 2, this time weighting labor input with average experience instead of average education. This increases the coefficient on the share of workers with MNE-experience. When looking at the characteristics of workers in non-MNEs it is the case that movers from MNEs to non-MNEs have on average longer education, but shorter experience than stayers in non-MNEs, see table 12. Hence, the changes in columns 2 and 3 relative to the comparable result in column 1 of table 8 are as expected. As figure 1 of section 3 also showed clear evidence of positive self-selection of workers into MNEs, the productivity premium associated with MNE-experience could be due to selection on unobservable characteristics, and therefore controlling for observable differences between groups of workers may not be enough. One way to control for unobservable characteristics is to repeat the exercise in columns 2 and 3, this time adjusting the labor input of each type of worker, I, M and N , with the average worker fixed effect from the fixed effect regressions in section 3. The results are reported in column 4. The coefficient on the share of newly hired workers with MNE-experience is reduced, but still positive and significant, and combined with the estimated labor input coefficient the result implies a productivity premium of 21% relative to incumbent workers.26 The share of newly hired workers from other non-MNEs does not have a significant impact on productivity. As a further check on the selection issue, figure 2 shows the distribution of the worker fixed effects in non-MNEs from estimating equation (3). The kernel density plots show no clear differences in the distribution of unobservable characteristics between stayers and workers coming to non-MNEs from other plants. Since the distribution of worker fixed 26
The estimated input coefficients are not reported in table 9, but are very similar to reported coefficients in table 8. The labor input coefficient in column 4 of table 9 is 0.385.
21
SNF Working Paper No 25/09
0
0
.5
.5
1
1
1.5
1.5
2
2
2.5
Figure 2: Distribution of worker fixed effects in non-MNEs
8.5
9
9.5
10
8.5
Stayers Movers without MNE−experience
9
9.5
10
Stayers Movers with MNE−experience
Notes: Kernel density plots of worker fixed effects estimated in section 3. Stayers are workers only observed in one plant (non-MNE) during the sample period. Movers from non-MNEs are workers observed in at least two different non-MNEs. Movers from MNEs are observed at least once in both a MNE and a non-MNE.
effects in figure 1 of section 3 showed clear positive selection on unobservables for workers in MNEs, one implication of figure 2 is that non-MNEs, when they hire workers from MNEs, actually draw workers from the lower end of the ability distribution in MNEs. This conjecture can be checked by wage regressions on workers in MNEs, where future movers from MNEs are compared to stayers in MNEs. I do this by giving dummies to future movers the last two years before they leave their plants and estimate wage equations using plant fixed effects. The coefficients on the dummies will tell us whether future movers are paid above or below stayers of similar observable characteristics in the same plant. The results of such regressions are shown in table 10. In the first column, future movers to nonMNEs are compared to all stayers in MNEs, and these movers are paid almost 3% lower than stayers. Future movers to other MNEs are not significantly different from stayers the last year before they leave, and are paid 1.3% more than stayers two years before they leave.27 In the second column, future movers are compared to stayers that I observe at least 5 years in the same plant, and this increases the negative premium of future movers to non-MNEs. 27
Workers that are only observed in one single manufacturing plant during my sample period are defined as stayers.
22
SNF Working Paper No 25/09
Table 10: Movers versus stayers: wages before move Movers from MNEs to MNEs, 1 year before move Movers from MNEs to MNEs, 2 year before move
.004
-.006
(.003)
(.003)
.013
.001 ∗
Movers from MNEs to non-MNEs, 1 year before move
(.003)
(.003)
-.029
-.043
∗
(.004)
Movers from MNEs to non-MNEs, 2 year before move N R2
(.004)∗
-.017
-.030
(.004)∗
(.005)∗
354,039 .51
296,352 .51
Notes: Wage regressions with plant fixed effects for workers in MNEs. Future movers are only included in the sample the last two years before moving. The reference group in column 1 consists of all workers only observed in one MNE during the sample period. Column 2 further restricts the reference group to workers observed at least 5 years. Control variables include the same plant and individual characteristics as in table 3, as well as year and year-industry interaction dummies. ∗ =significant at 0.1% level. Standard errors clustered on individuals in parentheses.
Robustness: Different productivity measures The Cobb-Douglas production function in equation (4) is restrictive in many respects. Table 11 reports the resulting coefficients on the shares of newly hired workers with and without MNE-experience from a number of alternative specifications of productivity. The first column imposes constant returns to scale in the production function. Column 2 reports the result of a more general specification of the production function where the input coefficients are allowed to vary across 3-digit industries.28 In the third column I use as dependent variable the residuals from estimating a Cobb-Douglas production function at the 2-digit industry level according to the method proposed by Levinsohn and Petrin (2003). The method is developed in order to address the simultaneity problem in estimates of production functions. In column 4 the dependent variable is a measure of total factor productivity based on a multilateral index suggested by Aw, Chen and Roberts (2001). The index is calculated separately for each 3-digit industry.29 Labor productivity is the dependent variable in the last column of table 11. The results in table 11 all point in the 28
I have also estimated equation (4) on each 2-digit sector separately, and this reveals that the result is mainly driven by the Norwegian machinery and equipment sector. This is the largest manufacturing sector in Norway, which employs around 35% of all manufacturing workers. 29 The calculation of this index is explained in the appendix.
23
SNF Working Paper No 25/09
same direction: newly hired workers with experience from MNEs contribute more to the productivity of their plant than newly hired workers from non-MNEs. Table 11: Robustness to different productivity measures Share of workers with experience from MNEs Share of workers with experience from non-MNEs N R2
.094
.104
.067
.181
.215
(.038)∗
(.030)∗∗
(.033)∗
(.074)∗
(.083)∗∗
.018
.036
.015
.112
.061
(.019)
(.017)
∗
(.018)
17016 .88
17011 .88
17016 .09
(.063)
(∗)
17016 .03
(.037)
17016 .05
Notes: Column 1 and 2 are estimates of equation 4 with dependent variable log(output): 1 imposes constant returns to scale, 2 allow input coefficients to vary by 3-digit sector. In columns 3-5 dependent variables are Levinsohn-Petrin residuals, a multilateral index of TFP, and labor productivity, respectively. Year and year-industry interaction dummies and plant fixed effects included in all columns. Standard errors clustered on plants in parentheses, ∗∗ , ∗ , (∗ )= significant at 1, 5 and 10%, respectively.
Taken together, the results presented here suggest that workers with MNE-experience contribute 20% more to the productivity of their plants than their colleagues without such experience (column 4 of table 9). The mean share of workers with recent MNE-experience is 2.8% for those non-MNEs that have workers with MNE-experience. Evaluated at the mean, these plants have 0.6% higher TFP than plants that have not recruited workers with MNEexperience. The productivity premium attributed to workers with MNE-experience is not associated with newly hired workers in general, as we do not find a similar productivity effect for newly hired workers without MNE-experience. The effects found are not likely to be driven by differences in worker characteristics or selection of workers, as the results are robust to controls for both observable and unobservable characteristics among workers in non-MNEs. Finally, the results are robust to several different measures of productivity.
6
Do workers benefit from mobility?
The results of the previous section indicated that workers with experience from MNEs are very important for the productivity of non-MNEs, and as such we would expect these workers to be rewarded in their new plants. The potential process of spillovers through labor mobility from MNEs to non-MNEs is similar to the process of R&D spillovers through labor mobility. The literature on R&D spillovers and labor mobility uses a human capital 24
SNF Working Paper No 25/09
framework and focuses in particular on the relationship between mobility and wages. Since at least part of the knowledge acquired in a firm will move with the worker in the case of mobility, workers that get access to training/knowledge should be willing to pay for this by accepting a current pay cut in expectation of future private returns (Pakes and Nitzan, 1983). Table 12 shows mean wage growth in percent from the year before moving to the year after moving for different groups of movers. Their wage growth is also compared to the mean annual wage growth of workers who never change plant (stayers). The average wage growth of stayers is around 3% per year, while the movers experience wage growth of more than 5% upon moving from their old plant to a new one. Workers that move from a MNE to a non-MNE-experience on average a wage growth of 7%, while the wage growth for movers in the opposite direction is 8.1%. These growth rates are higher than for workers that change plants within the group of MNEs or non-MNEs (5.6 and 5.8%).30 The difference between average wage growth in the year of moving compared to annual average wage growth in the sample indicates that most job changes are voluntary, and that the movers increase their wage as a result of moving. This is consistent with the view that workers are attracted to their new plants by a deliberate policy by the hiring plant to acquire new workers to get access to their knowledge. It is also consistent with the view that the moving workers are earning a private return on general training received by the previous employer, and that this return is larger with a new employer who has not paid any of the training costs (Loewenstein and Spletzer, 1999). Table 12: Characteristics of movers and stayers Movers from non-MNEs non-MNEs MNEs Wage before move Wage after move Wagechange Tenure Age Education N
23,335 23,954 5.8 4.6 36.4 10.8 23,215
Movers from MNEs non-MNE MNE
24,200 25,303 8.1 3.9 35.0 11.0 8,170
24,586 26,294 25,548 27,244 7.0 5.6 4.0 6.4 34.6 38.1 11.2 11.2 6,388 15,569
Stayers non-MNEs MNEs
23,283 25,699 23,212 25,819 3.0 3.3 8.6 9.0 41.2 40.9 10.4 10.9 57,3561 310,617
In Table 12 the wage growth for MNE to non-MNE movers and for non-MNE to MNE 30 Martins (2006) and Pesola (2007) investigate the private returns to mobility from foreign to domestic firms in Portugal and Finland, respectively. In Portugal foreign to domestic movers on average experience a pay cut upon moving, while the opposite is the case in Finland.
25
SNF Working Paper No 25/09
movers is very similar. In fact, the movers from non-MNEs to MNEs experience on average a larger wage jump than movers in the other direction. As the wage growth numbers in Table 12 are unconditional means, they may be systematically affected by the characteristics of the movers or the plants they move between. For instance, when interpreting the wage growth of 8.1% for movers from non-MNEs to MNEs, we must bear in mind that most of these moves mean that the worker moves from a small plant to a larger plant (as the average size of MNEs is much larger than for non-MNEs). And since wages are positively correlated with plant size, the change in plant size may be an important factor in explaining the wage growth for non-MNE to MNE movers. In table 10 we saw that movers from MNEs to non-MNEs were negatively selected out of their old plants, since they are paid around 3% below colleagues with similar observable characteristics the year before they move. Figure 2 also showed that in terms of unobserved worker characteristics, workers with MNE experience in non-MNEs are similar to the other workers in non-MNEs. What remains to be seen is to what extent the experience from MNEs are rewarded in their new plants. In order to investigate this I estimate wage equations for workers in non-MNEs, and compare the wages of the movers to those of stayers in non-MNEs. I use dummies to indicate workers who are new to the plant, and take the reference group to be stayers. wit = β0 +
X s=l,m,h
βs M N Eis +
X
0 βs nonM N Eis +Xit0 β3 +Fj(it) β4 +vj +vt +vt ∗vI +eit . (6)
s=l,m,h
As before, wit is the log real wage of worker i, Xit and Fj(it) contains the observable individual and plant characteristics. M N Eis is a dummy equal to one if the worker is new to plant j, came from a MNE, and has tenure of s from the MNE. I divide tenure into low, medium and high and set the thresholds at below 1 year, 1-3 years and 3 years and above respectively. Similarly, nonM N Eis is a dummy for workers that are new to plant j, but came from a different non-MNE. In addition, equation (6) includes plant and time fixed effects, and industry-year interaction terms. Results are presented in table 13. In the first column, the reference group consists of all stayers in non-MNEs, while the second column restricts the stayers to be observed at least 5 years in the plant. Movers from MNEs to non-MNEs earn a wage premium relative to the stayers in non-MNEs, and the wage premium increases with the length of tenure from the MNE. Compared to all stayers, workers coming from MNEs with more than 3 years of tenure from the MNE earn almost 7% more than comparable workers in the same
26
SNF Working Paper No 25/09
plant the first full year after they come to the non-MNE. The similar wage premium for workers from other non-MNEs is 3,3%. If we compare these movers to stayers that are observed many years in the plant, we naturally get a somewhat smaller wage premium for the new workers, but still those moving from MNEs have a premium more than twice the size of new workers form other non-MNEs.31 Thus, even though the results in Table 10 indicated negative selection of workers from MNEs to non-MNEs, these movers are clearly doing better than their colleagues in their new plant.32 Table 13: Movers versus stayers in non-MNEs: wages after move Movers from MNEs, MNE-tenure =3 years
(.008)
(.008)∗
.069
.048 ∗
(.008)∗
.016
-.007
(.005)∗
(.005)
(.008)
Movers from non-MNEs, non-MNE-tenure =3 years
.042
.022
(.005)∗
(.005)∗
.033
.019 ∗
N R2
(.004)
(.005)∗
450,540 .47
363,522 .47
Notes: Wage regressions with plant fixed effects for workers in MNEs. Movers are only included in the sample the first year after moving. The reference group in column 1 consists of all workers only observed in one non-MNE during the sample period. Column 2 further restricts the reference group to workers observed at least 5 years. Control variables include the same plant and individual characteristics as in table 3, as well as year and year-industry interaction dummies. ∗ =significant at 0.1% level. Standard errors clustered on individuals in parentheses.
31
When repeating the regressions in table 13 using the sample of workers in MNEs, and comparing stayers in these plants with workers coming from other plants, I find no evidence that movers from nonMNEs to MNEs are rewarded for their experience from the non-MNE over and above tenure and experience in general. 32 Similarly, Martins (2006) and Pesola (2007) find that previous tenure from foreign plants pays off after moving to domestic plants.
27
SNF Working Paper No 25/09
7
Conclusions
The evidence provided in this paper is consistent with labor mobility from MNEs to nonMNEs working as a channel for spillovers. First, as MNEs pay higher wages than nonMNEs, this suggests that MNEs have a firm-specific advantage, and hence that there is a potential for spillovers. Second, during the 1990s an increasing share of non-MNEs employ workers with previous experience from MNEs. Third, workers with MNE-experience contribute substantially to the productivity of their new plants. According to the estimates in this paper, workers with MNE-experience contribute 20% more to the productivity of non-MNEs than workers without such experience, even after controlling for unobservable characteristics of the workers. Thus, mobility is clearly a channel for knowledge diffusion in Norwegian manufacturing. Fourth, workers moving from MNEs to non-MNEs are rewarded in terms of higher wages in their new plants. This private return to mobility is an indication that the hiring plants value the knowledge these workers bring with them, and it is consistent with the productivity effects found at the plant level. The wage premium for movers from MNEs to non-MNEs with more than 3 years of experience from MNEs is almost 5% compared to stayers in non-MNEs with similar characteristics. This 5% wage premium is far less than the 20% productivity premium these workers have relative to workers without MNE-experience in non-MNEs. The difference between the wage premium and the productivity effect suggests that the hiring non-MNEs do not fully pay for the value of the workers to the firm, and thus labor mobility from MNEs to non-MNEs seems to be a source of knowledge externalities in Norwegian manufacturing.
References [1] Aw, Yan Bee, Xiaomin Chen and Mark J. Roberts (2001), ‘Firm-level Evidence on Productivity Differentials and Turnover in Taiwanese Manufacturing’, Journal of Development Economics 66:51–86. [2] Abowd, John, Robert Creecy and Francis Kramarz (2002), ‘Computing Person and Firm Effects using Linked Longitudinal Employer-Employee Data’, Cornell University Working Paper. [3] Aitken, Brian and Ann Harrison (1999), ‘Do Domestic Firms Benefit from Direct Foreign Investment?’, American Economic Review 89(3): 605–618.
28
SNF Working Paper No 25/09
[4] Aitken, Brian; Harrison, Ann and Robert E. Lipsey (1996), ‘Wages and Foreign Ownership: A Comparative Study of Mexico, Venezuela, and the United States’, Journal of International Economics 40(3-4): 345–371. [5] Bellak, Christian (2004), ‘How Domestic and Foreign Firms Differ and Why Does it Matter?’, Journal of Economic Surveys 18(4): 483–514. [6] Bernard, Andrew and Fredrik Sjøholm (2003), ‘Foreign Owners and Plant Survival’, NBER Working Paper No. 10039, New York. [7] Blundell, Richard and Stephen Bond (1998), ‘Initial Conditions and Moment Restrictions in Dynamic Panel Data Models’, Journal of Econometrics 87(1): 115–143. [8] Budd, John W. and Matthew J. Slaughter (2004), ‘Are Profits Shared across Borders? Evidence on International Rent Sharing’, Journal of Labor Economics 22(3): 525–552. [9] Caves, Douglas W.; Christensen, Laurits R. and W. Erwin Diewert (1982), ‘Multilateral Comparisons of Output, Input and Productivity Using Superlative Index Numbers’, Economic Journal 92: 73-86. [10] Cornelissen, Thomas (2008), ‘The Stata command felsdvreg to fit a linear model with two highdimensional fixed effects’, Stata Journal ((2): 170–189. [11] Driffield, Nigel and Sourafel Girma (2003), ‘Regional Foreign Direct Investment and Wage Spillovers: Plant Level Evidence from the UK Electronics Industry’, Oxford Bulletin of Economics and Statistics 65(4): 453–474. [12] Dunning John H. (1981), ‘International Production and the Multinational Enterprise’, London, George Allen and Unwin. [13] Fabbri, Francesca; Haskel, Jonathan E. and Matthew J. Slaughter (2003), ‘Does Nationality of Ownership Matter for Labor Demands?’, Journal of the European Economic Association 1(2-3): 698–707. [14] Fosfuri, Andrea; Motta, Massimo and Thomas R¨onde (2001), ‘Foreign Direct Investment Spillovers through Workers’ Mobility’, Journal of International Economics 53(1): 205–222.
29
SNF Working Paper No 25/09
[15] Girma, Soufarel; Greenaway, David and Katharine Wakelin (2001), ‘Who Benefits from Foreign Direct Investment in the UK?’, Scottish Journal of Political Economy 48(2): 119–131. [16] Glass, Amy J. and Kamal Saggi (2002), ‘Multinational Firms and Technology Transfer’, Scandinavian Journal of Economics 104(4): 495–513. [17] G¨org, Holger and David Greenaway (2004), ‘Much Ado about Nothing? Do Domestic Firms Really Benefit from Foreign Direct Investment?’, World Bank Research Observer 19(2): 171–197. [18] G¨org, Holger and Eric Strobl (2005), ‘Spillovers from Foreign Firms through Worker Mobility: An Empirical Investigation’, Scandinavian Journal of Economics 107(4): 693–709. [19] Griliches, Zvi (1967), ‘Production Functions in Manufacturing: Some Preliminary Results’, in M. Brown (ed.) The Theory and Empirical Analysis of Production, Studies in Income and Wealth, Vol. 31, NBER, New York. [20] Griliches, Zvi (1986), ‘Productivity, R&D, and Basic Research at the Firm Level in the 1970s’, American Economic Review 76(1): 141–154. [21] Haskel, Jonathan E.; Pereira, Sonia C. and Matthew J. Slaughter (2007), ‘Does Inward Foreign Direct Investment Boost the Productivity of Domestic Firms’, Review of Economics and Statistics 89(3): 482-496. [22] Heyman, Fredrik; Sj¨oholm, Fredrik and Patrik Gustavsson Tingvall (2007), ‘Is There Really a Foreign Ownership Wage Premium? Evidence from Matched EmployerEmployee Data’, Journal of International Economics 73: 355–376. [23] Levinsohn, James and Amil Petrin (2003), ‘Estimating Production Functions Using Inputs to Control for Unobservables’, Review of Economic Studies 70(2): 317–341. [24] Loewenstein, Mark A. and James R. Spletzer (1999), ‘General and Specific Training: Evidence and Implications’, Journal of Human Resources 34(4): 710–733. [25] Markusen, James R. (1995), ‘The Boundaries of Multinational Enterprises and the Theory of International Trade’, Journal of Economic Perspectives 9(2): 169–189.
30
SNF Working Paper No 25/09
[26] Martins, Pedro (2004), ‘Do Foreign Firms Really Pay Higher Wages? Evidence from Different Estimators’, IZA Bonn, Discussion Paper No. 1388. [27] Martins, Pedro (2006), ‘Inter-firm Employee Mobility, Displacement and Foreign Direct Investment Spillovers’, mimeo, Queen Mary, University of London. [28] Martins, Pedro and Luiz A. Esteves (2008), ‘Foreign Ownership, Employment and Wages in Brazil: Evidence from Acquisitions, Divestments and Job Movers’, IZA DP No. 3542, Bonn. [29] Møen, Jarle (2005), ‘Is Mobility of Technical Personnel a Source of R&D Spillovers?’, Journal of Labor Economics 23(1): 81–114. [30] Møen, Jarle; Salvanes, Kjell G. and Erik Ø. Sørensen (2004), ‘Documentation of the Linked Employer-Employee Data Base at the Norwegian School of Economics and Business Administration’, mimeo, Norwegian School of Economics and Business Administration, Bergen. [31] Nickell, Stephen (1996), ‘Competition and Corporate Performance.’, Journal of Political Economy 104(4): 724–746. [32] Pakes, Ariel and Shmuel Nitzan (1983), ‘Optimum Contracts for Research Personnel, Research Employment, and the Establishment of ‘Rival’ Enterprises’, Journal of Labor Economics 1(4): 345–65. [33] Pesola, Hanna (2007), ‘Foreign Ownership, Labor Mobility and Wages’, Helsinki Center of Economic Research, Discussion Paper No. 175. [34] Poole, Jennifer P. (2009), ‘Knowledge Transfers from Multinational to Domestic Firms: Evidence from Worker Mobility’, mimeo, University of California, Santa Cruz. [35] Salvanes, Kjell G. and Svein E. Førre (2003), ‘Effects on Employment of Trade and Technical Change: Evidence from Norway,’ Economica 70(278): 293–329. [36] Smarzynska-Javorcik, Beata (2004), ‘Does Foreign Direct Investment Increase the Productivity of Domestic Firms? In Search of Spillovers through Backward Linkages’, American Economic Review 94(3): 605–627.
31
SNF Working Paper No 25/09
Appendix Definition of variables used in the production function (4) in section 5. Lit Number of person hours in the plant. Rented labor hours are calculated from the costs of rented labor using the calculated average wage for own employees. Since only blue-collar hours are reported prior to 1983, and only total hours from 1983, total hours before 1983 are estimated by using information on the blue-collar share of the total wage bill. Kit The estimate of capital services uses the following aggregation: Kit = Rit + (0.07 + δ m )Vitm + (0.07 + δ b )Vitb , where Rit is the cost of rented capital in the plant, Vitm and Vitb are the estimated values of machinery and buildings at the beginning of the year, δ m = 0.06 and δ b = 0.02 are the depreciation rates. The rate of return to capital is taken to be 0.07. The values for depreciation rates and the rate of return to capital are also used by Salvanes and Førre (2003) using the same data. The estimated values of buildings and machinery are obtained from information on fire insurance values. To reduce noise and avoid discarding too many observations with missing fire insurance values, these values are smoothed using the perpetual inventory method. Fire insurance values are not recorded after 1995, thus from 1996 capital values are estimated by adding investments and taking account of depreciation. Separate price deflators for investment in buildings and machinery are obtained from Statistics Norway. The aggregation level for the price deflators is according to the sector classification used in the National Accounts, which is somewhere in between the 2- and 3-digit ISIC level. Mit Total cost of materials used. Since this variable in the data includes rented labor and capital, I subtract these and allocate them to the labor and capital measures respectively. The costs of materials used is deflated with a separate index of input prices obtained from Statistics Norway. The aggregation level for the price deflator is according to the sector classification used in the National Accounts, which is somewhere in between the 2- and 3-digit ISIC level. Yit Gross production value net of sales taxes and subsidies. Output is deflated with a 32
SNF Working Paper No 25/09
separate index of output prices obtained from Statistics Norway. The aggregation level for the price deflator is according to the sector classification used in the National Accounts, which is somewhere in between the 2- and 3-digit ISIC level. The multilateral index of TFP used as dependent variable in column 4 of table 11 is proposed by Aw, Chen and Roberts (2001) as an extension of the index derived by Caves et al. (1982). The index is calculated separately for each 3-digit sector, and takes as its reference point a hypothetical average plant in the base year. The index tracks for each plant the deviations in input use and output from this reference point of average input use and average output in the base year. The index is calculated using the following formula ln T F Pit
g = (ln Yit − ln Yt ) +
t X
] ^ (ln Yτ − ln Yτ −1 )
τ =2 X 1 f (Sjit + Sf − jt )(ln Xjit − Xjt ) 2 j=k,l,m
(7)
t X X 1 ^ ] ^ (Sf − jτ + Sjτ −1 )(ln Xjτ − ln Xjτ −1 ). 2 τ =2 j=k,l,m
where i denotes the plant, t year, and j the inputs of capital, labor and materials. Inputs and output are defined as above. The first term expresses plant output in year t relative to average output that year, and the second term sums the changes over time in average output from the base year. Sjit is the plant level cost share for input j in year t, while Sf jt is the average cost share of the sector in year t. This index measures the proportional difference in the TFP of a plant in year t relative to the hypothetical plant in the base year.
33