Evolution of the Aging Brain Transcriptome and Synaptic Regulation Patrick M. Loerch1,5., Tao Lu1., Kelly A. Dakin1, James M. Vann2, Adrian Isaacs1, Chengiz Geula3, Jianbin Wang4, Ying Pan1, Dana H. Gabuzda4, Cheng Li5, Tomas A. Prolla2, Bruce A. Yankner1* 1 Department of Pathology, Harvard Medical School, Boston, Massachusetts, United States of America, 2 Department of Genetics and Medical Genetics, University of Wisconsin, Madison, Wisconsin, United States of America, 3 Cognitive Neurology and Alzheimer’s Disease Center, Northwestern University, Chicago, Illinois, United States of America, 4 Department of Cancer Immunology and AIDS, Dana-Farber Cancer Institute, Harvard Medical School, Boston, Massachusetts, United States of America, 5 Department of Biostatistics, Dana-Farber Cancer Institute, Harvard School of Public Health, Boston, Massachusetts, United States of America
Abstract Alzheimer’s disease and other neurodegenerative disorders of aging are characterized by clinical and pathological features that are relatively specific to humans. To obtain greater insight into how brain aging has evolved, we compared age-related gene expression changes in the cortex of humans, rhesus macaques, and mice on a genome-wide scale. A small subset of gene expression changes are conserved in all three species, including robust age-dependent upregulation of the neuroprotective gene apolipoprotein D (APOD) and downregulation of the synaptic cAMP signaling gene calcium/ calmodulin-dependent protein kinase IV (CAMK4). However, analysis of gene ontology and cell type localization shows that humans and rhesus macaques have diverged from mice due to a dramatic increase in age-dependent repression of neuronal genes. Many of these age-regulated neuronal genes are associated with synaptic function. Notably, genes associated with GABA-ergic inhibitory function are robustly age-downregulated in humans but not in mice at the level of both mRNA and protein. Gene downregulation was not associated with overall neuronal or synaptic loss. Thus, repression of neuronal gene expression is a prominent and recently evolved feature of brain aging in humans and rhesus macaques that may alter neural networks and contribute to age-related cognitive changes. Citation: Loerch PM, Lu T, Dakin KA, Vann JM, Isaacs A, et al. (2008) Evolution of the Aging Brain Transcriptome and Synaptic Regulation. PLoS ONE 3(10): e3329. doi:10.1371/journal.pone.0003329 Editor: Laszlo Orban, Temasek Life Sciences Laboratory, Singapore Received April 7, 2008; Accepted August 25, 2008; Published October 2, 2008 Copyright: ß 2008 Loerch et al. This is an open-access article distributed under the terms of the Creative Commons Attribution License, which permits unrestricted use, distribution, and reproduction in any medium, provided the original author and source are credited. Funding: This work was supported by grants from the National Institute on Aging (grant numbers AG26651, AG27040, AG27916), and an Ellison Medical Foundation Senior Scholar award to B.A.Y.. P.L. was supported by NIH training grant T32GM074897. Competing Interests: The authors have declared that no competing interests exist. * E-mail:
[email protected] . These authors contributed equally to this work.
Introduction
Results
Aging is the primary risk factor for Alzheimer’s disease and other prevalent neurodegenerative disorders [1,2]. Little is known, however, about the degree to which normal brain aging is conserved among mammalian species, an issue of central importance in the biology of aging and the development of animal models of human neurological diseases [3]. Gene expression changes that appear during normal brain aging have been explored using microarrays that interrogate only part of the genome in a number of species, including mice, rats, monkeys, and humans [4,5,6,7]. Comparison of the partial expression profiles of the aging mouse and human brain did not show significant overlap [8]. However, there has yet to be a systematic comparison of gene expression at a genome-wide scale in aging mice, monkeys, and humans. Recent advances in sequencing the rhesus macaque, mouse, and human genomes have enabled us to perform a genome-scale comparative analysis of gene expression in the aging mammalian brain [9,10,11,12]. Although a small subset of agerelated gene expression changes are conserved from mouse to man, major changes in the expression of genes involved in neurotransmission have evolved in the primate cortex that are potentially relevant to age-related changes in cognition and vulnerability to neurodegeneration.
Phylogenetic Analysis of Brain Aging in Humans, Rhesus Macaques, and Mice
PLoS ONE | www.plosone.org
A central issue in a cross-species comparative analysis of aging is the identification of similar aging groups in species with very different maximal life spans. We previously defined the expression profile for age-related expression changes in the human cortex and demonstrated that these changes occur in the majority of individuals by the age of 70 years [6]. We used this expression profile as the basis for defining our aged group in humans as individuals older than 70 years of age who were not diagnosed with a neurodegenerative disorder (Table S1). To identify a similar age group in mice, we used comparative survival curves for humans and mice which suggest that a 30-month-old mouse is similar to an 81-year-old human since at these ages approximately 25% of the original populations survive. A similar survival analysis in rhesus monkeys in captivity determined that 25% survival occurred at approximately 26 years of age [13]. Hence, we chose 30 months and 28–31 years as the aged groups for mice and rhesus monkeys, respectively. To identify age-related changes in gene expression, cortical samples from 13 young (#40 years old) and 15 aged ($70 years 1
October 2008 | Volume 3 | Issue 10 | e3329
Evolution of the Aging Brain
regulated genes that are conserved among all three species. II. Genes that change with age in all 3 species but differ in directionality between mouse and rhesus (e.g., from age-downregulated to age-upregulated); and III. Age-regulated genes that change directionality between rhesus and human (Fig. 2 and Table 1). Among the category I genes conserved in all 3 species, the most robustly age-upregulated gene was the anti-oxidant lipid binding protein apolipoprotein D. The most robustly agedownregulated genes in the conserved category were CAMK4, a component of synaptic cAMP-mediated signaling, and ARPP-21, a phosphoprotein also implicated in neuronal cAMP signaling [14] (Table 1). The genes in category II were composed almost entirely of genes that are age-upregulated in mice and downregulated in both rhesus monkeys and humans, defining a set of age-related gene expression changes common to rhesus monkeys and humans. The most robustly downregulated of these primate aging genes was calbindin 1 (CALB1), a marker of cortical inhibitory interneurons (Table 1).
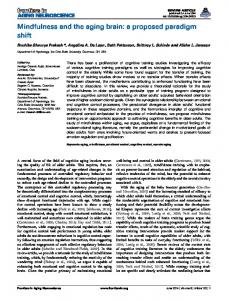
old) humans were hybridized to Affymetrix U133plus 2.0 arrays, 5-month-old (n = 5) and 30-month-old mice (n = 5) were hybridized to Affymetrix Mouse 430 2.0 arrays, and samples from 5–6year-old (n = 5) and 28–31-year-old (n = 6) rhesus macaques were hybridized to Affymetrix whole genome rhesus arrays. Since the rhesus macaque genome has only recently been sequenced [9], the rhesus microarrays are based primarily on gene predictions. Therefore, we used an all-against-all protein BLAST to identify orthologous genes between the rhesus predictions and the other two species. For each homolog pair, we required a BLAST score of greater than 200, and at least 80% alignment of the human or mouse protein sequence with the rhesus sequence (Table S2). The final gene set was composed of genes that possess an ortholog in every species and are represented on all three array platforms. We then employed a two-sample t-test between young and aged age groups with a 1% false discovery rate (FDR) cut-off to identify 3542, 573, and 2347 age-related genes in mice, rhesus monkeys, and humans, respectively (Tables S3–5). Among these age-related changes, only 154 were significantly associated with aging in all three species (Fig. 1a and Table S6). To assess this gene group as an indicator of brain aging, the behavior of all 154 genes was compared across age groups and species to derive Pearson correlation coefficients. The resulting correlation matrix showed that this core gene set distinguishes between young and aged samples in all three species (Fig. 1b). Furthermore, this set of age-related gene expression changes distinguished between chronological and biological age. For example, a 30-year-old rhesus monkey more closely resembled a 70-year-old human than a 30-year-old human. This set of common age related expression changes is therefore linked to the biology of the aging process in the brain. Hierarchical clustering of the common age-regulated genes demonstrated that they fall into three distinct groups: I. Age-
Cell-Type Enrichment of Age-Related Gene Expression Changes To identify the cell types in the brain that exhibit prominent age-related changes in gene expression, we utilized the Allen Brain Atlas [15]. This database, derived by in situ hybridization and 3dimensional imaging of the adult mouse brain (56 days old), includes genes in which expression was significantly enriched in one of five specific cell types. By combining this cell type analysis with our mouse gene expression data, a subset of age-related gene expression changes was localized to specific cell types. To determine whether the mouse brain dataset predicts the cell type distribution of these genes in the human brain, we performed microarray analysis of isolated neurons, astrocytes, and microglial
Figure 1. Genome-wide comparison of brain aging in humans, rhesus macaques, and mice. a. Venn diagram indicating the extent of overlap in age-related gene expression changes between the three species. The size of each circle corresponds to the number of age-related expression changes in each species. b. A group of 154 common aging genes provides an indicator of biological aging in all three species. Shown is a matrix of Pearson correlation coefficients that indicate the degree of overall similarity between any two samples (see Methods). Positively correlated sample pairs are indicated by red and negatively correlated pairs are indicated by blue. The degree of correlation correlates with color intensity. The species and age groups are indicated (Human: young #40 years; aged $70 years. Rhesus macaque: young 5–6 years; aged 28–31 years. Mouse: young 5 months; aged 30 months). doi:10.1371/journal.pone.0003329.g001
PLoS ONE | www.plosone.org
2
October 2008 | Volume 3 | Issue 10 | e3329
Evolution of the Aging Brain
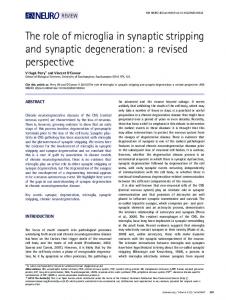
Figure 2. Age-regulated genes common to humans, rhesus macaques, and mice. The transcriptional profiles of genes that are ageregulated in all three species were analyzed by hierarchical clustering. Reduced expressed with aging is indicated by a transition from red in the young to blue in the aged, and vice versa. Genes separate into three groups based on whether the direction of age-related changes (i.e., ageupregulated or age-downregulated) is conserved in all three species (category I), changes between mice and rhesus macaques (category II), or changes between rhesus macaques and humans (category III). Also indicated is the evolutionary time of divergence in years for each pair of species based on analysis of protein sequence alignments [37]. doi:10.1371/journal.pone.0003329.g002
PLoS ONE | www.plosone.org
3
October 2008 | Volume 3 | Issue 10 | e3329
Evolution of the Aging Brain
Table 1. Age-regulated genes common to humans, rhesus macaques, and mice.
Gene Description
I.
Gene Symbol
Q-Value (%)
Fold Change
Human
Rhesus
Mouse
Human
Rhesus
Mouse
Phylogenetically Conserved Aging Genes
apolipoprotein D
APOD
0.035
0.856
0.017
2.251
4.006
2.245
G protein-coupled receptor, family C, group 5, member B
GPRC5B
0.279
0.232
0.017
1.642
1.412
1.415
tripeptidyl peptidase I
TPP1
0.390
0.438
0.017
1.496
1.247
1.145
ribosomal protein S9
RPS9
0.549
0.232
0.028
1.337
1.754
1.270
calnexin
CANX
0.090
0.232
0.057
1.200
1.371
1.677
solute carrier family 35 (UDP-galactose transporter), member A2
SLC35A2
0.035
0.438
0.028
21.136
21.525
21.447
Cofactor required for Sp1 transcriptional activation, subunit 8, 34 kDa
CRSP8
0.195
0.856
0.120
21.175
21.323
21.323
Hypothetical protein MGC29898
MGC29898
0.279
0.232
0.776
21.195
21.967
21.306
glutathione synthetase
GSS
0.279
0.438
0.348
21.200
21.534
21.603
ubiquitin-conjugating enzyme E2Q (putative) 1
UBE2Q1
0.549
0.720
0.639
21.202
21.534
21.249
tRNA methyltranferase 12 homolog (S. cerevisiae)
TRMT12
0.740
0.501
0.240
21.229
21.452
21.538
eukaryotic translation termination factor 1
ETF1
0.195
0.856
0.412
21.231
21.409
21.215
hypothetical protein FLJ20232
RP5-1104E15.5
0.020
0.943
0.776
21.244
21.304
21.283
dual specificity phosphatase 14
DUSP14
0.065
0.856
0.057
21.260
21.296
21.428
member RAS oncogene family
RAB14
0.035
0.537
0.288
21.294
21.547
21.314
Transmembrane protein 49
TMEM49
0.020
0.943
0.017
21.299
21.535
21.613
NEDD8-conjugating enzyme
UBE2F
0.020
0.534
0.288
21.300
21.467
21.119
zinc finger protein 64 homolog (mouse)
ZFP64
0.090
0.856
0.348
21.304
21.623
21.508
transmembrane protein vezatin
VEZT
0.020
0.943
0.288
21.318
21.608
21.293
transmembrane protein 4
TMEM4
0.020
0.537
0.120
21.351
22.788
21.307
tribbles homolog 2 (Drosophila)
TRIB2
0.965
0.232
0.949
21.365
21.520
21.209
Glutamine-fructose-6-phosphate transaminase 1
GFPT1
0.035
0.639
0.949
21.385
21.600
21.923
protein disulfide isomerase family A, member 6
PDIA6
0.020
0.856
0.240
21.436
21.419
21.303
Metallophosphoesterase domain containing 1
MPPED1
0.020
0.943
0.120
21.441
21.457
21.307
armadillo repeat containing 8
ARMC8
0.195
0.438
0.057
21.454
21.472
21.331
Ribonuclease H1
RNASEH1
0.020
0.599
0.120
21.478
21.425
21.174
kelch repeat and BTB (POZ) domain containing 6
KBTBD6
0.020
0.537
0.057
21.479
21.548
21.539
Membrane-associated ring finger (C3HC4) 1
MARCH1
0.195
0.639
0.120
21.481
21.361
21.977
Acetoacetyl-CoA synthetase
AACS
0.020
0.775
0.412
21.517
21.347
21.456
adrenergic, beta, receptor kinase 2
ADRBK2
0.020
0.856
0.057
21.525
22.077
21.335
golgi autoantigen, golgin subfamily a, 1
GOLGA1
0.020
0.856
0.412
21.565
21.542
21.192
transmembrane protein 14B
TMEM14B
0.020
0.438
0.039
21.619
21.876
21.240
Transforming growth factor, beta receptor associated protein 1
TGFBRAP1
0.090
0.775
0.776
21.738
21.226
21.117
Cyclic AMP-regulated phosphoprotein, 21 kD
ARPP-21
0.020
0.232
0.017
21.953
21.457
21.137
Calcium/calmodulin-dependent protein kinase IV
CAMK4
0.020
0.438
0.193
22.174
22.111
21.560
II.
Aging Genes that Diverged Between Mice and Rhesus Monkeys
calbindin 1, 28 kDa
CALB1
0.020
0.880
0.348
23.722
21.629
1.281
neuronal pentraxin II
NPTX2
0.020
0.880
0.017
22.340
21.815
1.323
chromobox homolog 6
CBX6
0.020
0.943
0.017
22.305
21.199
1.377
adenylate cyclase 2 (brain)
ADCY2
0.020
0.856
0.193
21.973
21.264
1.109
tubulin tyrosine ligase
TTL
0.020
0.599
0.057
21.964
21.527
1.198
3-hydroxy-3-methylglutaryl-Coenzyme A reductase
HMGCR
0.020
0.232
0.288
21.866
21.367
1.469
hepatic leukemia factor
HLF
0.020
0.639
0.017
21.851
21.250
1.337
similar to hepatocellular carcinoma-associated antigen HCA557b
LOC151194
0.020
0.501
0.240
21.838
21.479
1.127
trophoblast glycoprotein
TPBG
0.020
0.438
0.017
21.809
21.988
1.563
phospholipase C-like 2
PLCL2
0.020
0.375
0.017
21.770
21.566
1.163
Fusion (involved in t(12;16) in malignant liposarcoma)
FUS
0.020
0.959
0.412
21.743
21.535
1.145
PLoS ONE | www.plosone.org
4
October 2008 | Volume 3 | Issue 10 | e3329
Evolution of the Aging Brain
Table 1. cont.
Gene Description
Gene Symbol
Q-Value (%)
Fold Change
Human
Rhesus
Mouse
Human
Rhesus
Mouse
21.725
21.074
1.202
protein phosphatase 3 (formerly 2B), catalytic subunit, beta isoform (calcineurin A beta)
PPP3CB
0.020
0.720
0.039
KIAA1944 protein
KIAA1944
0.020
0.232
0.949
21.687
21.673
1.169
Chromosome 18 open reading frame 1
C18orf1
0.020
0.537
0.949
21.650
21.299
1.331
phosphodiesterase 4D interacting protein (myomegalin)
PDE4DIP
0.195
0.534
0.057
21.640
21.333
1.292
similar to aspartate beta hydroxylase (ASPH)
ASPHD2
0.020
0.232
0.120
21.628
21.494
1.154
discs, large homolog 3 (neuroendocrine-dlg, Drosophila)
DLG3
0.020
0.880
0.085
21.610
21.228
1.124
adrenergic, alpha-2A-, receptor
ADRA2A
0.020
0.232
0.639
21.597
22.092
1.306
component of oligomeric golgi complex 8
COG8
0.020
0.775
0.017
21.557
21.327
1.274
protein tyrosine phosphatase, non-receptor type 3
PTPN3
0.020
0.856
0.949
21.538
21.701
1.201
Small nuclear ribonucleoprotein polypeptide A9
SNRPA1
0.020
0.943
0.146
21.528
21.217
1.250
RAS guanyl releasing protein 1 (calcium and DAG-regulated)
RASGRP1
0.020
0.232
0.098
21.525
21.648
1.150
Signal-induced proliferation-associated 1 like 2
SIPA1L2
0.020
0.232
0.500
21.520
22.293
1.189
Ubiquitin carboxyl-terminal hydrolase L5
UCHL5
0.020
0.775
0.028
21.492
21.999
1.357
neuregulin 3
NRG3
0.020
0.959
0.017
21.491
21.293
1.216
tubulin, alpha 1 (testis specific)
TUBA1
0.020
0.438
0.949
21.486
21.289
1.067
solute carrier family 36 (proton/amino acid symporter), member 1
SLC36A1
0.065
0.232
0.146
21.482
21.860
1.235
opsin 3 (encephalopsin, panopsin)
OPN3
0.020
0.943
0.057
21.478
21.430
1.268
bicaudal D homolog 2 (Drosophila)
BICD2
0.020
0.501
0.017
21.470
21.523
1.426
p21(CDKN1A)-activated kinase 7
PAK7
0.020
0.959
0.017
21.455
21.343
1.534
chromosome 21 open reading frame 5
DOPEY2
0.035
0.232
0.017
21.453
21.667
1.272
Nuclear factor I/B
NFIB
0.195
0.856
0.348
21.450
21.230
1.209
membrane associated guanylate kinase, WW and PDZ domain containing 1
MAGI1
0.020
0.639
0.500
21.450
21.364
1.167
TNF receptor-associated factor 3
TRAF3
0.279
0.232
0.776
21.447
21.498
1.112
small glutamine-rich tetratricopeptide repeat (TPR)-containing, beta
SGTB
0.090
0.959
0.017
21.445
21.806
1.316
hypothetical protein FLJ20701
FLJ20701
0.020
0.720
0.146
21.442
21.208
1.175
LanC lantibiotic synthetase component C-like 2 (bacterial)
LANCL2
0.020
0.639
0.639
21.440
21.380
1.113
Rho GTPase-activating protein
RICS
0.065
0.880
0.240
21.437
21.507
1.141
chromosome 10 open reading frame 9
C10orf9
0.020
0.856
0.017
21.425
21.379
1.490
dual-specificity tyrosine-(Y)-phosphorylation regulated kinase 2
DYRK2
0.195
0.232
0.039
21.422
21.821
1.251
Zinc finger protein 148 (pHZ-52)
ZNF148
0.020
0.599
0.017
21.420
21.336
1.320
similar to BcDNA:GH11415 gene product
C3orf59
0.020
0.232
0.017
21.412
21.333
1.689
importin 11
IPO11
0.195
0.880
0.017
21.408
21.358
1.334
neuronal pentraxin receptor
NPTXR
0.090
0.943
0.288
21.407
21.199
1.310
solute carrier family 35, member B4
SLC35B4
0.020
0.537
0.017
21.403
21.780
1.341
secretogranin III
SCG3
0.020
0.720
0.500
21.401
21.255
1.125
Proprotein convertase subtilisin/kexin type 2
PCSK2
0.020
0.232
0.146
21.399
21.280
1.243
Programmed cell death 8 (apoptosis-inducing factor)
PDCD8
0.020
0.856
0.017
21.397
21.507
1.265
tripartite motif-containing 44
TRIM44
0.020
0.943
0.017
21.387
22.430
1.201
v-akt murine thymoma viral oncogene homolog 3 (protein kinase B, gamma)
AKT3
0.020
0.880
0.017
21.385
21.155
1.475
reticulon 4 receptor-like 1
RTN4RL1
0.020
0.959
0.288
21.378
21.369
1.187
WD repeat domain 32
WDR32
0.140
0.959
0.057
21.378
21.364
1.324
zinc finger, DHHC-type containing 4
ZDHHC4
0.020
0.639
0.146
21.370
21.995
1.181
karyopherin alpha 6 (importin alpha 7)
KPNA6
0.090
0.959
0.017
21.362
21.452
1.370
tribbles homolog 1 (Drosophila)
TRIB1
0.279
0.534
0.017
21.359
21.758
1.519
calmodulin regulated spectrin-associated protein 1
CAMSAP1
0.020
0.534
0.017
21.351
21.267
1.453
member RAS oncogene family
RAB22A
0.020
0.524
0.057
21.345
21.766
1.303
Calumenin
CALU
0.035
0.856
0.039
21.344
21.923
1.292
PLoS ONE | www.plosone.org
5
October 2008 | Volume 3 | Issue 10 | e3329
Evolution of the Aging Brain
Table 1. cont.
Gene Description
Gene Symbol
Q-Value (%) Human
Fold Change
Rhesus
Mouse
Human
Rhesus
Mouse
HEPIS
LOC119710
0.020
0.775
0.146
21.342
21.443
1.152
Ankyrin repeat domain 6
ANKRD6
0.140
0.943
0.098
21.341
21.361
1.220
kelch repeat and BTB (POZ) domain containing 7
KBTBD7
0.020
0.537
0.017
21.327
21.548
1.226
Rho-associated, coiled-coil containing protein kinase 2
ROCK2
0.020
0.232
0.120
21.323
21.773
1.289
dynactin 4 (p62)
DCTN4
0.090
0.375
0.028
21.320
21.306
1.317
UDP-glucuronate decarboxylase 1
UXS1
0.279
0.232
0.017
21.315
21.943
1.558
chromosome 1 open reading frame 21
C1orf21
0.020
0.599
0.017
21.307
21.326
1.259
proliferation-associated 2G4, 38 kDa
PA2G4
0.090
0.775
0.028
21.303
21.761
1.186
isocitrate dehydrogenase 2 (NADP+), mitochondrial
IDH2
0.965
0.720
0.057
21.300
21.538
1.292
ring finger protein 41
RNF41
0.140
0.375
0.057
21.299
22.333
1.286
ATPase, aminophospholipid transporter-like, Class I, type 8A, member 2
ATP8A2
0.035
0.720
0.949
21.296
22.771
1.272
zinc finger protein 697
ZNF697
0.279
0.524
0.057
21.295
21.543
1.193
makorin, ring finger protein, 1
MKRN1
0.020
0.537
0.500
21.295
21.224
1.085
eukaryotic translation initiation factor 3, subunit 12
EIF3S12
0.020
0.501
0.120
21.294
22.174
1.187
transforming, acidic coiled-coil containing protein 1
TACC1
0.035
0.537
0.017
21.288
21.945
1.968
THUMP domain containing 3
THUMPD3
0.090
0.639
0.098
21.285
21.648
1.175
0.020
0.438
0.193
21.282
21.376
1.131
mediator of RNA polymerase II transcription, subunit 8 homolog (yeast) MED8 Casein kinase 2, alpha 1 polypeptide
CSNK2A1
0.020
0.959
0.098
21.279
21.367
1.572
metastasis associated 1 family, member 3
MTA3
0.390
0.959
0.017
21.276
21.299
1.268
DEAD (Asp-Glu-Ala-Asp) box polypeptide 54
DDX54
0.965
0.959
0.017
21.272
21.272
1.322
Ras-associated protein Rap1
RBJ
0.020
0.856
0.949
21.270
21.325
1.131
cleavage stimulation factor, 39 pre-RNA, subunit 3, 77 kDa
CSTF3
0.020
0.534
0.146
21.268
21.145
1.472
N-myristoyltransferase 1
NMT1
0.090
0.943
0.017
21.262
21.174
1.340
Component of oligomeric golgi complex 1
COG1
0.035
0.959
0.017
21.258
21.685
1.659
SERPINE1 mRNA binding protein 1
SERBP1
0.035
0.943
0.240
21.257
21.303
1.143
kelch domain containing 3
KLHDC3
0.140
0.720
0.193
21.252
21.255
1.194
zinc finger protein 436
ZNF436
0.195
0.232
0.193
21.249
21.379
1.122
KIAA1217
KIAA1217
0.965
0.639
0.240
21.247
21.953
1.328
sideroflexin 4
SFXN4
0.020
0.639
0.639
21.247
21.233
1.182
ankyrin repeat domain 28
ANKRD28
0.065
0.856
0.120
21.238
21.505
1.345
Phosphodiesterase 8B
PDE8B
0.140
0.856
0.017
21.236
21.964
1.329
casein kinase 2, alpha prime polypeptide
CSNK2A2
0.020
0.943
0.288
21.231
21.315
1.137
Ras association (RalGDS/AF-6) domain family 5
RASSF5
0.965
0.524
0.017
21.222
21.416
1.304
microfibrillar-associated protein 1
MFAP1
0.090
0.501
0.017
21.221
21.347
1.280
tRNA nucleotidyl transferase, CCA-adding, 1
TRNT1
0.065
0.537
0.288
21.219
21.673
1.137
golgi SNAP receptor complex member 2
GOSR2
0.390
0.959
0.639
21.216
21.404
1.545
v-ral simian leukemia viral oncogene homolog A (ras related)
RALA
0.965
0.232
0.017
21.207
21.690
1.240
hypothetical protein FLJ11305
RP11-98F14.6
0.965
0.943
0.348
21.205
21.411
1.312 1.458
Zinc finger protein 291
ZNF291
0.279
0.943
0.017
21.205
21.342
UDP-N-acetyl-alpha-D-galactosamine (GalNAc-T2)
GALNT2
0.390
0.537
0.017
21.202
21.155
1.388
Acyl-Coenzyme A dehydrogenase family, member 9
ACAD9
0.020
0.232
0.017
21.185
21.364
1.403
deltex 4 homolog (Drosophila)
DTX4
0.020
0.599
0.017
21.180
21.254
1.314
casein kinase 1, gamma 1
CSNK1G1
0.279
0.856
0.017
21.169
21.430
1.274
KIAA1698 protein
KIAA1698
0.279
0.534
0.017
21.157
21.405
1.380
Yip1 domain family, member 3
YIPF3
0.965
0.599
0.017
21.143
21.703
1.540
Adducin 3 (gamma)
ADD3
0.065
0.599
0.085
1.540
1.329
21.289
III.
Aging Genes that Diverged Between Rhesus Monkeys and Humans
cell division cycle 42 (GTP binding protein, 25 kDa)
CDC42
0.020
0.524
0.017
21.688
1.608
1.186
melanoma antigen family H, 1
MAGEH1
0.020
0.232
0.776
21.504
1.697
1.203
PLoS ONE | www.plosone.org
6
October 2008 | Volume 3 | Issue 10 | e3329
Evolution of the Aging Brain
Table 1. cont.
Gene Description
Gene Symbol
Q-Value (%) Human
Fold Change
Rhesus
Mouse
Human
Rhesus
Mouse
Seryl-tRNA synthetase
SARS
0.020
0.501
0.017
21.453
1.375
1.650
clathrin, heavy polypeptide (Hc)
CLTC
0.020
0.375
0.057
21.438
1.056
1.207
E-1 enzyme
MASA
0.020
0.524
0.949
21.323
1.618
1.158
F-box protein 28
FBXO28
0.020
0.232
0.146
21.301
1.701
1.155
abhydrolase domain containing 14A
ABHD14A
0.390
0.501
0.017
21.192
1.318
1.404
eukaryotic translation initiation factor 1A, X-linked
EIF1AX
0.740
0.232
0.146
21.175
2.762
1.278
hypothetical protein FLJ11155
FLJ11155
0.140
0.959
0.085
1.868
23.539
21.172
Shown are fold changes (aged to young intensity ratio; minus sign for age-downregulated, no sign for age-upregulated) and statistical q-values (%) derived by Significance Analysis of Microarrays (SAM) as described in Methods. Category I contains genes for which age-related expression changes are conserved, both in terms of significance and direction, across all three species. Category II contains genes in which the direction of the relationship with age changes from mouse to rhesus macaque. Category III contains genes in which the direction of the relationship with age changes between rhesus macaque and human. doi:10.1371/journal.pone.0003329.t001
limited number of age-related changes in the rhesus dataset prevented us from conducting a comprehensive cell type analysis in rhesus macaques. To determine whether there is a relationship between age-related expression changes and cell type localization, we determined the number of age-related gene expression changes that could be localized to each cell type using the Allen Brain Atlas. A relationship between age-related expression changes and cell type localization was analyzed statistically by determining if the number of age-regulated genes enriched in specific cell types deviated significantly from the number expected if these changes were
cells derived from primary human cortical cultures, as previously described [16]. For each set of genes enriched in a specific cell type in mice, we determined the median fold enrichment in each of the three human cell type arrays. Genes that were predicted to be enriched in astrocytes and neurons in the mouse brain by the Allen database were also enriched in the corresponding cell types derived from the human cortex (Fig. S1 and Table S7). The agreement between the human and mouse cell-type enrichment datasets enabled us to use the Allen Brain Atlas to localize age-related gene expression changes in both species. The
Figure 3. Cell type localization of gene expression in the aging cortex. Genes enriched in specific cortical cell types, based on the Allen Brain Atlas, were analyzed in the aging mouse and human gene expression profiles. The percentage of age-regulated genes enriched in each cell type is represented by the Y-axis was determined as described in Methods. The expected percentages are indicated by the dashed line. Statistically significant cell type enrichment was determined using a Chi-square test with a permutation-based p-value (1,000 replicates). Specific cell types that exhibit a statistically significant change in age-regulated genes are indicated by an asterisk. doi:10.1371/journal.pone.0003329.g003
PLoS ONE | www.plosone.org
7
October 2008 | Volume 3 | Issue 10 | e3329
Evolution of the Aging Brain
majority of genes in the human-enriched neuronal GO terms were downregulated with age. In contrast, the significant mouse neuronal GO terms were primarily enriched for age-upregulated genes (Fig. 4a). Thus, aging reduces the expression of genes with a variety of neuronal functions to a much greater extent in humans than mice.
independent of cell type localization. Both the human and mouse localization analysis showed significant deviation from values expected under the independence assumption (p-value,0.05). Statistical significance was assessed using a Chi-squared test in which the null distribution was estimated based on 1,000 replications (see Methods). The primary data and hypergeometric-based estimates are provided in Tables S8 and S9, respectively. Both humans and mice exhibit a larger fraction of age-upregulated astrocyte- and oligodendrocyte-enriched genes, and age-downregulated neuron-enriched genes, than would be expected by chance alone (Fig. 3). However, relative to mice, human aging is distinguished by a dramatic increase in the proportion of neuronenriched downregulated genes (Fig. 3). This was also observed when the data was stratified by gender (Text S2). Analysis of our data using a different cell type transcriptome database, derived by isolation of astrocytes, neurons and oligodendrocytes from transgenic mouse cortex [17], confirmed that downregulation of neuronal genes distinguishes aging humans from aging mice (data not shown). As an independent line of evidence for age-related downregulation of neuronal genes, we identified Gene Ontology (GO) groups that were significantly enriched for age-related expression changes (Table S10). In total, 24 neuronal GO groups were significantly enriched for age-related expression changes in humans (hypergeometric p-value,0.005) (Fig. 4a). In contrast, only 5 of these 24 neuronal GO terms were slightly enriched for genes significantly associated with age in mice (hypergeometric pvalue,0.05), despite similar or greater gene numbers for each GO term represented on mouse versus human microarrays (Fig. 4b). Further characterization of these GO terms revealed that the vast
Age-Related Repression of Genes Involved in Inhibitory Neurotransmission Aging is associated with characteristic neurophysiologic and cognitive changes attributable to specific neurotransmitter systems. An important question, therefore, is whether age-related repression of neuronal genes selectively affects specific neurotransmitter systems. We noted that the only significantly enriched GO groups relating to a specific neurotransmitter were ‘‘GABA and GABA-A receptor activity’’ (Fig. 4). To explore this finding further, we examined the age-regulated expression of genes related to each of the major cortical neurotransmitters, including glutamate, gamma-aminobutyric acid (GABA), dopamine, glycine, serotonin, and acetylcholine (Fig. 5a). The most robustly age-regulated group corresponded to genes involved in GABA-mediated inhibitory neurotransmission (Fig. 5a and Table S11). Multiple genes in this category were age-downregulated with large fold changes in humans, including GABA A receptor subunits alpha 1 (GABRA1), alpha 5 (GABRA5), beta 3 (GABRB3) and gamma 2 (GABRG2), the GABA vesicular transporter (SLC32A1), and the GABA biosynthetic enzymes glutamate decarboxylase 1 and 2 (GAD1 and GAD2) (Table S11). Moreover, genes for the neuropeptides calbindin 1 (CALB1), somatostatin (SST), vasoactive intestinal peptide (VIP), cholecystokinin (CCK), tachykinin (TAC1), and
Figure 4. Neuronal gene ontology groups distinguish the expression profiles of the aging human and mouse cortex. a. Neuronal gene ontology (GO) groups that are significantly enriched (p-value#0.005; binomial approximated p-value for a hypergeometric distribution) for agerelated expression changes (SAM comparison, FDR#0.01) were identified. The X-axis represents the percentage of genes in a GO group with agerelated up- or down-regulation. Multiple neuronal GO groups are enriched in the human aging profile; while only a few neuronal GO terms appear at less significant thresholds in the mouse aging profile. Age-upregulated and age-downregulated genes are shown separately. b. Number of genes in each GO group that are represented on the mouse and human microarray platforms. doi:10.1371/journal.pone.0003329.g004
PLoS ONE | www.plosone.org
8
October 2008 | Volume 3 | Issue 10 | e3329
Evolution of the Aging Brain
Figure 5. Global repression of genes associated with GABA-mediated inhibitory neurotransmission. Shown are age-related changes in the expression of genes that mediate major neurotransmitter systems in the cortex of humans, rhesus monkeys, and mice. a. Genes involved in specific neurotransmitters were identified based on membership in the corresponding GO groups. Age-related fold changes in genes with orthologs in all three species and represented on all three microarray platforms are shown for humans, rhesus monkeys, and mice. Gene identities are provided in Table S11. *q-value#0.01. b. Age-related fold changes for markers of inhibitory neuronal subpopulations. Statistical significance in a specific species (q-value#0.01) is denoted with an asterisk. doi:10.1371/journal.pone.0003329.g005
nociceptin (PNOC), which are markers of inhibitory neuronal subpopulations in prefrontal cortex, were significantly agedownregulated (Fig. 5b). These genes were not significantly agedownregulated in mice, although some inhibitory markers, such as calbindin 1 and GABA A receptor subunit alpha 1, were significantly age-downregulated in rhesus macaques (Fig. 5). Downregulation of several glutamate-related genes, such as the glutamate receptor subunits AMPA 1 (GRIA1) and kainate 1 (GRIK1), was also observed, but the number and magnitude of these expression changes were less than that observed for GABArelated genes (Fig. 5a and Table S11). A subset of these age-related changes, notably calbindin 1, GABA A receptor subunit b3 and AMPA 1, have been confirmed by quantitative real time RT-PCR [6]. Thus, genes associated with inhibitory neurotransmission are repressed in the aging human cortex.
sensitivity of the antibody used for Western blotting of VIP, or post-translational regulation of VIP levels. In contrast to aging human cortex, the aging mouse cortex did not exhibit altered levels of calbindin or somatostatin, which is also in agreement with the microarray data (Fig. 6b and Fig. S2b). Stereological cell counting studies suggest that neuronal loss is not significant in the aging human prefrontal cortex. To confirm this finding, we performed quantitative Western blotting for two established neuron-specific markers, b-tubulin III and neurofilament L chain [17]. The levels of both proteins did not change significantly in the aging human prefrontal cortex (Fig. 6a and Fig. S2a). We also examined the presynaptic marker synaptophysin, which did not show a significant age-related change in this cortical region (Fig. 6a and Fig. S2a). These results suggest that downregulation of neuronal genes in the aging human cortex cannot be attributed to overall loss of neurons or synapses.
Age-Related Reduction of Neuronal Proteins Is Not Associated with Overall Neuronal or Synaptic Loss
Discussion
To determine whether reduced mRNA levels are associated with reduced protein levels in the aging brain, a subset of gene products expressed in GABAergic neurons was examined by quantitative Western blotting in cortical samples from young adult and aged humans and mice. The protein level of the major GABA biosynthetic enzyme in the brain, GAD1, was significantly reduced in the aging human cortex, as well as the levels of calbindin 1 and somatostatin, in agreement with the microarray data (Fig. 6a and Fig. S2a). The neuropeptide VIP did not show a significant agerelated change at the protein level, in contrast to the age-related reduction in VIP mRNA. This difference may reflect limited
We have compared the protein-coding transcriptome of the aging cerebral cortex in mice, rhesus monkeys, and humans by utilizing species-specific genome-scale microarrays. As such, this study is not confounded by cross-species hybridization of RNA to microarrays, and provides a broad view of the evolution of the mammalian aging brain. Our results suggest that a relatively small subset of age-regulated gene expression changes are conserved from mouse to man. The most robustly age-upregulated of these conserved genes is apolipoprotein D, which has been shown to protect against oxidative stress and extend lifespan in Drosophila
PLoS ONE | www.plosone.org
9
October 2008 | Volume 3 | Issue 10 | e3329
Evolution of the Aging Brain
dendritic spine structure as reported in aging rhesus monkeys [24]. Finally, we showed previously that age-related gene downregulation did not correlate with postmortem interval in the range used in our study [6], consistent with the lack of an effect of postmortem interval on RNA integrity in another study [25]. In addition, we monitored brain tissue pH to exclude human cases with prolonged terminal hypoxia [26]. Taken together, these findings are consistent with a primary age-related change in the regulation of neuronal gene expression. In a previous study, we found that downregulated neuronal genes were associated with DNA damage in the aging human cortex, and that DNA damage can repress the transcription of these genes in primary neuronal cultures [6]. Another study suggested that some genes undergo age-dependent DNA methylation [27]. Thus, transcriptional repression in neurons may be a primary feature of human brain aging that has evolved in long-lived primates. A systematic investigation of genes involved in the major cortical neurotransmitter systems suggests that the GABA system, which mediates inhibitory neurotransmission, may be particularly affected in the aging human prefrontal cortex. This is underscored by the 50–60% reduction in mRNA and protein levels of GAD1, the primary GABA biosynthetic enzyme in the brain. In addition, the marked downregulation of calbindin 1 and somatostatin suggests that specific inhibitory neuronal subpopulations may be unusually vulnerable. Reduced calbindin 1 immunocytochemical staining has also been demonstrated during normal brain aging in rhesus monkeys and humans, and becomes more pronounced in Alzheimer’s disease [28]. Thus, aging of the brain may be associated with reduced inhibitory neurotransmission. The central role of GABA in cognition and affective state raises the possibility that age-dependent downregulation of this system might contribute to neurophysiological and psychological changes in the aging population [29]. Reduced inhibitory circuit activity might increase cortical activation during the performance of routine cognitive tasks, a phenomenon that has been demonstrated in the aging human prefrontal cortex by functional imaging studies [30,31]. This pattern of increased cortical activation may initially be compensatory, enabling aged individuals to function at a higher level [31]. However, increased excitation could predispose to excitotoxicity, a mechanism of neuronal cell death associated with a variety of age-related neurological disorders, including Alzheimer’s disease [32]. Functional imaging studies have implicated cortical overactivation due to impaired inhibitory function in patients with Alzheimer’s disease [33]. The relevance of overexcitation to disease pathogenesis is suggested by the clinical efficacy of the NMDA receptor antagonist memantine, currently the only treatment that delays progression of moderate to late stage Alzheimer’s disease [34]. Interestingly, significant downregulation of GABA-related genes is not detected in the aging mouse cortex, which may increase resistance to excitotoxicity relative to aging humans. This may, in turn, contribute to the paucity of neuronal cell death in mouse models of neurodegenerative diseases compared with the human pathology [2]. Hence, a greater understanding of normal brain aging and its evolution may provide new insights into pathogenic mechanisms involved in age-related neurodegeneration.
Figure 6. Reduced protein markers of inhibitory neurons in the aged human cortex. a. GAD1, calbindin-1, and somatostatin protein levels are significantly lower in the aged (71–91 yr; white) human cortex than in the young adult (24–35 yr; black) cortex, in agreement with microarray results. VIP expression is age-stable at the protein level. The neuronal markers b-tubulin-III and neurofilament-L are age-stable at the protein level, as is the synaptic protein synaptophysin. n = 15. The primary Western blot data are shown in Figure S2a. b. Calbindin-1, somatostatin, and VIP protein levels are age-stable in the mouse cortex, in agreement with the microarray results. Likewise, b-tubulin-III and synaptophysin do not change significantly with age. Attempts to probe for mouse GAD1 and neurofilament-L were not successful. n = 6. The primary Western blot data are shown in Figure S2b. In both a and b, the level of each protein was normalized to the level of actin. Values represent the mean6S.E.M. expressed as percent of the mean young value for each protein. * P,0.05 by Student’s two-tailed t-test. doi:10.1371/journal.pone.0003329.g006
[18,19]. Moreover, apolipoprotein D is upregulated at the protein level in the aging human brain and to a greater extent in a variety of neurological diseases, including Alzheimer’s disease [20,21]. The most robustly age-downregulated gene conserved in all three species is CAMK4, a key component of the cAMP signaling cascade that links synaptic activity to CREB-dependent transcription and modulates synaptic plasticity [14,22]. Another key cAMP signaling gene, adenylate cyclase 2, is age-downregulated in humans and rhesus macaques. Thus, increased expression of neuroprotective genes and reduced expression of genes involved in synaptic function are conserved features of mammalian aging. Localization of gene expression by in situ hybridization and analysis of gene ontology groups indicates that 3 cell types – astrocytes, oligodendrocytes, and neurons – exhibit significant agedependent changes in gene expression in mice and humans. However, age-related downregulation of neuronal genes has increased dramatically from mouse to man, and is a major distinguishing feature. Several lines of evidence suggest that this is unlikely to be secondary to neuronal cell death. First, stereological analysis of neuronal cell number did not detect neuronal loss in the region of the aging human prefrontal cortex used in this study [2,23]. Second, we have shown that expression of a number of neuron-specific genes is unaltered in the aging human prefrontal cortex at both the mRNA and protein levels. Moreover, the absence of a significant age-related change in synaptophysin levels suggests that overall synapse numbers may also be preserved. However, this does not rule out more subtle changes in synaptic or PLoS ONE | www.plosone.org
Materials and Methods Samples and Microarray Platforms All aspects of animal housing and experimental procedures were approved by the Institutional Animal Care and Use Committees of Children’s Hospital Boston and the Beth Israel-Deaconess Hospital (for rhesus macaques) and by the William S. Middleton V.A. Medical Center and the University of Wisconsin-Madison 10
October 2008 | Volume 3 | Issue 10 | e3329
Evolution of the Aging Brain
Medical School (for mice). Postmortem human tissue was procured in accordance with institutional guidelines. Detailed description of the human, rhesus macaque and murine samples and extraction protocols are supplied in Text S1 and Table S1. Postmortem human cortical samples were derived from subjects that did not carry a diagnosis of Alzheimer’s disease or another neurodegenerative disease, and showed neuropathological findings within the normal range for age. In addition, human brain tissue samples with a pH.6.5 were used to exclude prolonged terminal hypoxia [26]. We generated genome-wide expression profiles of young and aged cortical samples in humans, rhesus monkeys and C57BL/6J mice using Affymetrix Human Genome U133plus 2.0 arrays, Rhesus Macaque Genome arrays and Mouse Genome 430 2.0 arrays, respectively. Affymetrix Human Genome U133plus 2.0 arrays were also used for expression profiling of neurons, microglia and astrocytes isolated from primary fetal human cortical cultures. Samples with acceptable parameters of RNA quality (Text S1) were hybridized to the corresponding Affymetrix oligonucleotide arrays, which were then scanned and expression data extracted using the standard Affymetrix Microarray Suite Software.
enriched genes in the Allen Brain Atlas (Table S8). For the analysis in humans, we required that the mouse ortholog to the human gene be present in the list. For each species, the number of significant age up- and down-regulated genes, as well as the number of non-significant genes, was determined for each of the five cell types indicated in the Allen Brain Atlas resulting in a 3-by5 table (Table S9). Assuming independence between cell types and age-related expression changes, the expected count within each cell of the table was estimated using the row and column totals. As a result of the low count in some cells, a Monte Carlo p-value, based on 1000 replications was calculated for each species to test whether the observed count significantly deviated from what was expected by chance. 4. Gene Ontology analysis was performed independently for humans and mice using dChip software (Table S10). A Gene Ontology group is considered to be enriched in the aging database if it contains a greater number of significantly age-related genes than expected by chance. The statistical significance of GO group enrichment is determined using a binomial approximation to the hypergeometric distribution with a p-value cut-off of 0.005, as described in detail elsewhere (www.dchip.org) [36].
Gene Mapping
Analysis of Cultured Human Cortical Cell Types
Predicted rhesus macaque proteins, based on the Jan. 2006 version of the rhesus genome (Baylor College of Medicine HGSC v1.0), were aligned to human Refseq protein sequences mapped to NCBI Build 36 of the human genome. The mapping was conducted using the BLAST program [35] by first creating a BLAST protein database from the predicted rhesus proteins. Using protein-BLAST, individual human Refseq proteins were then compared to the rhesus protein database. A BLAST score greater than 200, and at least 80% of the human protein aligning to the predicted rhesus protein, was required to declare an orthologous pair between the two species. A complete list of orthologous human-rhesus gene pairs is provided in Table S2.
Neurons, astrocytes and microglia were isolated from primary fetal human cortical cultures as described previously [16]. Expression profiling of the isolated cortical cell types was performed using Affymetrix U133 plus 2.0 arrays. To assess the concordance of gene expression profiles of corresponding human and mouse cortical cell types, we analyzed the probe sets on the human U133plus 2.0 arrays that corresponded to the Allen Brain Atlas list of mouse cell typeenriched genes (Table S7). Fold enrichment of a particular gene in a specific human cell type was calculated as follows: the intensity of the gene in one cell type was divided by the maximum of the intensities in the two remaining cell types. The median fold enrichment of a particular human cell type was then calculated over all of the genes that were called enriched in a specific mouse cell type (Allen Brain Atlas). The result was a human cell type enrichment score for every human-mouse cell type combination (Fig. S1). Median fold values greater than 1.0 indicated enrichment.
Expression Profiling and Analytical Approaches To compare expression across species, genes were required to have orthologs in the human, rhesus macaque and mouse genome databases, and to have probesets in the microarray platforms for each species. We also required that probes be called present using dChip software in at least 20% of the arrays for each species. Four approaches were used to analyze the genes meeting these criteria. 1. Significance Analysis of Microarrays (SAM) software was used to compare young and aged groups within each species with the following criteria for identifying age-related expression changes: 1000 permutations and median false discovery rate (FDR) #0.01. Significant age-related gene expression changes are listed for humans, rhesus macaques and mice in Tables S3, S4, and S5, respectively. The subset of genes that are age-regulated in all three species is provided in Table S6. These common age-related genes were also resolved by hierarchical clustering using dChip software (build date: April 11, 2007) [36]. The display range used in the hierarchical clustering was 2.0 (a value greater than 2.0 standard deviations above the mean is pure red, below is pure blue, and equal to the mean is white). 2. Correlation coefficients between samples were calculated and visualized using dChip software across the 154 genes that are significantly associated with aging in all three species. The range of observed correlation coefficients was (20.78, 0.82), excluding a sample’s correlation with itself. The display range used was 0.7 (correlation above 0.7 is pure red, below is pure blue, and 0 is white). 3. The cell type enrichment analysis of age-regulated genes was performed independently for mice and humans, and included all genes that met the above microarray criteria and were also present in the list of cell typePLoS ONE | www.plosone.org
Western Blot Analysis Human Brain. Postmortem human cortical tissue (Brodmann area 9/10) was flash frozen and stored at 2150u until use. Tissue was homogenized in RIPA-DOC buffer containing protease inhibitors (Complete, Roche) with microcystin (1 mm) and Na3Vo4 (1 mM). Tissue was homogenized, sonicated, and centrifuged at 10,000 rpm at 4uC and the protein concentration in the resulting supernatant was assayed (BioRad protein assay). Samples were boiled in 16SDS sample buffer containing DTT and resolved by 7% SDS-PAGE using the Criterion System (BioRad) and electrotranferred to PVDF membranes (Immobilon, Millipore). The primary antibodies and dilutions used to probe the PVDF membranes are described in Table S12. Secondary antibodies (Jackson ImmunoResearch) were used at 1:2000 diluted in 5% nonfat milk. Blots were developed on film or with a gel documentation system (Syngene) and quantified with GeneTools software (Syngene). Mouse Brain. Three young B6C3F1 mice (5 months) and three aged B6C3F1 mice (30 months) were sacrificed and the cortex was isolated and homogenized in 20 mM HEPES, 125 mM NaCl, 0.1% NP40, 0.1% Triton X-100, 1 mM EDTA, 10 mM nicotinamide, 1 mM trichostatin A, protease inhibitors (Complete, Roche), and phosphatase inhibitors (PhosSTOP, Roche). Samples were boiled in SDS sample buffer containing DTT, resolved by SDS-PAGE on 10% or 12.5% Tris-glycine gels and electrotransferred to PVDF membranes. 11
October 2008 | Volume 3 | Issue 10 | e3329
Evolution of the Aging Brain
Supporting Information
Table S7 Concordant Expression Patterns in Cultured Human
Text S1 The MIAME Checklist
Cortical Cell Types and the Allen Brain Atlas Found at: doi:10.1371/journal.pone.0003329.s011 (0.07 MB XLS)
Found at: doi:10.1371/journal.pone.0003329.s001 (0.07 MB DOC)
Table S8 Age-Related Expression Changes of Genes Enriched
Text S2 Analysis of the Effects of Gender
in Specific Cortical Cell Types In Vivo Found at: doi:10.1371/journal.pone.0003329.s012 (0.12 MB XLS)
Found at: doi:10.1371/journal.pone.0003329.s002 (0.03 MB DOC)
Table S9 Calculations for Determining Significant Cell-Type Enrichment of Age-Regulated Genes Found at: doi:10.1371/journal.pone.0003329.s013 (0.03 MB XLS)
Figure S1 Concordance of Gene Expression in Human and Murine Neural Cell Types Found at: doi:10.1371/journal.pone.0003329.s003 (0.63 MB TIF)
Table S10 Gene Ontology Enrichment Analysis of Human and Mouse Expression Data Found at: doi:10.1371/journal.pone.0003329.s014 (0.05 MB XLS)
Western Blot Analysis of Age-Downregulated and Age-Stable Proteins in Human and Mouse Cortex. Found at: doi:10.1371/journal.pone.0003329.s004 (8.39 MB TIF)
Figure S2
Table S1 Sample information Found at: doi:10.1371/journal.pone.0003329.s005 (0.03 MB XLS)
Table S11 Age-Related Gene Expression Changes Classified by Neurotransmitter Type Found at: doi:10.1371/journal.pone.0003329.s015 (0.05 MB XLS)
Table S2 Mapping of predicted rhesus macaque and human genes Found at: doi:10.1371/journal.pone.0003329.s006 (6.28 MB XLS)
Table S12 Antibodies employed in the analysis of cortical protein levels Found at: doi:10.1371/journal.pone.0003329.s016 (0.02 MB XLS)
Table S3 Age-Related Expresssion Changes in Humans Found at: doi:10.1371/journal.pone.0003329.s007 (1.16 MB XLS)
Acknowledgments
Table S4 Age-Related Expression Changes in Rhesus Macaques Found at: doi:10.1371/journal.pone.0003329.s008 (0.42 MB XLS)
We thank Ruth Capella for her excellent assistance in the preparation of the manuscript.
Table S5 Age-Related Expresssion Changes in Mice Found at: doi:10.1371/journal.pone.0003329.s009 (1.78 MB XLS)
Author Contributions Conceived and designed the experiments: TL BAY. Performed the experiments: TL KAD JMV AMI YP. Analyzed the data: PML TL CL BAY. Contributed reagents/materials/analysis tools: JMV AMI CG JW DG TAP. Wrote the paper: PML BAY.
Genes with Significant Age-Related Expression Changes in Humans, Rhesus Macaques, and Mice Found at: doi:10.1371/journal.pone.0003329.s010 (0.08 MB XLS)
Table S6
References 17. Cahoy JD, Emery B, Kaushal A, Foo LC, Zamanian JL, et al. (2008) A transcriptome database for astrocytes, neurons, and oligodendrocytes: a new resource for understanding brain development and function. Journal of Neuroscience 28: 264–278. 18. Walker DW, Muffat J, Rundel C, Benzer S (2006) Overexpression of a Drosophila homolog of apolipoprotein D leads to increased stress resistance and extended lifespan. Curr Biol 16: 674–679. 19. Sanchez D, Lopez-Arias B, Torroja L, Canal I, Wang X, et al. (2006) Loss of glial lazarillo, a homolog of apolipoprotein D, reduces lifespan and stress resistance in Drosophila. Curr Biol 16: 680–686. 20. Kalman J, McConathy W, Araoz C, Kasa P, Lacko AG (2000) Apolipoprotein D in the aging brain and in Alzheimer’s dementia. Neurol Res 22: 330–336. 21. Belloir B, Kovari E, Surini-Demiri M, Savioz A (2001) Altered apolipoprotein D expression in the brain of patients with Alzheimer disease. J Neurosci Res 64: 61–69. 22. Ho N, Liauw JA, Blaeser F, Wei F, Hanissian S, et al. (2000) Impaired synaptic plasticity and cAMP response element-binding protein activation in Ca2+/ calmodulin-dependent protein kinase type IV/Gr-deficient mice. J Neurosci 20: 6459–6472. 23. Bussiere T, Gold G, Kovari E, Giannakopoulos P, Bouras C, et al. (2003) Stereologic analysis of neurofibrillary tangle formation in prefrontal cortex area 9 in aging and Alzheimer’s disease. Neuroscience 117: 577–592. 24. Peters A, Sethares C, Moss MB (1998) The effects of aging on layer 1 in area 46 of prefrontal cortex in the rhesus monkey. Cereb Cortex 8: 671–684. 25. Ervin JF, Heinzen EL, Cronin KD, Goldstein D, Szymanski MH, et al. (2007) Postmortem delay has minimal effect on brain RNA integrity. J Neuropathol Exp Neurol 66: 1093–1099. 26. Kingsbury AE, Foster OJ, Nisbet AP, Cairns N, Bray L, et al. (1995) Tissue pH as an indicator of mRNA preservation in human post-mortem brain. Brain Res Mol Brain Res 28: 311–318. 27. Siegmund KD, Connor CM, Campan M, Long TI, Weisenberger DJ, et al. (2007) DNA methylation in the human cerebral cortex is dynamically regulated throughout the life span and involves differentiated neurons. PLoS ONE 2: e895. 28. Geula C, Bu J, Nagykery N, Scinto LF, Chan J, et al. (2003) Loss of calbindinD28k from aging human cholinergic basal forebrain: relation to neuronal loss. J Comp Neurol 455: 249–259. 29. Mohler H (2007) Molecular regulation of cognitive functions and developmental plasticity: impact of GABAA receptors. J Neurochem 102: 1–12.
1. Martin GM (2005) Genetic modulation of senescent phenotypes in Homo sapiens. Cell 120: 523–532. 2. Yankner BA, Lu T, Loerch P (2007) The Aging Brain. Annu Rev Pathol 3: 41–66. 3. Fischer A, Sananbenesi F, Wang X, Dobbin M, Tsai LH (2007) Recovery of learning and memory is associated with chromatin remodelling. Nature 447: 178–182. 4. Lee CK, Weindruch R, Prolla TA (2000) Gene-expression profile of the ageing brain in mice. Nat Genet 25: 294–297. 5. Jiang CH, Tsien JZ, Schultz PG, Hu Y (2001) The effects of aging on gene expression in the hypothalamus and cortex of mice. Proc Natl Acad Sci U S A 98: 1930–1934. 6. Lu T, Pan Y, Kao SY, Li C, Kohane I, et al. (2004) Gene regulation and DNA damage in the ageing human brain. Nature 429: 883–891. 7. Fraser HB, Khaitovich P, Plotkin JB, Paabo S, Eisen MB (2005) Aging and gene expression in the primate brain. PLoS Biol 3: e274. 8. Zahn JM, Poosala S, Owen AB, Ingram DK, Lustig A, et al. (2007) AGEMAP: a gene expression database for aging in mice. PLoS Genet 3: e201. 9. Gibbs RA, Rogers J, Katze MG, Bumgarner R, Weinstock GM, et al. (2007) Evolutionary and biomedical insights from the rhesus macaque genome. Science 316: 222–234. 10. Waterston RH, Lindblad-Toh K, Birney E, Rogers J, Abril JF, et al. (2002) Initial sequencing and comparative analysis of the mouse genome. Nature 420: 520–562. 11. Lander ES, Linton LM, Birren B, Nusbaum C, Zody MC, et al. (2001) Initial sequencing and analysis of the human genome. Nature 409: 860–921. 12. Venter JC, Adams MD, Myers EW, Li PW, Mural RJ, et al. (2001) The sequence of the human genome. Science 291: 1304–1351. 13. Tigges J, Gordon TP, McClure HM, Hall EC, Peters A (1988) Survival rate and life span of rhesus monkeys at the Yerkes regional primate research center. Am J Primatol 15: 263–273. 14. Greengard P (2001) The neurobiology of slow synaptic transmission. Science 294: 1024–1030. 15. Lein ES, Hawrylycz MJ, Ao N, Ayres M, Bensinger A, et al. (2007) Genomewide atlas of gene expression in the adult mouse brain. Nature 445: 168–176. 16. Wang J, Gabuzda D (2006) Reconstitution of human immunodeficiency virusinduced neurodegeneration using isolated populations of human neurons, astrocytes, and microglia and neuroprotection mediated by insulin-like growth factors. J Neurovirol 12: 472–491.
PLoS ONE | www.plosone.org
12
October 2008 | Volume 3 | Issue 10 | e3329
Evolution of the Aging Brain
30. Ba¨ckman L, Almkvist O, Andersson J, Nordberg A, Windblad B, et al. (1997) Brain activation in young and older adults during implicit and explicit retrieval. J Cogn Neurosci 9: 378–391. 31. Cabeza R, Anderson ND, Locantore JK, McIntosh AR (2002) Aging gracefully: compensatory brain activity in high-performing older adults. Neuroimage 17: 1394–1402. 32. Waxman EA, Lynch DR (2005) N-methyl-D-aspartate receptor subtypes: multiple roles in excitotoxicity and neurological disease. Neuroscientist 11: 37–49. 33. Petrella JR, Wang L, Krishnan S, Slavin MJ, Prince SE, et al. (2007) Cortical deactivation in mild cognitive impairment: high-field-strength functional MR imaging. Radiology 245: 224–235.
PLoS ONE | www.plosone.org
34. Cummings JL (2004) Alzheimer’s disease. N Engl J Med 351: 56–67. 35. Altschul SF, Gish W, Miller W, Myers EW, Lipman DJ (1990) Basic local alignment search tool. J Mol Biol 215: 403–410. 36. Li C, Wong WH (2001) Model-based analysis of oligonucleotide arrays: expression index computation and outlier detection. Proc Natl Acad Sci U S A 98: 31–36. 37. Hedges SB (2002) The origin and evolution of model organisms. Nat Rev Genet 3: 838–849.
13
October 2008 | Volume 3 | Issue 10 | e3329