ping of spirals by a hot intracluster medium (Gunn & Gott. 1972), to ...... Richard Bower for his detailed comments on an earlier ver- sion of this ... J. Suppl., 78, 1.
Mon. Not. R. Astron. Soc. 000, 000–000 (0000)
Printed 1 February 2008
(MN LATEX style file v1.3)
Evolution of the Hubble Sequence in Hierarchical Models for Galaxy Formation
arXiv:astro-ph/9602085v1 17 Feb 1996
C.M. Baugh, S. Cole, C.S. Frenk. Department of Physics, Science Laboratories, South Road, Durham DH1 3LE
1 February 2008
ABSTRACT
We present a model for the broad morphological distinction between the disk and spheroidal components of galaxies. Elaborating on the hierarchical clustering scheme of galaxy formation proposed by Cole et al, we assume that galaxies form stars quiescently in a disk until they are disrupted into a spheroidal configuration by mergers. Bulges and spheroids may continue to accrete gas from their hot coronae, and so they may grow disks again. Thus, an individual galaxy may pass through various phases of disk or spheroid dominance during its lifetime. To distinguish between disks and spheroids we add one additional free parameter to the semianalytic model of Cole et al. which we fix by requiring that the predicted morphological mix should match that observed locally. Assuming an Ω = 1, standard cold dark matter cosmology, we calculate formation and merging histories, and the evolution in colour, luminosity and morphology of the galaxy populations in different environments. Our model predicts that the bulges of spirals were assembled before the spheroids of ellipticals and the spheroids of cluster ellipticals were assembled before those of field ellipticals. About 50% of ellipticals, but only about 15% of spirals, have undergone a major merger during the redshift interval 0.0 ≤ z ≤ 0.5. In spite of their violent formation history, elliptical galaxies turn out to have colourmagnitude diagrams with remarkably small scatter. Apart from a general blueing of the galaxy population with redshift, the colour-magnitude diagrams are remarkably similar at redshift z = 0.5 and at the present day. The morphological mix of galaxies that become rich cluster members at high redshift is dominated by spiral galaxies, due to the long timescale for galaxy mergers compared with the timescale for cluster assembly at high redshift. The assembly of low redshift clusters is slower, allowing more galaxy mergers to occur in the progenitor halos. As a result z = 0 rich clusters become E/S0 dominated and we find a “Butcher-Oemler” effect that becomes weaker for poorer groups at high redshift. The field luminosity function of red galaxies shows little evolution out to z ≃ 1 and the reddest galaxies at these redshifts are as bright as their local counterparts. The blue luminosity function, on the other hand, evolves rapidly with redshift, increasing its characteristic luminosity and becoming steeper at the faint end. These trends are similar to those recently observed in the Canada-France Redshift Survey. Our calculations serve to demonstrate that a simple prescription for the distinction between disks and spheroids that is compatible with hierarchical clustering goes a long way towards explaining many of the systematic trends observed in the galaxy population. Key words: Galaxies:evolution-galaxies: formation-galaxies.
1
INTRODUCTION
The fundamental question of why some galaxies appear flattened like disks while others are spheroidal remains a major unsolved problem in galaxy formation. Attempts have
been made in the past to present this problem as a ‘nature’ versus ‘nurture’ dichotomy: is the morphology of a galaxy imprinted in the initial conditions or does it result from environmental processes such as mergers and tidal interactions? Sandage et al. (1970) postulated that the de-
2
C.M. Baugh, S. Cole, C.S. Frenk
termining factor is the protogalactic angular momentum: a disk or a spheroidal configuration would result, respectively, from the collapse of a rapidly rotating or of a slowly rotating gas cloud. Building upon the classic study of the kinematics of stars in our galaxy by Eggen, Lynden-Bell and Sandage (1962), Larson (1975) and Gott & Thaun (1976) proposed that the significant parameter is the ratio of the star formation timescale to the free-fall timescale. If the former is shorter, dissipationless collapse would lead to a spheroidal system, while disks would form from the dissipational settling of a rotating gas cloud. The ‘nurture’ hypothesis was first strongly advocated by Toomre (1977) who argued that galaxies form initially as disks and ellipticals form subsequently through violent mergers of disks. A simple distinction between ‘nature’ and ‘nurture’ is not easy to accommodate within modern cosmological theory. In hierarchical clustering models, initial conditions and environmental effects are closely linked together. Protogalactic objects are ‘born’ with a range of angular momenta and characteristic timescales and these as well as their environment and merger rates depend on the initial conditions. From an observational point of view, it is also clear that galaxy morphology reflects the interplay of various phenomena. Dressler’s (1980) morphology-density relation indicates that dynamical processes that depend on environment are a major influence on the final configuration of a stellar system. The well known excess of blue galaxies in clusters at high redshift – the Butcher-Oemler effect (Butcher & Oemler 1978, 1984; Allington-Smith et al. 1993) – suggests that the predominance of certain morphological types depends also on cosmic time. This impression seems to be supported by the recent HST images of clusters at redshifts z ∼ 0.5, which display an abnormally high proportion of late spiral and irregular types (Dressler et al. 1994, Couch et al. 1994, Moore et al. 1995). Mechanisms that may transform one morphological type into another have been proposed and investigated in the past two decades. These range from ram pressure stripping of spirals by a hot intracluster medium (Gunn & Gott 1972), to galaxy ‘harassment’ by impulsive encounters in clusters (Moore et al. 1995). Galaxy mergers continue to be a favourite explanation for the origin of at least some bright ellipticals (Schweizer & Seitzer 1992) and for the predominance of ellipticals and S0’s in rich clusters. N-body simulations of merging disk galaxies do indeed produce merger remnants with density profiles resembling those of ellipticals (eg Negroponte & White 1983). Nevertheless, objections have been raised against the view that the majority of ellipticals result from the merger of two or more stellar fragments. Perhaps the most powerful of these is the very small scatter measured in the colour-magnitude diagram of rich cluster ellipticals and S0’s. For example, Bower et al. (1992) find that the rms scatter in the colour of elliptical galaxies in the Coma cluster is only δ(U − V ) < 0m .04. On this basis they argue that the bulk of the stars in these galaxies are between 8 and 12 Gyr old and that the galaxies themselves must have been assembled at that time. The origin of galaxy morphology is now beginning to be addressed with numerical simulations that model both gravitational dynamics and gas physics. Some studies have
concentrated on achieving a detailed understanding of mergers and interactions (For a review see Barnes & Hernquist 1992; some of the results of numerical simulations that are relevant to this paper are discussed in Section 2.2) while others attempt to follow the formation of galaxies in their proper cosmological context (eg. Katz, Hernquist & Weinberg 1992, Evrard, Summers & Davis 199?, Navarro, Frenk & White 1995 and references therein.) Although interesting results have emerged from these studies, these are still early days in this area and a number of difficulties, particularly regarding the behaviour of cooling gas and its transformation into stars, require further study. In addition, these simulations are expensive in computer time and so only a limited range of parameter space has been explored to date. An alternative approach to studying galaxy formation is seminanalytic modelling. This has already proved to be a powerful technique (White & Frenk 1991, Cole 1991, Kauffmann et al. 1993, Lacey et al. 1993, Cole et al. 1994). This approach is based upon an extension of the Press-Schechter formalism (Press & Schechter 1974; Bond et al. 1991, Bower 1991) whereby a Monte-Carlo realisation of the hierarchical clustering process is used to follow the collapse and merger history of dark matter halos. The current level of understanding of the dynamics of cooling gas, star formation, feedback of energy into prestellar gas and galaxy mergers is encoded into a few simple rules that allow the process of galaxy formation within dark matter halos to be calculated. A wide range of parameters and cosmologies are accessible within such models (eg Cole et al. 1994, Heyl et al. 1995). The semianalytic models have enjoyed a number of significant successes, providing explanations for the general features of the galaxy luminosity function, the slope and scatter of Tully-Fisher relation, the faint galaxy number counts, their redshift and colour distributions, etc. However, a number of details remain unresolved. For example, in the original Cole et al. (1994) model, galaxies as red as many observed ellipticals were not formed. This problem turned out to be due to approximations in the Bruzual and Charlot (1993) stellar population synthesis models used by Cole et al. With the revised models of Charlot et al. (1995), the colour distributions are in much better agreement with observations (see Figure 2 of Frenk et al. 1995). The strong feedback restricting star formation in low circular velocity halos assumed by Cole et al. (1994) resulted in a relatively flat faint end slope for the luminosity function, but in spite of this, the models still produce more dwarf galaxies than observed locally by Loveday et al. (1992). More recent determinations, however, indicate that the faint end of the luminosity function is still uncertain (McGaugh 1994) and the revised model of Cole et al. in fact agrees quite well with the CfA luminosity function of Marzke et al. (1994; see Figure 3 of Frenk et al. 1995). The Tully-Fisher relation recovered by Cole et al. has a scatter and slope that matches those observed, but is offset from the data. This problem can be traced back to an overproduction of galactic size dark halos in cold dark matter (CDM) cosmologies (Kauffmann et al. 1993, Heyl et al. 1995). In this paper, we present an extension of the model of Cole et al. (1994) that allows the light of each galaxy to be split into a disk and a bulge component. The main aim of
Evolution of the Hubble Sequence this paper is to use this model in order to test the extent to which the distinction between disk and spheroidal systems may be accounted for by the simplest scheme compatible with hierarchical clustering. We shall assume (for the reasons given in Section 2 ) that stars form initially in a disk and that bulges and spheroids are formed from violent mergers of such disks. We therefore ignore secondary dynamical processes such as dynamical friction or galaxy harassment in clusters. With such a simplified scheme, we do not seek to account for the details of the morphological sequence, but merely to understand the basis of a broad morphological classification based upon the bulge-to-disk luminosity ratio. Our study extends earlier analyses by Kauffman et al. (1993) and Kauffmann (1995b, 1995c) who also proposed a merger driven scheme for the production of galactic bulges, with morphological classifications based on bulge-todisk ratios. They predicted the colours and morphological mix of galaxies in clusters as a function of absolute magnitude and examined the spiral or blue fraction and the colour-magnitude relation of galaxies in high-redshift clusters. Whilst the galaxy formation schemes of Kauffmann et al. (1993) and Cole et al. (1994) are similar in spirit, there are differences in detail in the way that the evolution of dark matter halos, star formation, feedback and galaxy mergers are treated. In addition, there are significant differences in our schemes for bulge formation which we discuss in Section 2.2. Finally, in this paper we concentrate on somewhat different issues from those investigated by Kauffman et al. A brief outline of the galaxy formation scheme of Cole et al. (1994) is given in Section 2.1. We describe the mechanism for bulge formation in Sections 2.2 and 2.3. Some representative examples of galaxies with different morphologies are given in Section 3. We examine the systematics of bulge formation in Section 4. The predictions of our model for the colours of galaxies as a function of type and environment, the morphological mix in different environments and the evolution of the luminosity function are compared with observations in Section 5. Finally, we discuss the success and failings of our model in Section 6. A detailed comparison of the predictions of our model with the faint galaxy counts as a function of morphological type obtained by the Hubble Space Telescope Medium Deep Survey, is given in a separate paper (Baugh et al. 1996).
2 2.1
A MODEL FOR GALAXY FORMATION Galaxy Formation Scheme
In our semianalytic scheme, the complexities of galaxy formation are approximated by a set of simple rules which, wherever possible, are motivated by the results of numerical simulations. Full details of the basic scheme can be found in Cole et al. (1994). Below we give a brief outline of how the various relevant physical processes are incorporated into the model. The collapse and merging of dark matter halos as a function of time are followed using the block model of Cole & Kaiser (1988) (see also Cole 1991). This provides information about the distribution of halos as a function of mass,
3
the redshift at which the halos collapse, the redshift at which they merge into bigger halos, and the properties of the halos into which subunits merge. Each dark matter halo has baryonic material associated with it. When the halo forms, the associated gas is shock heated and attains the virial temperature of the halo. Over the lifetime of the halo, defined as the time interval between the formation of the halo and its merger with a larger halo or the redshift of interest, some fraction of this hot gas can cool, according to the standard cooling function for primordial abundances of helium and hydrogen. Once the gas has cooled it can form stars. The star formation rate is assumed to be proportional to the mass of cold gas present divided by a star formation timescale. The latter is independent of the dynamical time at the epoch when the halo collapses, but is a function of the circular velocity of the dark matter halo. This is because the energy liberated by stellar winds and supernovae reheats some of the gas, giving rise to a feedback loop involving cooling, star formation and heating. The details of this feedback mechanism are based upon the results of ‘smooth particle hydrodynamics’ simulations by Navarro & White (1993) and has a stronger dependence on halo circular velocity than is predicted by a simple binding energy argument (White & Rees 1978, White & Frenk 1991). Without feedback, the majority of gas in the universe would cool at high redshift and form stars in low mass halos, precluding the possibility of star formation in more massive halos later on (White & Rees 1978, White & Frenk 1991, Cole 1991, Lacey et al. 1993). Our feedback prescription strongly inhibits the formation of stars in halos with low circular velocity. When a dark matter halo merges into a larger object, its hot gaseous corona is stripped and the gas becomes associated with the new halo. However, the cold gas and stars of the progenitor galaxies remain as separate entities until the galaxies themselves merge. When a new halo is formed, we compute a timescale for the merger of its galaxies, based upon a formula again motivated by numerical simulations (Navarro, Frenk & White 1995). This has a dependence upon the mass ratio of the participant galaxies that is weaker than that suggested analytically from pure dynamical friction considerations. If the galaxy merger timescale is shorter than the lifetime of the halo, the galaxies merge at the epoch at which the halo forms. The central galaxy in a halo accretes gas that cools from the merged corona and forms stars. The remaining satellite galaxies can only continue to form stars until their reservoirs of cold gas are exhausted. Luminosities for the resulting galaxies are calculated using spectral energy distributions predicted by the stellar population synthesis models of Bruzual and Charlot (1993, 1995). We ignore the effects of chemical enrichment since only spectral energy distributions for solar metallicity are available at present. The synthesis model that we adopt is the revised Bruzual-Charlot model, kindly provided to us by Stephane Charlot. It uses different tracks for the late stages of stellar evolution than the earlier version (see Charlot et al. 1995). For a single burst of star formation with age 10 Gyr, the revised models are redder by ∆(B −V ) = +0.1 and ∆(B −K) = +0.35 than the earlier models. Note that subtle differences in the choice of filter in a given band and in the
4
C.M. Baugh, S. Cole, C.S. Frenk
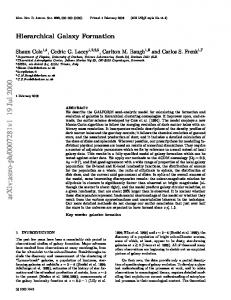
Figure 1. The correlation between bulge to disk ratio in the B band and Hubble T type. The Simien and de Vacouleurs data is for a sample of 96 galaxies; the data from de Jong is for 86 face on spirals. The de Jong data is for a 2D decomposition using exponential profiles for the bulge and disk. The points have been given a small, random, horizontal displacement for clarity. The dotted lines are the 20 and 80 percentiles for the Simien & de Vacouleurs data; the dashed lines are the 20 and 80 percentiles for the de Jong data. The two solid lines show the cuts on bulge to disk ratio that we use in this paper to make a broad distinction between morphological classes.
type of star used to set the zero point of a magnitude scale can lead to differences of up to a tenth of a magnitude for a given burst age in a particular stellar population model. In this paper we use slightly different filters to those employed by Cole et al. (1994), in order to obtain B − V colours consistent with those derived by Charlot et al. (1995) from the same population models. Throughout this paper, we shall use the parameters of the “fiducial model” of Cole et al. (1994). This is a CDM cosmology with Ω = 1, h = 0.5, Ωb = 0.06, where h denotes the Hubble constant in units of 100 km s−1 Mpc−1 . The amplitude of the power spectrum of mass fluctuations is normalised to reproduce approximately the abundance of rich galaxy clusters by setting the rms mass fluctuation in top hat spheres of radius 8h−1 Mpc, σ8 = 0.67 (White et al. 1993). This fiducial models requires strong feedback to supress star formation in dwarf galaxies and a moderate galaxy merger rate.
2.2
Bulge Formation
In our extended galaxy formation scheme, all galaxies initially form stars in a disk as hot virialised gas cools onto a collapsed dark matter halo. Thus we implicitly make the assumption that the timescale for star formation is longer than the collapse timescale of the gas. A disk configuration is the natural outcome of the dissipative collapse of gas at constant angular momentum and is indeed the configuration seen in SPH simulations (Katz 1991, Summers, Davis & Evrard 1993, Navarro, Frenk & White 1995.) Spheroidal distributions of stars and galactic bulges can only form as the outcome of merger events. In a violent merger, which we define as a merger in which the central galaxy accretes satellite galaxies with a total mass greater than some specified fraction of its own mass, any cold gas that is present is turned into stars in an instantaneous burst. After the merger and burst of star formation, if any takes place, no further stars are added to the bulge, until the next major merger happens. Galaxies orbiting in a common halo may continue to form stars quiescently in a disk until their cold gas reservoir is exhausted. The central galaxy can also
Evolution of the Hubble Sequence form disk stars from hot gas that cools and is accreted from the hot corona. This scheme for bulge formation is similar to that adopted by Kauffmann et al. (1993) and Kauffmann (1995b,c). However, as mentioned in Section 2.1, their galaxy formation model is different in detail to ours. In particular, Kauffmann et al. consider galaxy mergers that occur over the lifetime of a halo as a series of binary mergers. Hence, an individual satellite must bring in enough mass by itself in order to satisfy the criterion for bulge formation. No account is taken of the cumulative effects of disk heating or thickening caused by the prior accretion of satellites that were too small on their own to cause a significant change in the morphology of the central galaxy. In the scheme used in this paper, we simultaneously consider all satellites that will merge with the central galaxy over the lifetime of the halo. Hence, we classify more merger events as ‘violent’ mergers leading to the formation of a bulge. Whilst neither implementation of galaxy merging is fully accurate, the two approaches are likely to bracket what happens in reality. To determine whether a merger is classed as ‘violent’, we list the galaxies that will actually coalesce after the merger of their respective dark matter halos. The most massive galaxy is termed the central galaxy and the others are called its satellites. We compute the ratio of the sum of the mass of cold gas and stars in the accreted satellites to the mass of cold gas and stars in the central galaxy R=
P
Mcold gas + Mstars (Mcold gas + Mstars )central galaxy acc. sat.
(1)
If this ratio exceeds the specified value of a parameter, fbulge , the merger is termed a ‘violent’ merger. Following Kauffmann et al. , we set the value of the parameter fbulge by matching the morphological mix in our model to that observed locally. (Note, however, that since galaxy mergers are treated differently in our scheme and in that of Kauffmann et al. , we have given the parameter that defines a violent merger a different name; its numerical value will also be different.) In a violent merger, the disk of the central galaxy is destroyed and all the stars present are transferred to the bulge component of the new galaxy. All the cold gas that is present, i.e. the gas that had cooled in individual galaxy halos prior to the merger but had not yet been turned into stars, is then converted into bulge stars in an instantaneous burst. If the merger is not classed as violent, the disk of the central galaxy is preserved and no burst of star formation takes place. We have investigated two alternatives for the fate of the stars accreted from the satellite galaxies. In the first scheme, the stars from the satellites are added to the bulge of the central galaxy. In the second scheme they are added to the disk of the central galaxy, as would happen if the satellites are tidally disrupted and torn apart before they can reach the core of the central galaxy. Simulations by Walker et al. (1995), in which a satellite with total mass equal to 10% of the primary galaxy mass merges with it, reveal an intermediate situation. Roughly 50% of the satellite survives and sinks to the core of the primary, whilst the rest is ripped off and added to the primary’s disk. We find that there is little difference between the morphological mixes re-
5
covered in our models using these two prescriptions and we shall adopt the first one in the remainder of this paper. Modern simulations of merging galaxies attempt to follow the star formation that occurs during a merger. Mihos & Hernquist (1994a) have shown that a minor merger in which a disk galaxy accretes a satellite with 10% of its own mass produce spiral arm instabilities that drive gas into the centre of the disk and cause a burst of star formation. However, if a bulge component is added to the primary, the spiral arms are suppressed and a much smaller burst results. In a major merger event, Mihos & Hernquist (1994b) find that a burst occurs independently of the presence of a bulge component in the galaxies, but the timing of the burst relative to the completion of the merger and the strength of the burst do depend upon the size of the bulge. At present numerical simulations have explored only a small part of parameter space. Our model for bulge formation in which a burst of star formation only occurs after a violent merger is well motivated by the available numerical results. After a merger event in our model, star formation takes place quiescently in the disk of the central galaxy if a supply of cold gas is available. The bulge-to-disk ratio is therefore a continually changing quantity. It is quite possible for a galaxy to become a pure bulge immediately after a violent merger and to then build up a new disk by quiescent star formation. Thus a galaxy can move either way on the Hubble sequence, towards early types after a violent merger in which material is added to the bulge and towards late types during quiescent star formation when new stars are formed in the disk. 2.3
Setting the parameter fbulge
Following Kauffmann et al. (1993), we use the local morphological mix of field galaxies to set the value of the parameter fbulge . Our aim is to classify galaxies into three broad morphological classes: disk-dominated systems, bulgedominated systems, and systems with intermediate bulge-todisk ratios. We identify these broad classes with spirals (S), ellipticals (E) and lenticulars (SO) respectively. We assign morphological types to the model galaxies on the basis of the ratio of bulge luminosity to disk luminosity by reference to data from Simien & de Vaucouleurs (1986) and de Jong (1995). In Figure 1 we reproduce the Simien and de Vaucouleurs bulge-to-disk decompositions (as given in their Table 4) and de Jong’s (1995) data derived from 2D decompositions of the light in face on spirals. A T type T = −5 corresponds to an elliptical, T = −3 to an S0 and T = 0 to an early type spiral. There is considerable scatter in the relationship between bulge-to-disk ratio and T type. For example, a bulge-to-disk ratio of ∼ 1 spans ∼ 7 T types, whilst the class T = 4 is assigned to objects that have a spread of 103 in bulge-to-disk ratio. Decompositions of the light of a galaxy into bulge and disk components are difficult to perform, and the results, for some orientations at least, depend upon the functional form adopted for the decomposition (de Jong 1995). Furthermore, the assignment of T-types is fairly subjective. Naim et al. (1995) find that experts can only agree on their classifications to within 2 T-type units. It is not clear, therefore,
6
C.M. Baugh, S. Cole, C.S. Frenk
whether the scatter in Figure 1 is entirely observational or whether it reflects the fact that there is not a unique correspondence between bulge-to-disk ratio and T-type. Several studies in the literature have examined the morphological mix of local field galaxies. There is a relatively small scatter amongst different estimates of the elliptical fraction, ranging from 10% (in the Revised Shapley Ames Catalogue, Sandage & Tamman 1981) to 20% (in a subsample of bright galaxies drawn from the RC3 catalogue by Buta et al. 1994). The scatter in the spiral fraction is larger, around 20%, reflecting the difficulty of distinguishing between spiral and S0 galaxies, particularly at fainter magnitudes on photographic plates (Dressler 1980), when it becomes hard to detect the disk component in the presence of a significant bulge. A recent study, based on a large homogenous sample, assigned types to 90% of galaxies brighter than bJ = 16.44 in the Bright APM Galaxy Catalogue (Loveday 1995; Table 10). Incorporating the irregular/peculiar galaxies into the spiral class and scaling up the fractions in each type to account for unclassified objects, the morphological mix in this catalogue is E/S0/S+Irr=13/20/67. To fix the value of the parameter fbulge , we constructed mock catalogues from the output of our models, with the same magnitude limit as the Bright APM Galaxy Catalogue, taking into account any evolution in the galaxy properties. Kauffmann et al. classified galaxies whose bulge component is less than 40% of the total light as spirals, galaxies whose bulge component is 60% or more of the total light as ellipticals and galaxies with intermediate bulge to total light ratios as S0’s. If we adopt these definitions, we obtain spiral fractions of 45% and 55% for fbulge = 0.5 and 0.7 respectively. Alternatively, if we allow the maximum size of a spiral bulge to be 45% of the total light and the minimum bulge in an elliptical to be 65% of the total light, we obtain a morphological mix of E/S0/S of 23.5/22.5/54.0 for fbulge = 0.5. We shall adopt these definitions and this value of fbulge throughout this paper. The corresponding cuts in bulge-to-disk ratio are plotted in Figure 1 as solid lines. Galaxies lying below the lower solid line are classed as spirals, galaxies above the upper solid line as ellipticals and galaxies in between as S0s. Although it is clear that with some fine-tunning, we could achieve a higher spiral fraction, we do not feel that this is justified given the large uncertainties surrounding morphological classification (Naim et al. 1995) and the large scatter between bulge-to-disk ratio and T-type.
3
REPRESENTATIVE EXAMPLES
In this Section we follow the histories of a representative selection of galaxies in our model. At each galaxy merger event, we have recorded properties of the progenitor galaxies, such as their stellar mass, cold gas mass and luminosities in various bands. We plot the star formation history of selected galaxies in a tree-plot, analogous to the schematic merger history of a dark matter halo shown in Figure 6 of Lacey & Cole (1993). For this purpose we have traced the history of these galaxies back to progenitor galaxies with dark matter halos of mass 5 × 10¹⁰ h−1 M⊙ . We have selected a representative range of galaxies to
plot, the properties of which are listed in Table 1. For each galaxy, we show the amount of stars and stars plus cold gas in separate panels as a function of redshift. The horizontal dashed lines mark the redshift at which a merger event took place in the history of an object. The width of the black shaded regions indicates the mass of stars or cold gas and stars that are present in a particular object. The mass in cold gas and stars of the final galaxy at redshift zero is given unit width on the x-axis. We know the amount of cold baryonic material in each fragment at a merger, and, for simplicity, we perform a linear interpolation in the tree-plots between masses at subsequent merger events (although the actual star formation rate is exponential). The mass of cold material increases between merger events as gas cools over the halo lifetime and stars are formed. Hence, in a merger event, the width of the black shaded region for a particular progenitor indicates the fraction of the final mass of material (cold gas and stars or just stars depending on the plot) in the galaxy that this fragment was responsible for bringing in. Termination of a shaded region at high redshift indicates that the galaxy formed at that redshift or was contained inside a dark matter halo with mass below the resolution limit of the tree. The syncronisation of merger events is an artefact of the way in which we incorporate galaxy mergers into the block model. As discussed in Section 2.1, after the dark matter halos have merged, we calculate a timescale for the satellite galaxies to merge with the central galaxy of the new halo. Providing that this time is shorter than the lifetime of the halo, we allow the galaxies to merge at the epoch at which the halo is formed. In reality, these galaxy merger events would be spread out in time, after the redshift at which the new halo was formed. If we consider the tree for the spiral galaxy with ID 48506, we see that few mergers occured above the mass resolution of the tree. The bulge of this object was formed by the mergers at z = 2 and z = 0.4. Both these mergers are minor mergers, so there was no burst of star formation, and the disk of the accreting galaxy would have been preserved. However, the accreted stars would be put into the bulge component of the central galaxy. The SO tree (ID 48588) shows similarly few merger events, though the amount of cold gas and stars in the progenitors is more evenly matched in the merger at z ∼ 0.3, which is probably a major merger. The bulge to total ratio given in Table 1 is measured in B-band luminosity, and so will underweight the bulge component relative to the disk. Hence an object that would appear to have a high bulge to total ratio in terms of stellar mass, would be expected to have a lower bulge to total ratio in terms of B-band luminosity. The tree plots for the ellipticals (IDs 48764 and 48681) show many more merger events. In particular 48764, which is the central galaxy in a rich cluster at redshift zero shows many more mergers at higher z than 48681, which is in a lower circular velocity halo. The spiral and S0 trees look fairly similar. There are fewer merger events than in the history of an elliptical and the last significant merger takes place between only two progenitors.
Evolution of the Hubble Sequence
7
8
C.M. Baugh, S. Cole, C.S. Frenk
Evolution of the Hubble Sequence
9
Table 1. Representative Galaxies ID
M⋆ (1011 h−1 M⊙ )
LB (1010 hL⊙ )
Vgal (kms−1 )
B-K
bulge/total
Type
48681 48313 48764 48588
4.5 1.8 21.3 1.4
7.4 3.7 31.7 3.4
532 376 1016 281
4.02 3.68 4.05 3.66
0.75 0.24 0.71 0.54
E S E S0
Figure 4. The distribution of the redshift of the last major merger event for bright ellipticals (solid lines) and spirals (dashed lines). The upper and lower panels show differential and cumulative distributions respectively for galaxies brighter than mB − 5 log h = −18. There are 462 ellipticals that satisfy this condition and 152 spirals in our Monte-Carlo realization. The distributions in the upper panel have been normalised to the total number of objects in each class.
4
THE EPOCH OF BULGE FORMATION
In our model, the bulges of spiral and elliptical galaxies form by the same mechanism, violent mergers of galaxies. It is instructive therefore to examine whether or not there are any systematic differences between the bulges of galaxies of different morphological type and in different environments. Figure 4 shows the distribution in redshift of the last
Figure 5. The distribution of the redshift of the last major merger for bright field ellipticals (solid lines) and cluster ellipticals (dotted lines) in halos with circular velocity vc > 1000kms−1 . The upper and lower panels show differential and cumulative distributions respectively for galaxies brighter than mB − 5 log h = −18.
major merger event for ellipticals (solid lines) and spirals (dotted lines). The average redshift of the last major merger for elliptical galaxies is z¯ = 0.68, whilst for spirals it is z¯ = 1.26. In an Ω = 1 cosmology, this corresponds to a time difference of 2 Gyr. Our model predicts that ∼ 50% of bright ellipticals have had a major merger between 0.0 ≤ z ≤ 0.5, in which time only 15% of spirals have suffered a significant merger. In Figure 5, we compare the redshift of the last major merger for ellipticals in the field and ellipticals found in
10
C.M. Baugh, S. Cole, C.S. Frenk
Figure 6. The fraction of the stellar mass of a galaxy at z = 0 that was formed in bursts triggered by major mergers. Galaxies classified as ellipticals at z = 0 on the basis their bulge-to-disk ratio and with absolute magnitudes mB − 5 log h < −18 are considered. The mass of stars formed in bursts is accumulated in four redshift bins. The curves are normalised by the total number of galaxies that have experienced a burst.
halos with circular velocity, vc > 1000kms−1 . Cluster ellipticals form their bulge component at a higher mean redshift, z¯ = 0.94, than field ellipticals. This is because evolution is ‘accelerated’ in the high density cluster environment and so the collapse and merging of the dark matter halos that end up in the cluster occurs at higher redshift than in the field. As Figures 4 and 5 illustrate, our model predicts that the bulges of spirals are assembled before the spheroids of ellipticals, and that the spheroids of cluster ellipticals are assembled before those of field ellipticals. We have also calculated the fraction of the final stellar mass of elliptical galaxies that is formed in bursts of star formation triggered by major mergers throughout the history of the galaxy. Figure 6 shows the distribution of the fraction of the final stellar mass formed in burst events, split into redshift bins. The curves have been normalised by the total number of bursts and so the relative areas under the curves indicate the number of bursts that take place in each redshift bin. Every bright elliptical galaxy in our sample has experienced a major merger between redshifts 0 < z < 3, and 53% have had a burst in the redshift interval 0.5 < z < 1.0. The bursts in the 0.5 < z < 1.0 interval, at a lookback time of 6-8.5 Gyr, are, on average, responsible for 15% of the final mass of the galaxy involved. Bursts in the highest redshift interval, 1.5 < z < 3.0 typically produce ∼ 30% of the final stellar mass, but occur in a much smaller fraction of the bright ellipticals. This difference results from the interplay between the mass function of fragments, their merger rate,
Figure 7. The number of fragments, brighter than L∗ /10, that were involved in the last merger event of galaxies brighter than L∗ today, plotted against the redshift at which the merger took place. The dotted lines show the 20 and 80 percentiles of the distribution of fragments, and the solid line shows the median.
Evolution of the Hubble Sequence
11
and the higher fraction of cold gas available at high redshift. Our results are in accordance with recent detections of intermediate age populations in elliptical galaxies. The data suggest that ∼ 15% of the V-band light in ellipticals was formed in an episode of star formation approximately 5 Gyr ago, long after the formation of the bulk of the stars (Freedman 1992, Elston & Silva 1992). A question that is often posed in connection with the interpretation of faint galaxy counts is how many fragments are needed at high redshift to make up a typical galaxy today (Guiderdoni & Rocca-Volmerange 1988, Broadhurst et al. 1992)? In Figure 7 we plot the number of fragments brighter than L∗ /10 that participated in the last merger event of galaxies that are brighter than L∗ today, against the redshift at which the merger took place. Thus the fragments plotted are up to ∼ 2.5 magnitudes fainter than the presentday galaxy. Most spirals and S0s contained only one or two such fragments at z < 1, although a few were ‘broken-up’ into five or six fragments. By contrast, a significant fraction of present-day ellipticals contained more than 4 fragments at z ≃ 0.5. These sorts of numbers are similar to those invoked by Guiderdoni & Rocca-Volmerange (1988) and Broadhurst et al. (1992) to account for the faint number counts. These ad hoc ‘merging models’, however, require further assumptions and are not directly comparable to our hierarchical clustering scheme.
5 5.1
COMPARISON WITH OBSERVATIONS Colour as a function of morphology, environment and redshift
Since no quiescent star formation takes place in a bulge between merger events, model galaxies with large bulge-to-disk ratios are redder than model galaxies with small bulge-todisk ratios. In Figure 8, we plot B − K and B − V colours for present-day galaxies brighter than B = −20, against their B-band bulge-to-disk ratios. Different morphological types are represented with different symbols. Also plotted is a compilation of B − V colours by Buta et al. (1994) for a sample of bright galaxies taken from the Third Reference Catalogue (RC3) (de Vaucouleurs et al. 1991). Buta et al. find a good correlation between Hubble T-type and colour. Converting T-type into a bulge-to-disk ratio (using the fit of equation (5) of Simien and de Vaucouleurs 1986), this correlation is shown as a solid line in the lower panel of Figure 8, with the 1σ scatter indicated by the dotted lines. There is very good agreement between our model predictions and the observations, although some of our galaxies with bulgeto-disk ratios less than 20% appear a little too red. This discrepancy, however, is just over a tenth of a magnitude in B − V , comparable to the uncertainty in colour arising from the details of the filter choice and the template star used to set the zero point. Figure 9 shows diagrams of B-V colour versus absolute B magnitude at redshifts z = 0 and z = 0.5. As before, triangles denote elliptical galaxies, crosses S0s and circles spiral galaxies. The ellipticals are the reddest population and show a remarkably small spread in colour, an issue to
Figure 8. B-K and B-V colours as a function of bulge-to-disk ratio at the present day. Triangles represent ellipticals, crosses SOs and circles spiral galaxies. The solid line in the lower panel shows the mean B-V colour for a sample of bright galaxies drawn from the RC3 catalogue by Buta et al. 1994; the dotted lines indicate the 1σ scatter. Only galaxies brighter than B = −20 are plotted.
which we return below. Their colour-magnitude relation is essentially flat, in apparent contradiction with the naive expectation from hierarchical clustering models in which the largest objects typically form last. As pointed out by Cole et al. (1994), this is a remarkable success of these models. The scatter in colour amongst spirals is larger than amongst ellipticals, reflecting the more extended periods of star formation in disks. S0s have intermediate colour properties. Other than a general reddening of the populations and a slightly larger scatter in the colours of spirals, there is little change in the appearance of the colour-magnitude diagrams at z = 0.5 and z = 0. This is in spite of the fact that a large fraction of the present-day stellar populations are still to form at z = 0.5. Next, we examine the colours of bright galaxies as a function of environment. Figure 10 shows the mean colours of ellipticals (triangles) and spirals (squares) found in halos of a given circular velocity, at redshifts z = 0 and z = 0.5. The error bars give the root mean square scatter about the mean. There is no significant dependence of colour on halo
12
C.M. Baugh, S. Cole, C.S. Frenk
Table 2. Elliptical galaxy colours: galaxies brighter than B = −19. colour
cluster ellipticals z=0
B-V B-K U-V
0.937 4.044 1.520
(0.031) (0.071) (0.080)
field ellipticals
z = 0.5 0.828 3.731 1.221
(0.027) (0.063) (0.059)
Figure 9. B-V colours as function of absolute B band magnitude. The upper panel corresponds to z = 0 and the lower panel to z = 0.5. Triangles represent ellipticals, crosses SOs and circles spiral galaxies.
circular velocity for either ellipticals or spirals at the two epochs shown. For ellipticals, this result agrees well with the data of Bower et al. (1992), who found no evidence for colour differences between galaxies in the Virgo (vc ∼ 1000 kms−1 ) and Coma (vc ∼ 1400 kms−1 ) clusters. As this and the previous figure show, both ellipticals and spirals redden by ∼ 0.2 mag between z = 0.5 and z = 0. Photometry of the reddest ellipticals in clusters at z ≃ 0.5 do indeed show that these galaxies have slightly bluer colours than their local counterparts (Arag´ on-Salamanca et al. 1993). In Figure 11 we contrast properties of bright ellipti-
z=0 0.922 4.009 1.478
(0.034) (0.071) (0.085)
z = 0.5 0.754 3.563 1.046
(0.048) (0.107) (0.100)
Figure 10. The mean B-V colours of elliptical and spiral galaxies as a function of the circular velocity of the dark matter halo in which they reside. Triangles correspond to elliptical and squares to spiral galaxies. The circular velocity bins are 200 kms−1 wide and we have offset the points from the centre of the bins slightly for clarity. The upper panel corresponds to z = 0 and the lower panel to z = 0.5.
cal galaxies in clusters and in the field. This figure shows U − V vs V colour-magnitude diagrams for the entire population of ellipticals (upper panel) and for ellipticals found in rich clusters, which we define as halos of circular velocity vc > 1000kms−1 (lower panel). For comparison, the median colour and root mean square scatter for the cluster ellipticals are reproduced in both panels. Ellipticals in rich clusters are predicted to be ∼ 0.02 − 0.03 mag redder than the overall elliptical population, reflecting the earlier mean formation
Evolution of the Hubble Sequence
13
Figure 12. The cumulative distribution of objects as a function of bulge-to-total light ratio in the B band. The solid line shows the whole galaxy population and the dotted line the subset of galaxies found in clusters, ie in halos with circular velocity, vc > 1000kms−1 .
Figure 11. The colour-magnitude relation in different environments. The upper panels shows elliptical (triangles) and S0 galaxies (crosses) found in all environments. The lower panel shows only those galaxies found in halos with circular velocity vc > 1000kms−1 . The solid lines show the median U − V colour for the cluster ellipticals and the dotted lines show the rms scatter from our model. These lines are reproduced in both panels for comparison.
epoch of galaxies in clusters. A similar trend is seen in the observations, although the available data are relatively poor (Larson, Tinsley and Caldwell 1981). Table 2 gives the mean colours and rms scatter in brackets for the entire population and for the subset of cluster ellipticals at redshifts z = 0 and z = 0.5. Only galaxies brighter than B = −19 are included in this calculation, yielding a total of 210 galaxies at z = 0 and 100 at z = 0.5. The cluster subsample comprises 45 ellipticals at z = 0 and 13 at z = 0.5. Figure 11 reiterates the point made earlier regarding the small scatter in colour displayed by our model elliptical galaxies. This is particularly true of ellipticals in clusters, a result first obtained by Kauffmann (1995c) using similar models. The root mean square scatter for cluster ellipticals shown by the dotted lines in Figure 11 was calculated by the Median Absolute Difference technique used by Bower et al. (1992). The scatter we find for cluster ellipticals is δ(U − V ) = 0.074, compared with the observed value of δ(U − V ) = 0.04 for the Virgo and Coma clusters. The scat-
ter in our model increases for V > −21. The observational data is taken from the cluster core, whereas our model gives the properties of all galaxies within the virial radius of the cluster. Hence, a slightly bigger scatter in the colour of the cluster ellipticals in our model is to be expected. Such uniformity may seem surprising in a model in which the bulk of the stars form relatively recently and galaxy mergers are the primary mechanism for the formation of ellipticals. The explanation for this lies in the fact that most of the stars that end up in bright cluster ellipticals were made in smaller fragments at higher than average redshift. When these fragments merge, residual star formation can occur but, as discussed in Section 4, this contributes only a relatively small fraction of the final light. Mergers therefore mainly move galaxies along the luminosity direction, with little change in colour. The scatter in the colours of cluster ellipticals is comparable at z = 0.5 and z = 0 (cf. Figure 10). This, again, agrees surprisingly well with the observations of Standford et al. (1995) who find a similar scatter in optical-IR colour in two Abell clusters at z = 0.374 and z = 0.407 to the scatter found by Bower et al. (1992) in Coma and Virgo. 5.2
The morphological mix in clusters and groups as a function of redshift
The best known environmental influence on galaxy morphology is Dressler’s (1980) morphology-density relation. In its simplest form this is the statement that the fraction of ellipticals and S0s in clusters increases rapidly with the mean
14
C.M. Baugh, S. Cole, C.S. Frenk
Figure 13. The spiral fraction of galaxies in groups and clusters as a function of halo circular velocity. The symbols indicate the richness of the group, defined as the number of galaxies brighter than mB − 5 log h = −18. Triangles show groups with 2-10 members, squares with 10-20 members and circles with more than 20 members. The upper panel shows model predictions at z = 0 and the lower panel at z = 0.5.
projected galaxy number density. More recently, Whitmore and Gilmore (1991) have argued that the fundamental relation is one between morphological mix and distance from the cluster centre. Re-analysing Dressler’s (1980) cluster sample, they found that the elliptical fraction rises steeply within 0.5Mpc of the cluster centre and that the fraction of S0s actually falls within 0.2Mpc. This suggests that the morphological mix depends upon a global property of the cluster rather than on a local property such as substructure. Since our models contain no information on the spatial distribution of galaxies within clusters, they do not address Dressler’s morphology-density relation directly. The do, however, predict the morphological mix within the virial radius of a cluster (defined as the radius within which the mean density is 178 times the mean background density.) For a 1015 h−1 M⊙ halo that collapses at the present day, this radius is 1.6h−1 Mpc. Examination of Figure 1 of Whit-
Figure 14. As Figure 13 but with the group richness defined as the number of galaxies brighter than mB − 5 log h = −19.
more (1990) shows that the elliptical fraction at this radius is < 20%, compared with a peak value of 60% at the centre of the cluster. In Figure 12 we compare the cumulative distributions of bulge-to-disk ratios for the galaxy population as a whole (solid line) with that for galaxies located in high circular velocity halos (vc > 1000kms−1 ) (dotted line). The cluster distribution is biased towards higher bulge-todisk ratios, implying a morphology-density relation in the same direction as the observations. In rich clusters, 22% of our model galaxies are ellipticals, compared to 12% in the population as a whole. We investigate the dependence of morphology on environment further by plotting the spiral fraction as a function of the circular velocity of the halo to which the galaxies belong. This fraction is shown in Figures 13 and 14 for galaxies brighter than MB − 5 log h = −18 and −19 respectively and spans the range of circular velocities from poor groups to rich clusters. To obtain these data, we constructed six realisations of the density fluctuation field, three sampled from a Gaussian distribution in the usual way and three more constrained to be overdense, with amplitude distributed uniformly in units of the rms fluctuation on the scale of the
Evolution of the Hubble Sequence block. The scatter in the spiral fractions displayed in Figures 13 and 14 is large for poor groups and decreases for higher vc clusters. In agreement with the results of Kauffmann (1995b), we find that the richest clusters are E/S0 dominated. We can compare the model predictions of Figures 13 and 14 with the data obtained by Nolthenius (1993) for groups identified in the CfA1 redshift survey. We convert circular velocities to velocity dispersions assuming an isothermal potential and an isotropic velocity distribution, √ σ1D = vc / 2). Considering only galaxies brighter than mB − 5 log h = −18, we find a mean velocity dispersion of 285 ± 72kms−1 for groups with a spiral fraction greater than 50%, rising to 352 ± 123kms−1 for groups with spiral fraction smaller than this. The corresponding numbers for the CfA1 groups are 119 ± 91kms−1 for spiral rich groups and 173±156kms−1 and for spiral poor groups. Thus, the scatter in our model predictions is comparable to that in the CfA1 data, but the two distributions are offset from one another. This discrepancy is not necessarily a serious one: group velocity dispersions are notoriously difficult to measure from redshift surveys and are very sensitive to the details of group assignments (Moore, Frenk & White 1993). The model velocity dispersions are, of course, those appropriate to the dark matter halos. Figures 13 and 14 also show our model predictions for the spiral fractions at redshift z = 0.5. For both definitions of cluster richness, the spiral fractions in groups of all circular velocities are larger at z = 0.5 than at the present day. This trend is particularly noticeable for the richest clusters. Indeed, for vc > 1000kms−1 , there are practically no clusters with a spiral fraction smaller than 40% at z = 0.5, whereas at the present day such clusters are well represented. Thus our models (like those of Kauffmann 1995a) display a strong Butcher-Oemler effect and are consistent with recent HST observations (Dressler et al. 1994) that indicate that the large blue fraction in high-z clusters, originally discovered by Butcher & Oemler (1978), is, in fact, due largely to a higher fraction of bright spirals in these clusters. Our models are also consistent with the data of Allington-Smith et al. (1993) which show that the fraction of blue galaxies in poor groups changes much less with redshift than the corresponding fraction in rich clusters. Kauffmann (1995a) interpreted the origin of the Butcher-Oemler effect in her models in terms of the different dynamical ages of clusters picked out at different redshifts. At high redshift, a collapsed cluster of a given mass corresponds to a rarer fluctuation than a collapsed cluster of the same mass at low redshift. As a result, clusters seen at high redshift have undergone more merging in the period just before their formation. In our model this means that galaxy mergers are less likely in the dark matter halos that are progenitors of the cluster, because the halo lifetime will tend to be shorter than the galaxy merger timescale; at redshift zero, the dark matter halo lifetime is longer and galaxy mergers are more likely. Hence, the population of galaxies that become members of a high redshift clusters shows a higher fraction of spirals than the population that become cluster members at the present day. Furthermore, when a spiral falls into a cluster, its star formation continues only
15
as long as its reservoir of cold gas remains. During this phase, its bulge-to-disk ratio will decrease. However, once the reservoir is depleted the galaxy will redden and fade (unless it merges into the central object). In a cluster that forms recently, there is, on average, more time for this process to proceed than in a cluster that forms at high redshift and this results in a further suppression of bright spirals in low redshift clusters. 5.3
Evolution of the Luminosity Function
Lilly et al. (1995), Ellis (1995), Ellis et al. (1995) have presented observations of the luminosity function of galaxies in redshift bins up to z ∼ 1. They find little evidence for change in the luminosity function of red galaxies, but find evolution of the blue galaxies or in the case of Ellis et al. galaxies that have high equivalent widths for the [O II] 3727 line, indicative of recent star formation. Indeed for blue galaxies, Lilly et al. (1995) report that the evolution saturates at the bright end, but the luminosity function continues to rise at fainter magnitudes. Cole et al. (1994) gave predictions for the evolution of the galaxy luminosity function with redshift (see their Figure 19). In this Section we compare our model specifically with the observations of the Canada-France Redshift Survey (CFRS) described in Lilly et al. (1995), because we extract information on broad band colours from the stellar population models, rather than the equivalent widths of particular lines. The CFRS sample is I selected in the magnitude range 17.5 ≤ IAB ≤ 22.5. The survey consists of 730 galaxies, of which 591 have secure redshifts with a median of z = 0.56. Lilly et al. assign a spectral type to each galaxy by comparing the observed (V − I)AB colours with the spectral energy distributions (SED) of Coleman et al. (1980). The spectral type is then used to compute a ‘colour k correction’ to obtain the rest frame BAB and rest frame (U − V )AB colour. The sample is then split into red and blue galaxies using the rest frame (U −V )AB colour of an Sbc galaxy from Coleman et al. (1980) as a reference point. We construct a mock CFRS catalogue from our model output by selecting galaxies in the appropriate I magnitude range. Note that we have no need to apply k-corrections as we know the SED of a galaxy in our model and can compute the rest frame colours and the appropriate transformation to the AB magnitude system directly from this. The colourmagnitude relation that we find in different redshift bins is shown in Figure 15, which should be compared with Figure 5 of Lilly et al. (1995). For this plot we have used 730 galaxies to match the sample size of Lilly et al. . The different symbols indicate the morphological type of the galaxies at the redshift at which they appear in the catalogue: triangles correspond to ellipticals, crosses to SO’s, open circles to spirals and stars to objects in which less than 5% of the total light in the B band is in the bulge component. The dashed vertical line is at (U − V )AB = 1.60, the rest frame colour at which we divide the model sample into red and blue galaxies. Lilly et al. used a cut of (U − V )AB = 1.3. The model colour-magnitude diagram is very similar to that for the CFRS data. However, the spread of colours in the models is smaller than that observed. These differences are
16
C.M. Baugh, S. Cole, C.S. Frenk
not significant and do not affect our conclusions presented below. The SED can change rapidly in the range of wavelengths measured by the U filter, being especially sensitive to assumptions made about star formation and the choice of U filter can lead to differences in the colour. Using a larger mock catalogue, containing 10000 galaxies, we compute the luminosity function of the red and blue galaxies in redshift bins, using the 1/Vmax formalism employed by Lilly et al. (1995). The luminosity functions are plotted in Figure 16, which may be compared directly with Figure 3 of Lilly et al. (1995). The red galaxies are shown in the left column and the blue galaxies in the right coloumn. Redshift increases down the plot. The dashed line is the Schechter function fit given by Loveday et al. (1992), with parameters scaled to AB magnitudes and H0 = 50kms−1 Mpc−1 , and is intended as a reference point. The open points with errorbars are the best fit luminosity function from Lilly et al. (1995). The filled points show the predictions of our model. The model luminosity function of the blue galaxies does show more evolution than that of the red galaxies, with the luminosity function steepening, particularly between the 0.05 < z < 0.20 and 0.50 < z < 0.75 redshift bins. The luminosity function of the red galaxies remains approximately unchanged at the bright end. Overall, there is remarkably good agreement between our model predictions and the data, except at the faint end of the red galaxy luminosity function in the lowest redshift bin. This discrepancy is the same one noted previously by Cole et al. (1994), but as this plot shows, the steep faint end of the model luminosity function is restricted to the red galaxies. The agreement with the data for red galaxies at high redshift is particularly noteworthy, since in our model 40% of the present day stars have still to form at z = 0.75. Schade et al. (1995, 1996) have analysed the morphology of the galaxies in one of the CFRS fields. Though the main effect responsible for the evolution of the blue luminosity function is the increase in the number or brightness of blue disk galaxies with increasing redshift, a population of CFRS objects that are bulge dominated but which have blue colours appears at high redshift. At z > 0.5, Schade et al. (1996) find that ∼ 14% of the sample, roughly double the fraction for z < 0.5. are “blue-nucleated galaxies” or BNG. With correction factors, this figure is doubled and matches the fraction of BNGs in a smaller sample measured with the HST. In our mock catalogue, we can apply a similar criterion, identifying BNG’s as galaxies that have a rest frame colour bluer than (U − V )AB = 1.6 and a bulge to total luminosity ratio greater than 50%. We find that 5% of the our mock CFRS sample would be classed as a BNG at redshifts z < 0.5, and this figure rises to 22% for z > 0.5.
6
DISCUSSION
We have presented an extension of the semianalytic galaxy formation scheme of Cole et al. (1994) that allows the light of a galaxy to be split into bulge and disk components. Galaxies are assumed to form stars quiescently in a disk until a merger disrupts them into a spheroidal configuration. Vio-
lent mergers are accompanied by a burst of star formation that adds further stars to the bulge. After a major merger, a spheroid may accrete gas from its hot corona and grow a new disk. Thus, in this scheme, a galaxy may acquire a range of Hubble types during its lifetime. We have presented treediagrams that illustrate the growth of galaxies of different types. To distinguish between disks and spheroids requires adding one additional parameter to the semianalytic model: the relative mass of a satellite capable of disrupting a disk. We fix this, as well as the bulge-to-disk ratios that define different morphological types, by comparing the predicted morphological mix with that observed locally. Although for reasons of clarity we have used the words spiral and elliptical to refer to different classes, our simple scheme can only distinguish between broad morphological properties based upon whether the bulge or the disk makes the dominant contribution to the total light of the galaxy. We used this scheme within the ‘fiducial’ Ω = 1, standard cold dark matter model of Cole et al. in order to calculate the formation histories of galaxies with different morphologies; the colours of galaxies of different types at low and high redshift, and in field and cluster environments; the variation of morphological mix with environment and the evolution of the luminosity function of red and blue galaxies as a function of redshift. We find that most spirals and S0s had only one or two progenitors with luminosity greater than L∗ /10 at redshift z < 1, whereas a significant fraction of ellipticals had five or six such progenitors. The average redshift of the last major merger undergone by present day spirals is z¯ = 1.26 and by present day ellipticals is z¯ = 0.68. Our model predicts that the bulges of spirals were assembled before the spheroids of ellipticals and the spheroids of cluster ellipticals were assembled before those of field ellipticals. About 50% of ellipticals, but only about 15 % of spirals, have undergone a major merger during the redshift interval 0.0 ≤ z ≤ 0.5. Since major mergers are accompanied by a burst of star formation, we find that about half the population of bright ellipticals has undergone a burst of star formation in the past 6-9 Gyr. Such bursts account for around 15% of the stellar mass of the galaxy at z = 0 and may be responsible for the ‘intermediate age populations’ detected in ellipticals by Rose & Tripicco (1986), Freedman (1992) and Elston & Silva (1992). They may also account for the observations of Barger et al. (1995) that suggest that ∼ 30% of the ellipticals in three clusters at z ∼ 0.3 have experienced a burst of star formation in the 2 Gyr preceeding observation. Similarly, some of the ‘E+A’ spectra measured by Dressler & Gunn (1992) in cluster ellipticals may be the result of these mergerinduced starbursts. A striking result of our analysis, previously noted by Kauffmann (1995c), is the flat slope and small scatter in the colour-magnitude diagrams of cluster elliptical galaxies (see also Cole et al. 1994). This is a counter-intuitive outcome of hierarchical clustering where we might have expected brighter galaxies to be bluer and a large scatter in colour due to the chaotic nature of mergers. In fact, the scatter we find amongst bright galaxies is comparable to the scatter in the observations of Bower et al. (1992) of ellipticals
Evolution of the Hubble Sequence
17
Figure 15. The colour-magnitude relation in bins of redshift for a sample of 730 galaxies selected from our models with magnitudes 17.5 ≤ IAB ≤ 22.5. Triangles indicate elliptical galaxies, crosses S0’s, circles spirals and stars objects that have a bulge component containing less than 5% of the total light. The vertical line shows the cut in colour that we have adopted to separate the galaxies into red and blue subsamples.
in the Coma and Virgo clusters, when one takes into account that the observations are of the cluster cores, whereas our models cannot revolve within the virial radius. A flat colourmagnitude relation in the models results from the fact that the bulk of the stars that end up in ellipticals formed at high redshift even though the galaxies themselves were not assembled until much later. The small scatter results, in part, from the flatness of this relation. The observed colour-magnitude diagram of cluster ellipticals is, of course, not completely flat, but has a small gradient of increasing redness with increasing brightness. In the context or our models this gradient must be due to metallicity effects which, in the absence
of the appropriate stellar population synthesis models, we have been forced to neglect. We plan to study these effects in a forthcoming paper using Worthey’s (1994) new, metallicity dependent synthesis models. Whether our models will be able to reproduce the observed gradient whilst retaining a small scatter in colour remains an open question. An important prediction of our models is the similarity between the colour-magnitude diagrams at redshifts ∼ 0.5 and at the present day. The main evolutionary effect is a blueing of the galaxies by about 0.15 mag in B-V, similar to that observed in cluster ellipticals by Arag´ on-Salamanca et al. (1993). This results from a combination of passive evo-
18
C.M. Baugh, S. Cole, C.S. Frenk
Figure 16. Luminosity functions of galaxies in our mock catalogue as a function of colour and redshift. The red galaxies are shown in the left-hand panels and the blue galaxies are shown in the right-hand panels. The galaxies are binned in redshift and the redshift increases down the plot, as indicated in the upper-left corner of each panel. The open points with error bars show the best estimate of the CFRS luminosity function of Lilly et al. (1995) (their Figure 3). The filled points show the evolution of the luminosity function of ’red’ and ’blue’ galaxies in a mock CFRS catalogue constructed from our model. The dotted line is for reference and shows the Schechter function given by Loveday et al. (1992)
Evolution of the Hubble Sequence lution of the stellar populations and evolution of the star formation rate. Other than that, our models of elliptical galaxies predict almost no increase in the scatter in colour at a given luminosity out to z ≃ 0.5. For spirals, there is a moderate increase in the scatter at high redshift. Both at z = 0.5 and at the present, the mean B-V colours of ellipticals and spirals in clusters are almost independent of cluster richness. Rich clusters in our model contain a different mix of morphological types if they collapse at redshift zero, compared with clusters that collapse at z = 0.5. Kauffmann (1995a) has demonstrated that a cluster of a given mass at high redshift is assembled more rapidly than a cluster of the same mass at the present day. In the context of our model, this means that the lifetime of a dark matter halo that is a progenitor of a cluster at high redshift will typically be much shorter than the timescale for galaxy mergers. Hence the population of galaxies that become members of high redshift clusters shows a higher fraction of spirals, in agreement with HST observations of z ∼ 0.4 clusters (Dressler et al. 1994). The dark matter halo lifetime for low redshift cluster progenitors is longer, and so galaxy mergers are more likely. Hence in our model rich clusters that form at low redshift are dominated by E/S0 galaxies, reproducing the morphologydensity relation discovered in the real universe by Dressler (1980). We have compared the predictions of our model with observations of the luminosity function at different redshifts. When the model galaxies are separated by colour, the luminosity function of the blue galaxies evolves in steepness and brightness between z ∼ 0.1 and z ∼ 0.6, remaining fairly constant up to z ∼ 1. The luminosity function of the red galaxies stays approximately constant with redshift. At higher redshifts, we do find objects that have blue colours and which are bulge dominated. This is expected if these galaxies have recently experienced a merger event, with the blue colours due to a burst having taken place in the case of a violent merger or because stars that had recently formed in a disk have now been incoporated into the bulge for the case of a minor merger. The calculations presented in this paper serve to demonstrate that the simplest possible prescription for the distinction between disks and spheroids that is compatible with hierarchical clustering goes a long way towards explaining many of the systematic trends observed in the galaxy population. Our models are necessarily idealised and ignore processes such as internal galactic phenomena or dynamical friction in clusters, which have almost certainly helped to shape the complex morphologies of real galaxies. It is therefore quite remarkable that they are able to account, at least in an approximate way, for such fundamental properties as the morphology-density relation, the colour-magnitude diagram, the Butcher-Oemler effect and the evolution of the luminosity function of galaxies of different colours. A number of critical observations such as measurement of colourmagnitude diagrams of cluster galaxies at high redshift will help to test this paradigm.
19
ACKNOWLEDGEMENTS We would like to thank Stephane Charlot for providing us with a revised stellar population model. Richard Nolthenius kindly provided his data in electronic form. We thank Richard Bower for his detailed comments on an earlier version of this paper and for the loan of statistical software. We acknowledge useful conversations with Guinivere Kauffmann, Gary Mamon and Julio Navarro. CMB acknowledges a PPARC research assistantship and SMC a PPARC Advanced Fellowship. This work was supported in part by a PPARC Rolling Grant.
REFERENCES Allington-Smith, J.R., Ellis, R.S., Zirbel, E.L., Oemler, A., 1993, Astroph. J., 404, 521 Arag´ on-Salamanca, A., Ellis, R.S., Couch, W.J., Carter, D., 1993, MNRAS, 262, 764 Barger, A.J., Arag´ on-Salamanca, A., Ellis, R.S., Couch, W.J., Smail, I., Sharples, R.M., 1995, MNRAS, in press Barnes, J.E., Hernquist, L., 1992, Ann. Rev. Astron. Astroph., 30, 705 Bond, J.R., Cole, S., Efstathiou, G., Kaiser, N., 1991, Astroph. J., 379, 440 Bower, R.G., 1991, MNRAS, 248, 332 Bower, R.G., Lucey, J.R., Ellis, R.S., 1992, MNRAS, 254, 589 Bower, R.G., 1995 astro-ph/9511058 Broadhurst, T.J., Ellis, R.S., Glazebrook, K., 1992, Nature, 355, 55 Bruzual, G., Charlot, S., 1993, Astroph. J., 405, 538 Buta, R., Mitra, S., de Vaucouleurs, G., Corwin, H.G., 1994, Astron. J., 107, 118 Butcher, H.R., Oemler, A., 1978, Astroph. J., 219, 18 Butcher, H.R., Oemler, A., 1984, Astroph. J., 285, 426 Charlot, S., Worthey, G., Bressan, A., 1995, Astroph. J., in press Cole, S., 1991, Astroph. J., 367, 45 Cole, S., Kaiser, N., 1988, MNRAS, 233, 637 Cole, S., Arag´ on-Salamanca, A., Frenk, C.S., Navarro, J.F., Zepf, S.E., 1994, MNRAS, 271, 781 Coleman , G.D., Wu, C.C., Weedman, D.W., 1980 Astroph. J., Suppl. 43, 393 Colless, M., Schade, D., Broadhurst, T.J., Ellis, R.S., 1994, MNRAS, 267, 1108 Couch, W.J., Ellis, R.S., Sharples, R.M., Smail, I., 1994, Astroph. J., 430, 121 Dressler, A., 1980 Astroph. J., 236 351 Dressler, A., Gunn, 1992, Astroph. J. Suppl., 78, 1 Dressler, A., Oemler, A., Sparks, W.B., Lucas, R.A., 1994, Astroph. J., 435, L23 Eggen, O.J., Lynden-Bell, D., Sandage, A.R., 1962, Astroph. J., 136, 748 Ellis, R.S., 1995, astro-ph/9508044 Ellis, R.S., Colless, M., Broadhurst, T., Heyl, J., Glazebrook, K., 1995, MNRAS, in press Elston, R., Silva, D., 1992, Astron. J., 104, 1360
20
C.M. Baugh, S. Cole, C.S. Frenk
Farouki, R., Shapiro, S.L., 1981, Astroph. J., 243, 32 Frenk, C.S., Baugh, C.M., Cole, S., 1995 to appear in proccedings IAU symp. 171, New light on Galaxy Evolution, eds. Bender, R., Davies, R.L., (Kluwer) Freedman, W., 1992, Astron. J., 104, 1349 Guiderdoni, B., Rocca-Volmerange, B., 1988, Astron. & Astroph., 205, 369 Gott, J.R., Thaun, T.X., 1976, Astroph. J., 204, 649 Gunn, J.E., Gott, J.R., 1972, Astroph. J., 176, 1 Heyl, J.S., Cole, S., Frenk, C.S., Navarro, J.F., 1995, MNRAS, 274, 755 de Jong, R.S., 1995 PhD Thesis Groningen Joseph, R.D., 1990, in Dynamics and Interactions of Galaxies, ed Weilen, R., (New York:Springer) 132 Katz, N., 1991, Astroph. J., 368, 325 Katz, N., Hernquist, L., Weinberg, D.H., 1992, Astroph. J., 399, L109 Kauffmann, G., 1995a, MNRAS, 274, 153 Kauffmann, G., 1995b, MNRAS, 274, 161 Kauffmann, G., 1995c, astro-ph/9502096 Kauffmann, G., Guiderdoni, B., White, S.D.M., 1994 MNRAS, 267, 981 Kauffmann, G., White, S.D.M., Guiderdoni, B., 1993, MNRAS, 264, 201 Lacey, C.., Silk, J., 1991, Astroph. J., 381 14 Lacey, C., Cole, S., 1993, MNRAS, 262, 627 Lacey, C.., Guiderdoni, B., Rocca-Volmerange, B., Silk, J., 1993, 402, 15 Larsen, R.B., 1975, MNRAS, 173, 671 Larson, R.B., Tinsley, B.M., Caldwell, C.N., 1980, Astroph. J., 237, 692 Lilly, S.J., Tress, L., Hammer, F., Crampton, D., Le F`evre, O., 1995, Astroph. J., in press Loveday, J., 1996, MNRAS, 278, 1025 Loveday, J., Maddox, S.J., Efstathiou, G., Peterson, B.A., 1995, Astroph. J., 442, 457 Loveday, J., Peterson, B.A., Efstathiou, G., Maddox, S.J., 1992, Astroph. J., 390, 338 McGaugh, S., 1994, Nature, 367, 538 Marzke, R.O., Huchra, J.P., Geller, M.J., 1994, Astroph. J., 428, 43 Mihos, J.C., Hernquist, L., 1994a, Astroph. J., 425, L13 Mihos, J.C., Hernquist, L., 1994b, Astroph. J., 431, L9 Moore, B., Frenk, C.S., White, S.D.M., 1993, MNRAS, 261, 827 Moore, B., Katz, N., Lake, G., Dressler, A., Oemler, A., 1995, Nature, in press Naim, A., Lahav, O., Buta, R.J., Corwin, H.G., de Vaucouleurs, G., Dressler, A., Huchra, J.P., van den Bergh, S., Raychaudhury, S., Sodre, L., StorrieLombardi, M.C., 1995, MNRAS, 274, 1107 Navarro, J.F., Frenk, C.S., White, S.D.M., 1995, MNRAS, 275, 56 Navarro, J.F., White, S.D.M., 1993, MNRAS, 265, 271 Negroponte, J., White, S.D.M., 1983, MNRAS, 205, 1009 Nolthenius, R., 1993, Astroph. J. Suppl., 85, 1 Ostriker, J.P., 1980, Comm. Astrophysics, 8, 177 Press, W.H., Schechter, P.L., 1974, Astroph. J., 187, 425 Rose, J.A., Tripicco, M.J., 1986, Astron. J., 92, 610
Sandage, A., Freeman, K.C., Stokes, N.R., 1970, Astroph. J., 160, 831 Schade, D., Lilly, S.J., Crampton, D., Hammer, F., Le F`evre, O., Tresse, L., 1995, Astroph. J., 451, L1 Schade, D., Lilly, S.J., Le F`evre, O., Hammer, F., Crampton, D., 1996, Astroph. J., in press Schweizer, F., Seitzer, P., 1992, Astron. J., 104, 1039 Simien, F., de Vaucouleurs, G., 1986, Astroph. J., 302, 564 Stanford, S.A., Eisenhardt, P.R.M., Dickinson, M., 1995, Astroph. J., 450, 512 Summers, F.J., Davis, M., Evrard, A., 1995, Astroph. J., 454, 1 Toomre, A., 1977 The Evolution of Galaxies and Stellar Populations, ed. B.M. Tinsley, R.B. Larsen, New Haven: Yale Univ. Press Walker, I.R., Mihos, J.C., Hernquist, L., 1995, astroph/9510052 White, S.D.M., Efstathiou, G., Frenk, C.S., 1993, MNRAS, 262, 1023 White, S.D.M., Frenk, C.S., 1991, Astroph. J., 379, 52 Whitmore, B.C., Gilmore, D.M., 1991, Astroph. J., , 367, 64 Whitmore, B.C., 1990 in Clusters of Galaxies eds. Oegerle, W.R., Fitchett, M.J., Danly, L., 139 Worthey, G., 1994, Astroph. J. Suppl., 95, 107