THE BALTIC JOURNAL OF ROAD AND BRIDGE ENGINEERING
2008 3(4): 206–216
EVOLUTION OF TRAFFIC FLOWS AND TRAFFIC-INDUCED AIR POLLUTION DUE TO STRUCTURAL CHANGES AND DEVELOPMENT DURING 1993–2006 IN TARTU (ESTONIA) Hans Orru1, 4, Marko Kaasik2, Dago Antov3, Bertil Forsberg4 1
Dept of Public Health, University of Tartu, Ravila 19, 50411 Tartu, Estonia, e-mail:
[email protected] 2 Institute of Physics, University of Tartu, Riia 4 51004 Tartu, Estonia, e-mail:
[email protected] 3 Tallinn Technical University, Ehitajate tee 5, 19086 Tallinn, Estonia, e-mail:
[email protected] 4 Dept of Public Health and Clinical Medicine, Umea University, 901 87 Umea, Sweden E-mail:
[email protected]
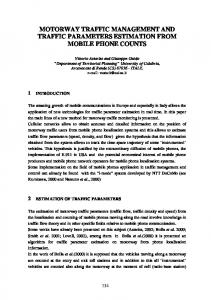
Abstract. Traffic is the main factor affecting air quality in most cities. After the Estonian re-independence in 1991, the increase of motorization has been fast and car usage has intensified. During the same period, the average age of cars has decreased and thanks to improvements in engine technology, the emissions per km have been reduced. The objective was to see how these factors have reflected in air quality. This paper also aim to present an analytical approach to estimate the air pollution levels in recent years, when air quality monitoring has not been conducted, and available traffic data are limited. Based on traffic counts in 25 points across the city the amounts of traffic were modelled for 680 street segments with CUBE software. As air quality is monitored irregularly in Tartu, dispersion modelling was used to estimate pollution levels. Annual concentrations of exhaust particles (PMexhaust), particulate matter (PM10) and nitrogen oxides (NOx) in 1993, 2000 and 2006 were calculated with AEROPOL software. The traffic increase in the city centre of Tartu was especially rapid in the 1990s. In recent years, it has slowed due to congestion. Overall, traffic levels have increased more than 3 times since 1993. In residential areas, the increase is still rapid – up to 6 times from 1993 to 2006. However, the changes in air quality are less dramatic. Increases from 1993 to 2000 were followed by stable or slightly increasing pollution levels in recent years, especially in case of PMexhaust. The study showed that 2 factors, namely, increase of traffic and improvement of vehicles, have been compensating each other in the dynamics of air pollution. Keywords: traffic, flow, modelling, air pollution, emission coefficient, exposure, health.
1. Introduction 2
Estonia, a country that covers 45 228 km with a population of just over 1.3 million, has been recognized as one of the fastest growing economies in the world in recent years. After re-independence in 1991, Estonia embarked on a dramatic and, so far, successful economic reform that has drawn significant amounts of foreign investment to the country. The increase of Estonian gross domestic product (GDP) has been more than 7% recently (Fabrizio et al. 2006). In many cases, the economic growth induces environmental degradation. In Estonia, the increase of traffic has been rapid, especially in cities. This is mainly the reason of fast motorization. In 1993, 317,400 cars were registered in Estonia, whereas in April 2008 there were already 533,852 car registrations. This trend has appeared despite the decrease of population. In addition, according to Tallinn Technical University research, cars are now used more often than before (Metsvahi, Eessalu 2007). The share of driven kilometres in urban areas has grown even faster than the kilometres driven on rural roads. ISSN 1822-427X print / ISSN 1822-4288 online http://www.bjrbe.vgtu.lt
According to European statistics, in 2004 there were on average 472 cars per 1000 inhabitants in the EU, while Estonia has reached 398 in 2008, when in 1990 there were only 154 registered cars according to the data of Estonian Motor Vehicle Registration Centre ARK (Eesti Riiklik Autoregistrikeskus). Annual increase in the number of newly registered cars per year has been even faster – from 24 242 (1999) to 60 626 (2005). While in 1996 only 19% of newly registered cars were brand new, in 2008 the percentage reached 32.4%. However, the average age of cars in ARK register has remained at 15 years. In 2006, 9% of them were less than 3 years old, 22% 3–10 years old and 70% more than 10 years old. Increasing traffic volumes have and will considerably increase total emissions of many air pollutants (Klimont et al. 2001). Only a few studies are available in developing countries, where traffic, air pollution and health trends are analysed complexly (Ebelt et al. 2001; Jorquera et al. 2004). Commonly, fixed ambient monitoring sites are used to describe the pollution of the whole city (Nerriere et al. DOI: 10.3846/1822-427X.2008.4.206-216
The Baltic Journal of Road and Bridge Engineering, 2008, 3(4): 206–216 2005). Such stations may report useful data on time-series, but cannot provide good information on the spatial variation within a city. Dispersion modelling can give much better imaging, especially for reconstruction of past air pollution data (Jerrett et al. 2005) and thus can be used for retrospective studies (Reungoat et al. 2005). Urban traffic is considered the main source of air pollutants in urban areas. It is an important task for regulators and urban development planners to keep the air pollution level below the limit value. Demands from stakeholders for better traffic control and planning as well as better air pollution management are becoming more visible. Colville et al. (2001) in their millennial review have drawn attention to the possibility of great increases in the number of car owners and use of cars and potentially severe air pollution problems in developing countries and Eastern Europe. In Czech Republic from 1988–1998 the number of car owners rose by 63% and in Prague by 93% (Pucher 1999). In Europe, following EU initiatives, the pollution emissions according Department of Trade and Industry (United Kingdom) from each car are now 1/20 of what they were 20 years ago. While the emissions of particulate matter (PM10) and nitrogen oxides (NOx) fell by 50% between 1990 and 2000, the decrease by year 2010 is expected to be 30%. For new vehicles, the Euro III and Euro IV emission standards were introduced in early 1999 and 2005, respectively. It is also confirmed that Euro V standards will be introduced in 2008 and a remarkable decrease of max pollution levels can be predicted. According to Genikhovich et al. (2005) in St. Petersburg (Russia) more than 80% of the total emissions of atmospheric pollutants are caused by motor vehicles. The gaseous and particulate air pollution as well as noise, smell and dust cause inconvenience and are responsible for a number of negative health effects. Above all, the human exposure to particulate matter in air pollution is of great concern. Fine particulate matter contains substances, including metals, acids, carbon, and polycyclic aromatic hydrocarbons. Some of these particles are emitted in vehicle exhaust, while others are formed in the atmosphere through chemical reactions between various pollutants found in exhaust. Their health relevance is indicated in numerous studies on associations between PM exposure and occurrence of acute respiratory illness, lung cancer and chronic respiratory and cardiovascular diseases as well as mortality (WHO 2005). Morgenstern et al. (2007) have found positive associations between traffic-related air pollutants and wheezing, cough without infection, dry cough at night, bronchial asthma, bronchitis and respiratory infections. This paper presents an analytical approach to estimate the air pollution levels in recent years, when air quality monitoring has not been conducted, and available traffic data have limitations. A goal is to achieve better facilities for exposure assessment when availability of measured data is limited. This paper also aims to increase knowledge of traffic and air pollution change in transitional countries, which can be extended to developing countries. The objective is to see if the 2 opposing factors – increase of traffic amount and improvement of vehicles can counterbalance each other?
207
2. Materials and methods 2.1. Study site Tartu, with its population of 101,000 inhabitants in an area of 38.8 km2, is the second largest city in Estonia, situated in North-Eastern Europe. The capacity of the street network remains limited considering the growing traffic, thus congestion is common. As a large number of cars are more than 10–20 years old, the combustion does not follow the optimal regime and exhaust gas emissions are higher than in Western Europe. As the result of fast economic growth the average age of cars has decreased, especially of the ones that are in everyday use and create most of the passenger kilometres. 2.2. Traffic data The traffic volumes have been regularly surveyed in Tartu from 1993 at 10 counting stations in town centre and 15 stations in the suburban residential area (Fig. 1). Traffic counting has been conducted at the end of Oct during the evening rush hours of a working day 4:30–5:30 PM. On other sites, the internationally well-known transportation analysis software package CUBE was used. The differences between real peak traffic and calculated peak traffic were corrected with the coefficients used for calculating the estimated rush hours traffic. There is a user interface for the entire CUBE system which provides interactive data input and analysis, GIS functionality via ArcGIS, model building and documentation, as well as scenario development and comparison.
Fig. 1. Traffic counting sites in Tartu study: – residential area
•
• – central town,
The model application for Tartu was used from the beginning of the analysed period. During the early 1990, there was scarce initial data on traffic and the application included only main streets and had 38 transport zones.
208
H. Orru et al. Evolution of traffic flows and traffic-induced air pollution due to structoral changes...
The years 1993, 2000 and 2006 were chosen for analysis. In 1993 and 2000, air pollution modelled levels rely on traffic data in 487 road sections. A significant upgrade of the application was made in 2002–2003, when a new correspondence OD (Origin-Destination) Matrix was introduced. The new OD Matrix data was based on special survey, which gathered data on distribution of residences and workplaces. There are 170 traffic zones in the new model application, and a number of secondary streets were added. After calibration with annual traffic counting data it was determined that the accuracy of the model lies in the range of 95%. In 2006 the traffic data was already available for 680 street links as well as a number of intersections. 2.3. Calculation of airborne concentrations Air pollution modelling was carried out for 1993, 2000 and 2006. For the exposure assessment three different pollutants were chosen based on human health concern: PM10, exhaust particles (PMexhaust) and NOx. It was considered that PMexhaust emitted from combustion processes are more potent in posing adverse health effects than those PM10 from non-combustion processes (Kaasik et al. 2001; Ostro et al. 2007). NOx was chosen because in a city environment nitrogen dioxide (NO2) and nitric oxide (NO) can transform each other quickly (mainly NO to NO2) in photochemical reactions with ozone and other gases. 2.3.1. Dispersion modelling The AEROPOL model relies on stationary Gaussian dispersion and enables use of point, line and area sources, takes into account both dry and wet deposition in estimating the concentrations and is also able to depict these in the output. The streets are modelled as linear sources (broken lines) and area sources as gridded areas. There are 2 options for how to treat the line sources (eg. streets) in AEROPOL code: (i) as line segments, applying analytical integration over segment length and (ii) splitting the line into point sources according to the output grid resolution (more accurate, but requires more computing time). The latter option with grid resolution 40 m was applied in this study. There are 2 options of meteorological data for each run: wind direction and speed at 10 m height above ground, cloud amount or wind direction and speed at 10 m and one more (user-defined) level net radiation flux at underlying surface. For both options the 2 m level temperature, date and time (dispersion parameters are estimated using the Pasquill stability classes) and precipitation amount is also included. The model has been applied for air quality modelling for Tartu previously and for other modelling studies and exercises as well (Kaasik 2001, 2003). 2.3.2. Calculation of pollution emission from vehicles As estimations of vehicle emission factors for Estonia are not available, the factors from other countries are used. As the composition of car fleet in 1993, 2000 and 2006 differed greatly, the model estimations were done using different emission algorithms.
The non-exhaust particulate matter (from road surface, tyres, brakes etc.) is estimated using the average for Stockholm, as calculated by Eneroth et al. (2006). Almost 90% of non-exhaust emissions originate from resuspension of particles from street surface. It appears that these emissions are roughly 10 times greater in northern countries, particularly because of use of studded tyres than engine exhaust emissions. In the following, emissions of exhaust and non-exhaust emissions together are considered as PM10. For 2000 and 2006, the emission estimation methodology used by Finnish Meteorological Institute was applied (Härkönen et al. 2001). The emissions per vehicle-km were calculated as was typical for Helsinki in 2000. Dependence on driving speed was considered. It was assumed (based on the age distribution of cars from the national vehicle register) that 20% in 2000 and 30% of cars in 2006 had catalytic converters. Percentage of cars with diesel engine was estimated to be 20% and 10% respectively. Emission estimations of NOx for 1993 is based on the recommended methodology by Norwegian Institute for Air Research (NILU) (Larssen 1984). A rough estimation of emissions of particulate matter from engines for Eastern Europe in these times is based on Kimmel (1998) study. The methodology does not perfectly consider possible improvement of diesel engines. Specific emissions of non-exhaust particles remain practically unchanged, because technical improvements in cars do not have much impact on these. However, very little is known about the nature of dominating emissions and resuspension from road pavement and site-to-site and seasonal variability. For calculating of concentrations, the wind rose (8 wind directions), average wind speeds, and other required meteorological annual data for Tartu are used. Average net radiation fluxes and wind speeds at 10 and 700 m height were taken to simulate the average dispersion conditions (subsec. 2.3.1, option 2 for meteorological data). 3. Results and discussion 3.1. Traffic flows The increase of traffic flows in Tartu during the study period in the measuring points (Fig. 1) has been rapid. In the beginning of the period under study, from 1993 to 1995, levels more than doubled (Fig. 2). The increase in residential areas (more than 6 times) has been even faster than in town centre over the analysed period (1993–2006). After the 1st very fast period of growth, than in town centre over the analysed period (1993–2006). After the 1st very fast period of growth, the increase in the town centre has been minor – recently about 5% a year. In some streets, it has even decreased. It reflects that congestions in smaller cities are intense and that they limit the traffic flows in bigger streets as well. Because the city centre is situated in a river valley, the bridges also limit the traffic flows crossing and car use within the city centre. As construction of a new bridge has started and another one is planned, some increase can be expected in the near future. Across yearly measurement points some tendencies appear. For instance, for points with a high increase, next
The Baltic Journal of Road and Bridge Engineering, 2008, 3(4): 206–216
209
Fig. 2. Change of traffic volume in Tartu compared to 1993 (evening rush hour).
year there is decrease or only a minor increase. Thus, on a small scale many processes are driven by typical redistribution of traffic flows. Especially rapid growth has taken place in suburban residential areas and neighbouring municipalities, causing the phenomena of urban sprawl. However, the majority of jobs remain in the city, forcing greater use of commuter cars, which is amplified by limited availability of public transportation. In addition, new consumer centres on the outer ring of town attract more car users to the edge of city. Analogous patterns of change in traffic volumes (rapid initial increase in town centre, followed by slow increase with fast increase in suburban residential areas) have been observed elsewhere as well, resulting in environmental and public health problems (WHO 2005). The traffic structure has been quite stable in recent years (approx 94% passenger cars, 3–4% heavy duty vehicles and 2–3% buses). Over the period, the proportion of passenger cars increased and the proportion of buses decreased. According to recent data of the measurement points, the busiest areas are 2 main street corridors and 2 large bridges (points 16, 22, 23), where traffic volume is more than 2000 vph (vehicles per hour) (Fig. 1). More than 1000 vehicles were measured also in points 1, 4, 5, 6, 7 (Fig. 1). Due to the relatively small size of the town centre and the limited capacity of key intersections, congestions are common. In the future, the traffic increase should slow down. Recently total traffic growth factors for Tartu compared to 2006 are 1.14 (1.23 1.09) for year 2010, for 2020 1.37 (1.591.19) and 1.55 (1.761.27) for 2030 (average, rapid, slow scenario). In growing economies, sharply increasing vehicle population is causing severe transportation and environmental problems, as can be seen, for example, in Beijing where it increases at an average annual rate of 14.5% (Hao et al. 2006). The traffic volumes are often widely measured worldwide, but continual analyses and modelling over a longer time-period are very rare and only locally available (Grigo-
nis, Paliulis 2007). The increase in the number of cars and a
more frequent use have caused significant social and environmental problems like roadway congestion, parking shortages, increased traffic accidents, air pollution, and noise. These processes are widely discussed and it seems unlikely that technological improvements alone can provide the solutions. 3.2. Air pollution levels and urban health concerns Overall air pollution trends in Tartu have been slightly increasing. Despite decreasing emission factors compared to 1993, the rapid rate of traffic increase has prevented overall improvement. This shows that improvement of cars in rapidly developing economies cannot compensate entirely the increase in number of vehicles, resulting in a decline of air quality. This can be seen especially in common streets where there has been more space for increasing the traffic volume. Differences in the trends between the analysed pollutants NOX, PM10 and PMexhaust can be noticed. In general, the biggest variation over time can be seen for PMexhaust (Fig. 3). During the 1st study period (1993– 2000), the concentration decreased dramatically according to the model. Yet, during the 2nd study period (2000– 2006) it has increased. The reason is that the “Soviet” cars were mostly replaced in 1st period, but then the traffic increase continued and theimprovements in technology were not so dramatic. In the case of PM10, the trend is much smaller, because most of emissions are composed of brake and especially road dust, as well as a use of studded tyres (Hääl, Sürje 2006). This is an essential health problem in Northern Europe (Brunekreef, Forsberg 2005). The concentration of traffic-induced PM10 increased over the whole period (1993–2006) (Fig. 4). Even though the PMexhaust component decreased in 1st period, that tendency is not reflected in general results due to a small fraction of PMexhaust in total mass. The concentration of NOx is related to the use of catalysers. In 1993 almost no cars had catalysers and in 2000 there were still quite few. Only now, they are becom-
210
H. Orru et al. Evolution of traffic flows and traffic-induced air pollution due to structoral changes...
Fig. 3. Annual concentration of PMexhaust, μg/m3
Fig. 4. Annual concentration of PM10, μg/m3
Fig. 5. Annual concentration of NOX, μg/m3
ing more common. Nevertheless, as traffic volume has increased, the positive effect has been overridden. However, the concentration has increased in some areas and decreased in some streets (Fig. 5). However, there can be some bias in modelling results because the newer cars are typically more widely used in Estonia, especially the cars less than 5 years old are driven 3 times more km/year compared with cars over 20 years old. So the concentrations may be somewhat overestimated for 2006. Many more changes are seen at a local scale (Figs 3–5). It can be clearly seen that in some streets the max levels of vehicles were already exceeded in 2000. In these sites, the
air quality has even improved slightly because of reduction of emissions per vehicle. Still these sites have the highest air pollution levels. In residential areas, the traffic-induced air pollution levels during the study period more than doubled. In some cases, especially near the streets, the increase was even bigger. That also indicates that exposure to air pollution of people living there is much greater. High concentration can also be seen in a small residential region with 2 or 3-storeyed apartment houses near city centre. As Tartu does not have a proper ring road and main streets are congested, some vehicles go through this region. Furthermore, these
The Baltic Journal of Road and Bridge Engineering, 2008, 3(4): 206–216 houses are mostly heated with wood stoves that can raise the air pollution concentrations even higher. According to the yearly monitoring made in Tartu from 1995 to 1999, the ambient level of NO2 increased by 50% to 100% in several areas (Kimmel, Kaasik 2003). That is in fair agreement with our results in the case of NOx, where an increase from 1993 to 2000 can be noticed at some sites in the city centre (Fig. 5). To date, few studies have been made about trafficrelated air pollution trends but there are some that allow for comparison. Based on review article by Han and Naeher (2006), the air quality in Tartu is generally better than in more than 15 other developing and Eastern European countries included in their meta-analysis. Compared to many other European countries, the air quality in Tartu should be improved (Danielis 2006). However, the Cesar study showed that air quality in cities of Eastern Europe can be very poor (Houthuijs et al. 2001). It is worrying that in many places in Tartu the air quality worsened during the study period. Besides direct exhaust air pollution, health is affected by many other factors such as particles from brake, tyre, and road wear particles, traffic noise, psychological stress, and spatial gradients in socio-economic status. The domestic heating, which is widely used in Tartu, makes situation even worsen. Many questions concerning interpretation of the results could arise, related to choice of emission inventory methods in particular. Peace et al. (2004) have clearly indicated the uncertainties of road traffic emission factors: cold starts and minor roads, modelled as other sources; uncertainty of the emissions input data; lack of ideal range and depth of activity data required, eg. modelled traffic flows; uncertainty of meteorological data; model performance and the inherent uncertainties of the dispersion process itself. However, the emission factor is an important contributor to the uncertainty in estimates of emissions in the past and the biases are usually bigger at roadside sites (Peace et al. 2004; Schöpp et al. 2005). Several uncertainties can also arise concerning health effects of particles – their mass concentration could decrease, but the number concentration increased and they could be more toxic as well. The relationship between pollution level and probability of health effects can seldom be well described by linear or quadratic terms, because the health effects are complicated (Wilson et al. 2004). As the level of PMexhaust increases in some sites, more negative health consequences can be predicted there (Fig. 3). 4. Conclusions This analysis reflects quite directly that to improve the air quality, we cannot rely only on reduction in emissions per vehicle-kilometre through improvement of vehicles. To reduce air pollution, we have to decrease the traffic volumes through traffic planning as well. Thus, the 2 opposing factors – increase of traffic flows and improvement of vehicles cannot perfectly counterbal-
211
ance each other in rapidly developing economies. That can result in worsening air quality. Though decrease of PMexhaust was detectable in 19932000, it increased again in 2nd period (2000–2006). PM10 pollution, originating in Northern Europe mainly from road abrasion and thus, not depending much on technical development of cars, is even more problematic issue. As NOX is largely related to use of catalytic converters (nowadays extensively used), no increase could be seen. The used retrospective modelling approach could be quite easily applied when traffic data but no air pollution monitoring data (or sparse monitoring network) is available. It helps to see also the trends in traffic density and air pollution over longer periods. Nowadays the traffic models can provide reliable traffic flows even with very few measurement sites. The application of air pollution modelling can give a broader picture of environmental health concerns related to urban traffic. Acknowledgements The traffic measurements were made with financial support by Tartu City Government. Authors want to thank the staff of Stratum OÜ for traffic measurements and Department of Communal Services in Tartu City Government for the kind assistance. References Brunekreef, B.; Forsberg, B. 2005. Epidemiological evidence of effects of coarse airborne particles on health, European Respiratory Journal 26(2): 309–318. Colvile, R. N.; Hutchinson, E. J.; Mindell, J. S.; Warren, R. F. 2001. The transport sector as a source of air pollution, Atmospheric Environment 35(9): 1537–1565. Danielis, R. 2006. Air pollution and road transport in Europe. A cluster and a regression analysis among countries and cities, working paper No. 105 [on-line], Università degli Studi di Trieste, Dipartamento di Scienze Economiche e Statistiche [cited 11 Feb, 2008]. Available from Internet: . Ebelt, S.; Brauer, M.; Cyrys, J.; Tuch, T.; Kreyling, W. G.; Wichmann, H. E.; Heinrich, J. 2001. Air quality in postunification Erfurt, East Germany: associating changes in pollutant concentrations with changes in emissions, Environmental Health Perspectives 109(4): 325–333. Eneroth, K.; Johansson, C.; Bellander, T. 2006. Exposure comparison between measurements and calculations based on dispersion modelling. Stockholm: Stockholms och Uppsala Läns Luftvårsförbund. 23 p. Fabrizio, S.; Igan, D.; Mody, A.; Tamirisa, N. 2006. Export structure and credit growth, IMF Country Report No. 06/414 [online], International Monetary Fund, Washington DC, USA [cited 11 Febr, 2008]. Available from Internet: . Genikhovich, E. L.; Ziv, A. D.; Iakovleva, E. A.; Palmgren, F.; Berkowicz, R. 2005. Joint analysis of air pollution in street canyons in St. Petersburg and Copenhagen, Atmospheric Environment 39(15): 2747–2757. Grigonis, V.; Paliulis, G. M. 2007. Modelling the transport flows in Marijampolė (Lithuania), The Baltic Journal of Road and Bridge Engineering 2(1): 29–37.
212
H. Orru et al. Evolution of traffic flows and traffic-induced air pollution due to structoral changes...
Han, X.; Naeher, L. P. 2006. A review of traffic-related air pollution exposure assessment studies in the developing world, Environment International 32(1): 106–120. Hao, J.; Hu, J.; Fu, L. 2006. Controlling vehicular emissions in Beijing during the last decade, Transportation Research Part A: Policy and Practice 40(8): 639–651. Härkönen, J.; Nikmo, J.; Karppinen, A.; Kukkonen, J. 2001. A refined modelling system for estimating the emissions, dispersion, chemical transformation and dry deposition of traffic-originated pollution from a road, in Proc of the 7th International Conference on Harmonisation within Atmospheric Dispersion Modelling for Regulatory Purposes. Ed. by Cuvelier, C., et. al. 28–31 May, 2001, Belgirate, Italy, Ispra: Joint Research Centre, European Commission 311–313. Hääl, M.-L.; Sürje, P. 2006. Environmental problems related to winter traffic safety conditions, The Baltic Journal of Road and Bridge Engineering 1(1): 45–53. Houthuijs, D.; Breugelmans, O.; Hoek, G.; Vaskövi, E.; Mihalikova, E.; Pastuszka, J. S.; Jirik, V.; Sachelarescu, S.; Lolova, D.; Meliefste, K.; Uzunova, E.; Marinescu, C.; Volf, J.; De Leeuw, F.; Van de Wiel, H.; Fletcher, T.; Lebret, E.; Brunekreef, B. 2001. PM10 and PM2.5 concentrations in Central and Eastern Europe: results from the Cesar study, Atmospheric Environment 35(15): 2757–2771. Jerrett, M.; Arain, A.; Kanaroglou, P.; Beckerman, B.; Potoglou, D.; Sahsuvaroglu, T.; Morrison, J.; Giovis, C. 2005. A review and evaluation of intra-urban air pollution exposure models, Jour nal of Exposure Analysis and Environmental Epidemiology 15(2): 185–204. Jorquera, H.; Orrego, G.; Castro, J.; Vesovic, V. 2004. Trends in air quality and population exposure in Santiago, Chile, 1989– 2001, International Journal of Environment and Pollution 22(4): 507–530. Kaasik, M.; Kimmel, V. 2003. Validation of the improved AEROPOL model against the Copenhagen data set, International Journal of Environment and Pollution 20(1–6): 114–120. Kaasik, M.; Kimmel, V.; Kaasik, H. 2001. Air quality modelling system for a medium-sized town: a case study in Estonia, International Journal of Environment and Pollution 16(1–6): 519–527. Kimmel, V. 1998. Changes in air emissions in Estonia due to economic transition, Master thesis, Central European University, Budapest, Hungary, 31 p. Kimmel, V.; Kaasik, M. 2003. Assessment of urban air quality in south Estonia by simple measures, Environmental Modelling and Assessment 8(1): 47–53. Klimont, Z.; Cofala, J.; Schöpp, W.; Amann, M.; Streets, D. G.; Ichikawa, Y.; Fujita, S. 2001. Projections of SO2, NOX, NH3 and VOC emissions in East Asia up to 2030, Water, Air and Soil Pollution 130(1–4): 193–198.
Laden, F.; Neas, L. M.; Dockery, D. W.; Schwartz, J. 2000. Association of fine particulate matter from different sources with daily mortality in six U.S. cities, Environmental Health Perspectives 108(10): 941–947. Larsen, S. 1984. Nordisk beräkningsmetode for bilavgasser, project NILU 0-8216 [Nordic Modelling Methods for Exhaust Gassess]. Lillestrom: NILU. Metsvahi, T; Eessalu, A. 2007. Autopargi läbisõit Eestis 2006. aastal [Kilometrage of vehicles in 2006 in Estonia]. Tallinn: Tallinn Technical University, 134 p. Morgenstern, V.; Zutavern, A.; Cyrys, J.; Brockow, I.; Gehring, U.; Koletzko, S.; Bauer, C. P.; Reinhardt, D.; Wichmann, H. E.; Heinrich, J. 2007. Respiratory health and individual estimated exposure to traffic-related air pollutants in a cohort of young children, Occupational Environmental Medicine 64: 8–16. Nerriere, É.; Zmirou-Navier, D.; Blanchard, O.; Momas, I.; Ladner, J.; Le Moullec, Y.; Personnaz, M. B.; Lameloise, P.; Delmas, V.; Target, A.; Desqueyroux, H. 2005. Can we use fixed ambient next term air monitors to estimate population long-term exposure to air pollutants? The case of spatial variability in the Genotox ER study, Environmental Research 97(1): 32–42. Ostro, B.; Feng, W. Y.; Broadwin, R.; Green, S.; Lipsett, M. 2007. The effects of components of fine particulate air pollution on mortality in California: results from CALFINE, Environmental Health Perspectives 115(1): 13–19. Peace, H.; Owen, B.; Raper, D. W. 2004. Comparison of road traffic emission factors and testing by comparison of modelled and measured ambient air quality data, The Science of the Total Environment 334–335: 385–395. Pucher, J. 1999. The transformation of urban transport in the Czech Republic, 1988–1998, Transport Policy 6(4): 225–236. Reungoat, P.; Chiron, M.; Gauvin, S.; Zmirou-Navier, D.; Momas, I. 2005. Retrospective assessment of exposure to traffic air pollution using the ExTra index in the VESTA French epidemiological study, Journal of Exposure Analysis and Environmental Epidemiology 15(6): 524–533. Schöpp, W.; Klimont, Z.; Suutari, R.; Cofala, J. 2005. Uncertainty analysis of emission estimates in the RAINS integrated assessment model, Environmental Science & Policy 8(6): 601–613. Wilson, A. M.; Salloway, J. C.; Wake, C. P.; Kelly, T. 2004. Air pollution and the demand for hospital services: a review, Environment International 30(8): 1109–1118. World Health Organization (WHO) 2005. Health effects of transport-related air pollution. Ed. by Krzyzanowski, M.; KunaDibbert, B.; Schneider, J. [cited 11 Febr, 2008]. Bonn: WHO/ Euro, 205 p. ISBN 92-890-1373-7. Available from Internet: . Received 13 March, 2008; accepted