Jun 8, 2017 - multitasking in permutation-based combinatorial optimization problems: Realization with TSP, QAP, LOP, and JSP.â in Proceedings of IEEE.
Evolutionary Multitasking for Multiobjective Continuous Optimization: Benchmark Problems, Performance Metrics and Baseline Results Yuan Yuan∗ , Yew-Soon Ong∗ , Liang Feng† , A.K. Qin‡ , Abhishek Gupta∗ , Bingshui Da∗ , Qingfu Zhang§ , Kay Chen Tan¶ , Yaochu Jink , and Hisao Ishibuchi∗∗
arXiv:1706.02766v1 [cs.NE] 8 Jun 2017
∗
School of Computer Science and Engineering, Nanyang Technological University, Singapore † College of Computer Science, Chongqing University, China ‡ School of Science, RMIT University, Australia § Department of Computer Science, City University of Hong Kong, Hong Kong ¶ Department of Electrical and Computer Engineering, National University of Singapore, Singapore k Department of Computer Science, University of Surrey, United Kingdom ∗∗ Department of Computer Science and Intelligent Systems, Osaka Prefecture University, Japan Technical Report
I. I NTRODUCTION With the explosion in the variety and volume of incoming information streams, it is very desirable that the intelligent systems or algorithms are capable of efficient multitasking. The evolutionary algorithms (EAs) are a kind of populationbased search algorithms, which have the inherent ability to handle multiple optimization tasks at once. By exploiting this characteristic of EAs, evolutionary multitasking [1], [2] has become a new paradigm in evolutionary computation (EC), which signifies a multitasking search involving multiple optimization tasks at a time, with each task contributing a unique factor influencing the evolution of a single population of individuals. The first tutorial on evolutionary multitasking (“Evolutionary Multitasking and Implications for Cloud Computing”) was presented in IEEE Congress on Evolutionary Computation (CEC) 2015, Sendai, Japan. Since then, a series of studies on this topic have been conducted from various perspectives, which not only show the potentials of evolutionary multitasking [3]–[8] but also explain why this paradigm works [9], [10] to some extent. Evolutionary multiobjective optimization (EMO) [11]–[13] has always been a popular topic in the field of EC over the past 20 years. The reason mainly lies in the following two aspects. On the one hand, many optimization problems in real-world applications can be formulated as multiobjective optimization problems (MOPs) in essence. On the other hand, EAs are able to approximate the whole Pareto set (PS) or Pareto front (PF) of a MOP in a single run due to the population-based nature, which are regarded as quite suitable for solving MOPs. Until now, plenty of EMO techniques have been developed, and they can be roughly classified into three categories: Pareto dominance-based algorithms [14]–[16], decomposition-based algorithms [17]–[20], and indicator-based algorithms [21]– [23].
Since evolutionary multitasking has shown promise in solving multiple tasks simultaneously and EMO is one of the focused topics in EC, there may be noteworthy implications of understanding the behavior of algorithms at the intersection of the two paradigms. The combination of the two different paradigms is referred to herein as multiobjective multifactorial optimization (MO-MFO), which means that a number of multiobjective optimization tasks are solved simultaneously by evolving a single population of individuals using EAs. MOMFO has been first discussed in [4], where proof of concept results from two synthetic benchmarks and a real-world case study were presented. In this report, we suggest nine test problems for MO-MFO, each of which consists of two multiobjective optimization tasks that need to be solved simultaneously. The relationship between tasks varies between different test problems, which would be helpful to have a comprehensive evaluation of the MO-MFO algorithms. It is expected that the proposed test problems will germinate progress the field of the MO-MFO research. The rest of this report is outlined as follows. Section II presents the definitions of the proposed test problems. Section III describes how to evaluate the performance of the algorithm on the test problems. Section IV provides the baseline results obtained by a MO-MFO algorithm (i.e., MO-MFEA [4]) and its underlying basic MOEA (i.e., NSGA-II [16]) on the proposed benchmark problems. II. D EFINITIONS OF B ENCHMARK P ROBLEMS In the previous studies on evolutionary (single-objective) multitasking [1], [2], [9], it is found that the degree of the intersection of the global optima and the similarity in the fitness landscape are two important ingredients that lead to the complementarity between different optimization tasks. Motivated by this, the characteristics of multiobjective optimization
tasks in the test problems to be presented are focused on the q(x) function, and the relationship between two multiobjective optimization tasks in a test problem can be translated into the relationship between their respective q(x) functions, which is based on the fact that the Pareto optimal solutions of a multiobjective task are achieved iff. its corresponding q(x) reaches the global minimum. Suppose that x∗1 and x∗2 are the global minima of q(x) functions in the two multiobjective tasks T1 and T2 , respectively. Each dimension of x∗1 and x∗2 is then normalized to the same range [0, 1], obtaining x ¯∗1 and x ¯∗2 . If x ¯∗1 = x ¯∗2 , we say that the global minima are complete intersection; if there exists no ¯∗2 are equal, we call dimension where the values of x ¯∗1 and x that no intersection; all the other relationships between x ¯∗1 and x ¯∗2 are referred to as partial intersection. For computing the similarity between the fitness landscape of q(x) functions, 1,000,000 points are randomly sampled in the unified search space [1], then the Spearman’s rank correlation coefficient between q(x) is calculated as the similarity. The similarity lying in (0, 1/3], (1/3, 2/3], (2/3, 1] is regarded as high, medium, and low, respectively. We consider three degrees of the intersection of the global minima, i.e., complete, partial and no intersection, and within each category, three categories of similarity in the fitness landscape, i.e., high, medium, and low similarity. Accordingly, there are nine test problems in total. Note that many practical settings give rise to a third condition for categorizing potential multitask optimization settings, namely, based on the phenotypic overlap of the decision variables [2]. To elaborate, a pair of variables from distinct tasks may bear the same semantic (or contextual) meaning, which leads to the scope of knowledge transfer between them. However, due to the lack of substantial contextual meaning in the case of synthetic benchmark functions, such a condition for describing the similarity/overlap between tasks is not applied in this technical report. The definitions of the proposed test problems are described in detail as follows. Note that there are five shift vectors (scm2 , sph2 , spm1 , spl2 , snl1 ) and four rotation matrixes (Mcm2 , Mpm1 , Mpm2 , Mnm2 ) involved, whose data can be available online1 : 1) Complete Intersection with High Similarity (CIHS) The first multiobjective task T1 is defined as follows: πx1 ), 2 πx1 min f2 (x) = q(x) sin( ), 2 n X q(x) = 1 + x2i , min f1 (x) = q(x) cos(
The second multiobjective task T2 is defined as follows: min f1 (x) = x1 , min f2 (x) = q(x)(1 − (
x1 2 ) ), q(x)
n
q(x) = 1 +
9 X |xi | n − 1 i=2
x1 ∈ [0, 1], xi ∈ [−100, 100], i = 2, 3, . . . , n For this test problem, the number of decision variables n is set to 50 for both T1 and T2 , and the similarity between T1 and T2 is 0.97. The PS and PF of T1 are given as follows: P S : x1 ∈ [0, 1], xi = 0, i = 2, 3, . . . , 50 P F : f12 + f22 = 1, f1 ≥ 0, f2 ≥ 0
i=2
x1 ∈ [0, 1], xi ∈ [−100, 100], i = 2, 3, . . . , n 1 The data of rotation matrixes and shift vectors in the test problems can be downloaded from https://drive.google.com/open?id=0B8WAZ9HjQsUSdUY5UzBLN0NPd2M.
(3)
The PS and PF of T2 are given as follows: P S : x1 ∈ [0, 1], xi = 0, i = 2, 3, . . . , 50 P F : f2 = 1 − f12 , 0 ≤ f1 ≤ 1
(4)
2) Complete Intersection with Medium Similarity (CIMS) The first multiobjective task T1 is defined as follows: min f1 (x) = x1 , min f2 (x) = q(x)(1 − ( q(x) = 1 +
x1 2 ) ), q(x)
n−1 X
(5)
(100(x2i − xi+1 )2 + (1 − xi )2 ),
i=2
x1 ∈ [0, 1], xi ∈ [−5, 5], i = 2, 3, . . . , n The second multiobjective task T2 is defined as follows: πx1 ), 2 πx1 min f2 (x) = q(x) sin( ), 2 n 9 X q(x) = 1 + |zi |, n − 1 i=2 min f1 (x) = q(x) cos(
(6)
(z2 , z3 , . . . zn )T = Mcm2 ((x2 , x3 , . . . , xn )T − scm2 ), x1 ∈ [0, 1], xi ∈ [−5, 5], i = 2, 3, . . . , n For this test problem, the number of decision variables n is set to 10 for both T1 and T2 , and the similarity between T1 and T2 is 0.52. The PS and PF of T1 are given as follows: P S : x1 ∈ [0, 1], xi = 1, i = 2, 3, . . . , 10
(1)
(2)
P F : f2 = 1 − f12 , 0 ≤ f1 ≤ 1
(7)
The PS and PF of T2 are given as follows: P S : x1 ∈ [0, 1], (x2 , x3 , . . . , x10 )T = scm2 P F : f12 + f22 = 1, f1 ≥ 0, f2 ≥ 0
(8)
3) Complete Intersection with Low Similarity (CILS)
The first multiobjective task T1 is defined as follows: πx1 ), 2 πx1 min f2 (x) = q(x) sin( ), 2 n X q(x) = 1 + (x2i − 10 cos(2πxi ) + 10)
For this test problem, the number of decision variables n is set to 50 for both T1 and T2 , and the similarity between T1 and T2 is 0.99. The PS and PF of T1 are given as follows:
min f1 (x) = q(x) cos(
(9)
P S : x1 ∈ [0, 1], xi = 0, i = 2, 3, . . . , 50 p P F : f2 = 1 − f1 , 0 ≤ f1 ≤ 1
(15)
The PS and PF of T2 are given as follows:
i=2
x1 ∈ [0, 1], xi ∈ [−2, 2], i = 2, 3, . . . , n The second multiobjective task T2 is defined as follows:
P S : x1 ∈ [0, 1], (x2 , x3 , . . . , x50 )T = sph2 p P F : f2 = 1 − f1 , 0 ≤ f1 ≤ 1
(16)
min f1 (x) = x1 , r
x1 ), q(x) v u n u 1 X t x2 ) q(x) = 21 + e − 20exp(−0.2 n − 1 i=2 i min f2 (x) = q(x)(1 −
(10)
n
− exp(
1 X cos(2πxi )) n − 1 i=2
i=2 (z2 , z3 , . . . zn )T
x1 ∈ [0, 1], xi ∈ [−1, 1], i = 2, 3, . . . , n For this test problem, the number of decision variables n is set to 50 for both T1 and T2 , and the similarity between T1 and T2 is 0.07. The PS and PF of T1 are given as follows: P S : x1 ∈ [0, 1], xi = 0, i = 2, 3, . . . , 50 P F : f12 + f22 = 1, f1 ≥ 0, f2 ≥ 0
(11)
q(x) = 1 +
The second multiobjective task T2 is defined as follows:
min f2 (x) = q(x)(1 − ( n X
x1 2 ) ), q(x)
(zi2 − 10 cos(2πzi ) + 10),
(z2 , z3 , . . . zn )T = Mpm2 (x2 , x3 , . . . , xn )T , xi ∈ [0, 1], i = 1, 2, 3, . . . , n For this test problem, the number of decision variables n is set to 50 for both T1 and T2 , and the similarity between T1 and T2 is 0.55. The PS and PF of T1 are given as follows: P S : x1 ∈ [0, 1], (x2 , x3 , . . . , x50 )T = spm1
r
(18)
i=2
(12)
min f1 (x) = x1 ,
n X
xi ∈ [0, 1], i = 1, 2, 3, . . . , n
q(x) = 1 +
4) Partial Intersection with High Similarity (PIHS) The first multiobjective task T1 is defined as follows:
min f2 (x) = q(x)(1 −
= Mpm1 ((x2 , x3 , . . . , xn )T − spm1 ),
min f1 (x) = x1 ,
The PS and PF of T2 are given as follows: P S : x1 ∈ [0, 1], xi = 0, i = 2, 3, . . . , 50 p P F : f2 = 1 − f1 , 0 ≤ f1 ≤ 1
5) Partial Intersection with Medium Similarity (PIMS) The first multiobjective task T1 is defined as follows: πx1 min f1 (x) = q(x) cos( ), 2 πx1 min f2 (x) = q(x) sin( ), 2 n X (17) q(x) = 1 + zi2
P F : f12 + f22 = 1, f1 ≥ 0, f2 ≥ 0
x1 ), q(x) (13)
The PS and PF of T2 are given as follows: P S : x1 ∈ [0, 1], xi = 0, i = 2, 3, . . . , 50
x2i ,
P F : f2 = 1 − f12 , 0 ≤ f1 ≤ 1
i=2
(19)
(20)
x1 ∈ [0, 1], xi ∈ [−100, 100], i = 2, 3, . . . , n The second multiobjective task T2 is defined as follows: min f1 (x) = x1 , min f2 (x) = q(x)(1 − q(x) = 1 +
r
x1 ), q(x)
n X (zi2 − 10 cos(2πzi ) + 10), i=2
(z2 , z3 , . . . zn )T = (x2 , x3 , . . . , xn )T − sph2 , x1 ∈ [0, 1], xi ∈ [−100, 100], i = 2, 3, . . . , n
(14)
6) Partial Intersection with Low Similarity (PILS) The first multiobjective task T1 is defined as follows: πx1 min f1 (x) = q(x) cos( ), 2 πx1 min f2 (x) = q(x) sin( ), 2 (21) n n 1 X 2 Y xi q(x) = 2 + xi − cos ( √ ) 4000 i=2 i−1 i=2 x1 ∈ [0, 1], xi ∈ [−50, 50], i = 2, 3, . . . , n
The second multiobjective task T2 is defined as follows: πx1 min f1 (x) = q(x) cos( ), 2 πx1 min f2 (x) = q(x) sin( ), 2 v u n u 1 X z2) q(x) = 21 + e − 20exp(−0.2t n − 1 i=2 i (22) n
1 X − exp( cos(2πzi )) n − 1 i=2
For this test problem, the number of decision variables n is set to 50 for both T1 and T2 , and the similarity between T1 and T2 is 0.002. The PS and PF of T1 are given as follows: (23)
The PS and PF of T2 are given as follows: P S : x1 ∈ [0, 1], (x2 , x3 , . . . , x50 )T = spl2 P F : f12 + f22 = 1, f1 ≥ 0, f2 ≥ 0
(29)
x1 ∈ [0, 1], x2 ∈ [0, 1], xi ∈ [−20, 20], i = 3, 4, . . . , n
x1 ∈ [0, 1], xi ∈ [−100, 100], i = 2, 3, . . . , n
P F : f12 + f22 = 1, f1 ≥ 0, f2 ≥ 0
πx1 πx2 ) cos( ), 2 2 πx1 πx2 min f2 (x) = q(x) cos( ) sin( ), 2 2 πx1 min f3 (x) = q(x) sin( ), 2 n−1 X q(x) = 1 + (100(x2i − xi+1 )2 + (1 − xi )2 ), min f1 (x) = q(x) cos(
i=3
(z2 , z3 , . . . zn )T = (x2 , x3 , . . . , xn )T − spl2 ,
P S : x1 ∈ [0, 1], xi = 0, i = 2, 3, . . . , 50
8) No Intersection with Medium Similarity (NIMS) The first multiobjective task T1 is defined as follows:
(24)
The second multiobjective task T2 is defined as follows: 1 (x1 + x2 ), 2 x1 + x2 2 ) ), min f2 (x) = q(x)(1 − ( 2 · q(x) n X q(x) = 1 + zi2 min f1 (x) =
(30)
i=3
(z3 , z4 , . . . zn )T = Mnm2 (x3 , x4 , . . . , xn )T , x1 ∈ [0, 1], x2 ∈ [0, 1], xi ∈ [−20, 20], i = 3, 4, . . . , n
7) No Intersection with High Similarity (NIHS) The first multiobjective task T1 is defined as follows: πx1 ), min f1 (x) = q(x) cos( 2 πx1 min f2 (x) = q(x) sin( ), 2 (25) n−1 X 2 2 2 (100(xi − xi+1 ) + (1 − xi ) ), q(x) = 1 + i=2
For this test problem, the number of decision variables n is set to 20 for both T1 and T2 , and the similarity between T1 and T2 is 0.51. The PS and PF of T1 are given as follows: P S : x1 ∈ [0, 1], x2 ∈ [0, 1], xi = 1, i = 3, 4, . . . , 20 P F : f12 + f22 + f32 = 1, f1 ≥ 0, f2 ≥ 0, f3 ≥ 0
(31)
xi ∈ [0, 1], xi ∈ [−80, 80], i = 2, 3, . . . , n The second multiobjective task T2 is defined as follows: min f1 (x) = x1 , min f2 (x) = q(x)(1 − q(x) = 1 +
n X
r
The PS and PF of T2 are given as follows: P S : x1 ∈ [0, 1], x2 ∈ [0, 1], xi = 0, i = 3, 4, . . . , 20
x1 ), q(x)
P F : f2 = 1 − f12 , 0 ≤ f1 ≤ 1
(32)
(26) x2i ,
i=2
x1 ∈ [0, 1], xi ∈ [−80, 80], i = 2, 3, . . . , n For this test problem, the number of decision variables n is set to 50 for both T1 and T2 , and the similarity between T1 and T2 is 0.94. The PS and PF of T1 are given as follows: P S : x1 ∈ [0, 1], xi = 1, i = 2, 3, . . . , 50 P F : f12 + f22 = 1, f1 ≥ 0, f2 ≥ 0
(27)
The PS and PF of T2 are given as follows: P S : x1 ∈ [0, 1], xi = 0, i = 2, 3, . . . , 50 p P F : f2 = 1 − f1 , 0 ≤ f1 ≤ 1
(28)
9) No Intersection with Low Similarity (NILS) The first multiobjective task T1 is defined as follows: πx2 πx1 ) cos( ), 2 2 πx1 πx2 min f2 (x) = q(x) cos( ) sin( ), 2 2 πx1 min f3 (x) = q(x) sin( ), 2 n n 1 X 2 Y zi q(x) = 2 + zi − cos ( √ ) 4000 i=3 i −2 i=3 min f1 (x) = q(x) cos(
(z3 , z4 , . . . zn )T = (x3 , x4 , . . . , xn )T − snl1 , x1 ∈ [0, 1], x2 ∈ [0, 1], xi ∈ [−50, 50], i = 3, 4, . . . , n
(33)
The second multiobjective task T2 is defined as follows: 1 (x1 + x2 ), 2 x1 + x2 2 min f2 (x) = q(x)(1 − ( ) ), 2 · q(x) v u n u 1 X q(x) = 21 + e − 20exp(−0.2t x2 ) n − 2 i=3 i min f1 (x) =
A. Performance Metric
n
− exp(
1 X cos(2πxi )) n − 2 i=3
x1 ∈ [0, 1], x2 ∈ [0, 1], xi ∈ [−100, 100], i = 3, 4, . . . , n (34) For this test problem, the number of decision variables n is set to 25 for T1 and 50 for T2 , and the similarity between T1 and T2 is 0.001. The PS and PF of T1 are given as follows: T
P S : x1 ∈ [0, 1], x2 ∈ [0, 1], (x3 , x4 , . . . , x25 ) = snl1
(35)
P F : f12 + f22 + f32 = 1, f1 ≥ 0, f2 ≥ 0, f3 ≥ 0 The PS and PF of T2 are given as follows: P S : x1 ∈ [0, 1], x2 ∈ [0, 1], xi = 0, i = 3, 4, . . . , 50
(36)
P F : f2 = 1 − f12 , 0 ≤ f1 ≤ 1
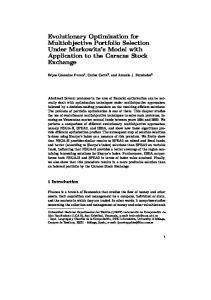
Table I summarizes the proposed test problems together with their properties, where sim(T1 , T2 ) denotes the similarity between two tasks in a test problem. Fig. 1 shows four kinds of the Pareto fronts of the multiobjective optimization tasks in the test problems. �� � � �
1
� �� � � � �� � �
�� � � � ��� � � � �� � �
1
0.6
0.6
��
0.8
��
0.8
0.4
0.4
0.2
0.2
0
0 0
1
0.2
0.4
0.6
0.8
1
0
0.2
0.4
0.6
problems. All the test problems should be treated as black-box problems, i.e., the analytic forms of these problems are not known for the algorithms.
0.8
1
��
��
��� � ��� � �� �� � �� �� � �
��� � ��� � ��� � �� �� � �� �� � �� �� � �
The inverted generational distance (IGD) [24] is used to evaluate the performance of an algorithm on each task of the considered test problem. Let A be a set of nondominated objective vectors that are obtained for a task Ti by the algorithm, and P ∗ be a set of uniformly distributed objective vectors over the PF of Ti . A and P ∗ are first normalized using the maximum and minimum objective values among P ∗ , then the metric IGD of the approximate set A is calculated as: sX 1 (min d(x, y))2 (37) IGD(A, P ∗ ) = ∗ y∈A |P | ∗ x∈P
where d(x, y) is the Euclidean distance between x and y in the normalized objective space. If |P ∗ | is large enough to represent the PF, the IGD(A, P ∗ ) could measure both convergence and diversity of A in a sense. A small value of IGD(A, P ∗ ) means that A must be very close to P ∗ and cannot miss any part of P ∗. The data file of P ∗ for each task and the source code of computing IGD can also be available from the zip package provided online. B. Ranking of the MO-MFO Algorithms For a multiobjective multitasking problem, several IGD values are obtained by each run of the algorithm, and one value is for a task. Based on these IGD values, we provide a comprehensive criterion to evaluate the overall performance of a MO-MFO algorithm, so as to rank the algorithms on each test problem. Suppose there are K tasks T1 , T2 , . . . , TK in a test problem, and the IGD value obtained by an algorithm in a run for Ti is denoted as Ii , where i = 1, 2, . . . K. Moreover, suppose the average and standard deviation of the IGD values for Ti are µi and σi respectively, where i = 1, 2, . . . , K. The mean standard score (MSS) of the obtained IGD values for the test problem is computed as follows: M SS =
1
0.8
��
��
0.6 0.5
0.4 0 1
0.2
1 0.5
0.5
0 0
0.2
0.4
0.6
0.8
1
��
0
0
��
��
K 1 X Ii − µi K i=1 σi
(38)
In practice, µi and σi will be calculated according to the IGD results obtained by all the algorithms on the task Ti in all runs. MSS is used as a comprehensive criterion, and a smaller MSS value indicates better overall performance of a MO-MFO algorithm on a test problem. C. Experimental Settings
Fig. 1. Four different kinds of Pareto fronts involved in the proposed test problems.
III. P ERFORMANCE E VALUATION This section describes the process that will be followed to evaluate the performance of the algorithm on the proposed test
1) The maximum number of nondominated objective vectors in the approximate set: After running the algorithm on a test problem, the IGD metric should be computed for each task of the problem. The maximum number of nondominated objective vectors produced by the algorithm for computing the IGD (i.e., |A|) should be:
TABLE I S UMMARY OF THE PROPOSED TEST PROBLEMS FOR E VOLUTIONARY M ULTIOBJECTIVE M ULTITASKING . Problem
CIHS
CIMS
CILS
PIHS
PIMS
PILS
NIHS
NIMS
NILS
• •
sim (T1 , T2 )
Task No.
Pareto Set
Pareto Front
Properties
T1
x1 ∈ [0, 1], xi = 0, i = 2 : 50
f12 + f22 = 1, f1 ≥ 0, f2 ≥ 0
concave, unimodal, separable
T2
x1 ∈ [0, 1], xi = 0, i = 2 : 50
f2 = 1 − f12 , 0 ≤ f1 ≤ 1
concave, unimodal, separable
T1
x1 ∈ [0, 1], xi = 1, i = 2 : 10
f2 = 1 − f12 , 0 ≤ f1 ≤ 1
concave, multimodal, nonseparable
T2
x1 ∈ [0, 1], (x2 , . . . , x10 )T = scm2
f12 + f22 = 1, f1 ≥ 0, f2 ≥ 0
concave, unimodal, nonseparable
T1
x1 ∈ [0, 1], xi = 0, i = 2 : 50
concave, multimodal, separable
T2
x1 ∈ [0, 1], xi = 0, i = 2 : 50
T1
x1 ∈ [0, 1], xi = 0, i = 2 : 50
T2
x1 ∈ [0, 1], (x2 , . . . , x50 )T = sph2
f12 + f22 = 1, f1 ≥ 0, f2 ≥ 0 √ f 2 = 1 − f1 , 0 ≤ f1 ≤ 1 √ f 2 = 1 − f1 , 0 ≤ f1 ≤ 1 √ f 2 = 1 − f1 , 0 ≤ f1 ≤ 1
T1
x1 ∈ [0, 1], (x2 , . . . , x50 )T = spm1
f12 + f22 = 1, f1 ≥ 0, f2 ≥ 0
concave, unimodal, nonseparable
T2
x1 ∈ [0, 1], xi = 0, i = 2 : 50
f2 = 1 − f12 , 0 ≤ f1 ≤ 1
concave, multimodal, nonseparable
T1
x1 ∈ [0, 1], xi = 0, i = 2 : 50
f12 + f22 = 1, f1 ≥ 0, f2 ≥ 0
concave, multimodal, nonseparable
T2
x1 ∈ [0, 1], (x2 , . . . , x50 )T = spl2
f12 + f22 = 1, f1 ≥ 0, f2 ≥ 0
concave, multimodal, nonseparable
T1
x1 ∈ [0, 1], xi = 1, i = 2 : 50
concave, multimodal, nonseparable
T2
x1 ∈ [0, 1], xi = 0, i = 2 : 50
T1
x1 ∈ [0, 1], x2 ∈ [0, 1], xi = 1, i = 3 : 20
f12 + f22 = 1, f1 ≥ 0, f2 ≥ 0 √ f 2 = 1 − f1 , 0 ≤ f1 ≤ 1 P3 2 i=1 fi = 1, fi ≥ 0, i = 1, 2, 3
T2
x1 ∈ [0, 1], x2 ∈ [0, 1], xi = 0, i = 3 : 20
concave, unimodal, nonseparable
T1
x1 ∈ [0, 1], x2 ∈ [0, 1], (x3 , . . . , x25 )T = snl1
f2 = 1 − f12 , 0 ≤ f1 ≤ 1 P3 2 i=1 fi = 1, fi ≥ 0, i = 1, 2, 3
concave, multimodal, nonseparable
T2
x1 ∈ [0, 1], x2 ∈ [0, 1], xi = 0, i = 3 : 50
f2 = 1 − f12 , 0 ≤ f1 ≤ 1
concave, multimodal, nonseparable
0.97
0.52
0.07
0.99
0.55
0.002
0.94
0.51
0.001
100 for the task with two objectives. 120 for the task with three objectives.
2) The maximum number of function evaluations: It is set to 200,000 for all the test problems. Note that “a function evaluation” here means a calculation of the objective functions of a task Ti , and the function evaluations on different tasks are not distinguished. 3) The number of independent runs: Each algorithm should be run 30 times independently on each multiobjective multitasking test problem.
convex, multimodal, nonseparable convex, unimodal, separable convex, multimodal, separable
convex, unimodal, separable concave, multimodal, nonseparable
4) The parameter settings for the algorithm: The test problem NIMS or NILS consists of a bi-objective task and a three-objective task. Whereas each of the remaining test problems, consists of two bi-objective tasks. The algorithm should use the same parameters for NIMS and NILS, and use the same ones for the other test problems. IV. BASELINE R ESULTS This section presents the baseline results obtained by a MO-MFO algorithm, referred to as MO-MFEA [4], on the proposed test problems. MO-MFEA will be degenerated into
NSGA-II when there is only one task in the input. To show the benefits of MO-MFO, the results of MO-MFEA are also compared with those of NSGA-II. It is worth note that NSGAII is not a MO-MFO algorithm and it solves the two tasks in a test problem separately, whereas MO-MFEA solves them simultaneously in a single population. NSGA-II uses a population size of 100 for solving a single task, while MO-MFEA uses a population size of 200 for solving a test problem with two tasks. The maximal number of function evaluations on a task is set to 100,000 for NSGAII. To ensure a fair comparison, MO-MFEA uses 200,000 as the maximal number of function evaluations for a test problem since it solves two tasks together at a time. NSGAII and MO-MFEA use the same simulated binary crossover operator and polynomial mutation to produce the candidate individuals. The parameters for crossover and mutation are shown in Table II, where D is the dimensionality of the unified code representation [1]. TABLE II PARAMETERS FOR CROSSOVER AND MUTATION . Parameter
Value
Crossover probability (pc ) Mutation probability (pm ) Distribution index for crossover (ηc ) Distribution index for mutation (ηm )
0.9 1/D 20 20
TABLE III T HE AVERAGE AND STANDARD DEVIATION ( SHOWN IN THE BRACKET ) OF IGD VALUES OBTAINED BY MO-MFEA AND NSGA-II. T HE SIGNIFICANTLY BETTER IGD VALUE FOR EACH TASK IS HIGHLIGHTED IN BOLD . Problem
sim
Task
(T1 , T2 )
No. T1
CIHS
0.97 T2 T1
CIMS
0.52 T2 T1
CILS
0.07 T2 T1
PIHS
0.99 T2 T1
PIMS
0.55 T2 T1
A. Results of IGD and MSS Table III shows the average IGD obtained by MO-MFEA and NSGA-II on nine test problems, where the standard deviation values are also reported. To test the difference for statistical significance, the Wilcoxon signed-rank test at a 5% significance level is conducted on the IGD values obtained by MO-MFEA and NSGA-II for each multiobjective task, and the significantly better IGD value for each task is shown in bold. From Table III, except for PILS and NILS, MO-MFEA performs significantly better than NSGA-II on both the two tasks in a test problem. For some cases, e.g., T1 of CILS and T1 of NIHS, MO-MFEA even outperforms NSGA-II by a large margin. For PILS, although MO-MFEA is a little worse than NSGA-II on T1 , it performs much better than NSGA-II on T2 . As for NILS, MO-MFEA and NSGA-II achieve very close performance on both T1 and T2 . Table IV further reports the difference between the average MSS obtained by MO-MFEA and NSGA-II on each test problem. Here µi and σi are calculated according to the IGD results of MO-MFEA and NSGA-II for Ti in all runs. As can be seen from Table IV, all the differences are smaller than 0 except on NILS, which indicates that MO-MFEA achieves better overall performance than NSGA-II on all the proposed test problems except NILS. B. Convergence Curves Fig. 2 shows the evolution of average IGD with number of generations for MO-MFEA and NSGA-II on each of the test
PILS
0.002 T2 T1
NIHS
0.94 T2 T1
NIMS
0.51 T2 T1
NILS
0.001 T2
IGD NSGA-II
MO-MFEA
2.0234E-3
3.9912E-4
(5.1879E-4)
(9.7671E-5)
4.3621E-3
2.6491E-3
(8.5407E-4)
(5.6744E-4)
1.0045E-1
4.5705E-2
(7.5847E-2)
(6.5713E-2)
2.2897E-2
8.7723E-3
(1.9082E-2)
(1.2175E-2)
2.5503E-1
2.7105E-4
(1.0821E-1)
(2.6731E-5)
1.9905E-4
1.8986E-4
(6.513E-6)
(6.628E-6)
1.1145E-3
1.1029E-3
(3.8107E-4)
(1.1949E-3)
5.654E-2
3.0406E-2
(3.0369E-2)
(1.6188E-2)
4.4903E-3
2.6206E-3
(1.6131E-3)
(1.1806E-3)
1.5577E1
1.0892E1
(3.7002E0)
(3.962E0)
2.7647E-4
3.2401E-4
(1.2629E-4)
(8.8287E-5)
6.3458E-1
1.099E-2
(8.8258E-4)
(2.0652E-3)
3.1286E1
1.5523E0
(6.0683E1)
(2.4312E-2)
7.8558E-4
5.0224E-4
(1.6655E-4)
(1.4331E-4)
4.7021E-1
2.792E-1
(3.3048E-1)
(2.6437E-1)
9.1944E-2
2.8576E-2
(8.8784E-2)
(4.7721E-2)
8.3588E-4
8.3483E-4
(5.4979E-5)
(6.2227E-5)
6.4226E-1
6.4316E-1
(2.5715E-4)
(3.2324E-4)
problem. From Fig. 2, MO-MFEA converges to the two Pareto fronts (for T1 and T2 respectively) faster than NSGA-II on most of test problems by solving the two multiobjective tasks in a test problem simultaneously. For certain cases, NSGAII shows a little faster convergence speed in the early stage of search but is surpassed by MO-MFEA quickly, which is particularly clear on CILS. C. Distribution of Solutions in the Objective Space The distribution of nondominated objective vectors obtained by MO-MFEA and NSGA-II in a single run for each task is shown in Figs. 3, 4, and 5, in order to visually see how
IGD (log scale)
10 0
10 -2
10 2
10 0
200
400
600
800
10 -4
1000
0
200
������� ��� ������� �� � ���� ��� � ���� ��
IGD (log scale)
IGD (log scale)
600
800
10 -2
10 -4
1000
10 0
������� ��� ������� �� � ���� ��� � ���� ��
10 2
200
400
600
800
10 0
10 -4
1000
0
200
IGD (log scale)
10 5
400
600
800
10 0
200
400
600
800
1000
10 -2
0
200
400
600
800
1000
NILS
10 0 ������� ��� ������� �� � ���� ��� � ���� ��
10 4
10 2
10 -2
1000
Number of Generations
10 0
0
800
������� ��� ������� �� � ���� ��� � ���� ��
10 -1
10 -4
1000
NIMS
10 6 ������� ��� ������� �� � ���� ��� � ���� ��
600
PILS
Number of Generations
NIHS
400
10 -3
Number of Generations
10 10
200
10 0
10 -2
0
0
Number of Generations
PIMS
10 4
10 -2
IGD (log scale)
10 0
Number of Generations
PIHS
10 2
400
IGD (log scale)
0
10 4
10 -5
������� ��� ������� �� � ���� ��� � ���� ��
10 -2
Number of Generations
10 -4
CILS
10 2 ������� ��� ������� �� � ���� ��� � ���� ��
IGD (log scale)
IGD (log scale)
10 2
10 -4
CIMS
10 4 ������� ��� ������� �� � ���� ��� � ���� ��
IGD (log scale)
CIHS
10 4
������� ��� ������� �� � ���� ��� � ���� ��
10 -1
10 -2
10 -3
0
200
Number of Generations
400
600
800
Number of Generations
1000
10 -4
0
200
400
600
800
1000
Number of Generations
Fig. 2. Convergence curves of the average IGD (over 30 runs) obtained with the number of generations for MO-MFEA and NSGA-II on the proposed test problems.
TABLE IV T HE DIFFERENCE BETWEEN THE AVERAGE MSS OBTAINED BY MO-MFEA AND NSGA-II. Problem sim(T1 , T2 ) MSS Difference COHS COMS COLS POHS POMS POLS NOHS NOMS NOLS
0.97 0.52 0.07 0.99 0.55 0.002 0.94 0.51 0.001
-1.672 -0.764 -1.43 -0.48 -1.073 -0.787 -1.001 -0.71 0.832
well the obtained approximate set is in the objective space. This particular run is associated with the result closest to the average IGD value. It can be seen from these figures that MOMFEA can achieve a better PF approximation than NSGA-II almost on all the concerned multiobjective optimization tasks. R EFERENCES [1] A. Gupta, Y.-S. Ong, and L. Feng, “Multifactorial evolution: toward evolutionary multitasking,” IEEE Transactions on Evolutionary Computation, vol. 20, no. 3, pp. 343–357, 2016. [2] Y.-S. Ong and A. Gupta, “Evolutionary multitasking: A computer science view of cognitive multitasking,” Cognitive Computation, vol. 8, no. 2, pp. 125–142, 2016. [3] A. Gupta, J. Ma´ndziuk, and Y.-S. Ong, “Evolutionary multitasking in bi-level optimization,” Complex & Intelligent Systems, vol. 1, no. 1-4, pp. 83–95, 2015.
���� ��� �
1.2
Pareto Front MO-MFEA NSGA-II
1
Pareto Front MO-MFEA NSGA-II
1 0.8
��
0.8
��
���� ��� �
1.2
0.6
0.6
0.4
0.4
0.2
0.2
0
0 0
0.2
0.4
0.6
0.8
1
1.2
0
0.2
0.4
�� �� � ��� �
5
0.6
0.8
1
�� �� � ��� �
2
4
1.5
��
��
Pareto Front MO-MFEA NSGA-II
3
Pareto Front MO-MFEA NSGA-II
1
2 0.5
1
0
0 0
0.2
0.4
0.6
0.8
1
0
0.2
0.4
0.6
0.8
�� �� � ��� �
10
1
1.2
1.4
1.6
1.8
�� �� � ��� �
1.2
Pareto Front MO-MFEA NSGA-II
1
8
0.8
��
��
6
4
Pareto Front MO-MFEA NSGA-II
0.6 0.4
2
0.2
0
0 0
2
4
6
8
10
��
0
0.2
0.4
0.6
0.8
1
��
Fig. 3. Distribution of solutions obtained by MO-MFEA and NSGA-II in the objective space for each task.
[4] A. Gupta, Y.-S. Ong, L. Feng, and K. C. Tan, “Multiobjective multifactorial optimization in evolutionary multitasking,” IEEE Transactions on Cybernetics, in press. [5] B. Da, A. Gupta, Y.-S. Ong, L. Feng, and C. Wang, “Evolutionary multitasking across multi and single-objective formulations for improved problem solving,” in Proceedings of IEEE Congress on Evolutionary Computation, 2016, to be published. [6] R. Chandra, A. Gupta, Y.-S. Ong, and C.-K. Goh, “Evolutionary multitask learning for modular training of feedforward neural networks.” in Proceedings of The 23rd International Conference on Neural Information Processing, 2016, to be published. [7] R. Sagarna and Y.-S. Ong, “Concurrently searching branches in software tests generation through multitask evolution.” in Proceedings of The 2016 IEEE Symposium Series on Computational Intelligence, 2016, to be published.
[8] Y. Yuan, Y.-S. Ong, A. Gupta, P.-S. Tan, and H. Xu, “Evolutionary multitasking in permutation-based combinatorial optimization problems: Realization with TSP, QAP, LOP, and JSP.” in Proceedings of IEEE Region 10 Conference (TENCON), 2016, to be published. [9] A. Gupta, Y.-S. Ong, D. Bingshui, L. Feng, and S. D. Handoko, “Measuring complementarity between function landscapes in evolutionary multitasking.” in Proceedings of IEEE Congress on Evolutionary Computation, 2016, to be published. [10] A. Gupta and Y.-S. Ong, “Genetic transfer or population diversification? deciphering the secret ingredients of evolutionary multitask optimization,” in arXiv:1607.05390, 2016. [11] K. Deb, Multi-objective optimization using evolutionary algorithms. John Wiley & Sons, 2001, vol. 16. [12] C. A. C. Coello, D. A. Van Veldhuizen, and G. B. Lamont, Evolutionary algorithms for solving multi-objective problems. Springer, 2002, vol. 242.
���� ��� �
1.2
���� ��� �
4 Pareto Front MO-MFEA NSGA-II
1
Pareto Front MO-MFEA NSGA-II
3
��
��
0.8 0.6
2
0.4 1 0.2 0
0 0
0.2
0.4
0.6
0.8
1
0
0.2
0.4
�� �� � ��� �
1.2
0.6
0.8
1
�� �� � ��� �
500 Pareto Front MO-MFEA NSGA-II
1
Pareto Front MO-MFEA NSGA-II
400
0.8
��
��
300 0.6
200 0.4 100
0.2 0
0 0
0.2
0.4
0.6
0.8
1
1.2
0
0.2
0.4
�� �� � ��� �
1.2
0.6
0.8
1
�� �� � ��� �
25 Pareto Front MO-MFEA NSGA-II
1
Pareto Front MO-MFEA NSGA-II
20
0.8
��
��
15 0.6
10 0.4 5
0.2 0
0 0
0.2
0.4
0.6
0.8
1
1.2
0
��
5
10
15
20
25
��
Fig. 4. Distribution of solutions obtained by MO-MFEA and NSGA-II in the objective space for each task (continued 1).
[13] K. C. Tan, E. F. Khor, and T. H. Lee, Multiobjective evolutionary algorithms and applications. Springer Science & Business Media, 2006. [14] D. W. Corne, N. R. Jerram, J. D. Knowles, M. J. Oates et al., “PESA-II: Region-based selection in evolutionary multiobjective optimization,” in Proceedings of the Genetic and Evolutionary Computation Conference. Citeseer, 2001. [15] E. Zitzler, M. Laumanns, L. Thiele, E. Zitzler, E. Zitzler, L. Thiele, and L. Thiele, “SPEA2: Improving the strength pareto evolutionary algorithm,” in Proceedings of Evolutionary Methods for Design, Optimization and Control with Applications to Industrial Problems, 2002, pp. 95–100. [16] K. Deb, A. Pratap, S. Agarwal, and T. Meyarivan, “A fast and elitist multiobjective genetic algorithm: NSGA-II,” IEEE Transactions on Evolutionary Computation, vol. 6, no. 2, pp. 182–197, 2002. [17] Q. Zhang and H. Li, “MOEA/D: A multiobjective evolutionary algorithm
[18]
[19]
[20]
[21]
based on decomposition,” IEEE Transactions on Evolutionary Computation, vol. 11, no. 6, pp. 712–731, 2007. K. Deb and H. Jain, “An evolutionary many-objective optimization algorithm using reference-point-based nondominated sorting approach, part I: Solving problems with box constraints,” IEEE Transactions on Evolutionary Computation, vol. 18, no. 4, pp. 577–601, 2014. Y. Yuan, H. Xu, B. Wang, and X. Yao, “A new dominance relationbased evolutionary algorithm for many-objective optimization,” IEEE Transactions on Evolutionary Computation, vol. 20, no. 1, pp. 16–37, 2016. Y. Yuan, H. Xu, B. Wang, B. Zhang, and X. Yao, “Balancing convergence and diversity in decomposition-based many-objective optimizers,” IEEE Transactions on Evolutionary Computation, vol. 20, no. 2, pp. 180–198, 2016. E. Zitzler and S. K¨unzli, “Indicator-based selection in multiobjective search,” in Parallel Problem Solving from Nature-PPSN VIII. Springer,
���� ��� �
1000
���� ��� �
1.2 Pareto Front MO-MFEA NSGA-II
800
Pareto Front MO-MFEA NSGA-II
1 0.8
��
��
600 0.6
400 0.4 200
0.2
0
0 0
200
400
600
800
1000
0
0.2
0.4
�� �� � ��� �
Pareto Front MO-MFEA NSGA-II
3 2.5 2
40
1.5
20
1
0 100
0.5
80 60
50
40 0
20 0
��
0
0
��
0.4
0.6
0.8
1
���� ��� �
25
Pareto Front MO-MFEA NSGA-II
2 1.5
0.2
��
���� ��� �
20 Pareto Front MO-MFEA NSGA-II
15 1
��
�
1
��
�
60
0.8
�� � ��� �
3.5
Pareto Front MO-MFEA NSGA-II
80
0.6
��
0.5
10
0 1.5
5 1.5
1 1
0.5
��
0.5 0
0
��
0 0
0.2
0.4
0.6
0.8
1
��
Fig. 5. Distribution of solutions obtained by MO-MFEA and NSGA-II in the objective space for each task (continued 2).
2004, pp. 832–842. [22] N. Beume, B. Naujoks, and M. Emmerich, “SMS-EMOA: Multiobjective selection based on dominated hypervolume,” European Journal of Operational Research, vol. 181, no. 3, pp. 1653–1669, 2007. [23] J. Bader and E. Zitzler, “HypE: An algorithm for fast hypervolumebased many-objective optimization,” Evolutionary computation, vol. 19, no. 1, pp. 45–76, 2011. [24] D. A. Van Veldhuizen and G. B. Lamont, “Multiobjective evolutionary algorithm research: A history and analysis,” Citeseer, Tech. Rep., 1998.