Evolving Interface Design for Robot Search Tasks Holly A. Yanco and Brenden Keyes Computer Science Department University of Massachusetts Lowell One University Ave, Olsen Hall Lowell, MA, 01854 USA {holly, bkeyes}@cs.uml.edu Jill L. Drury The MITRE Corporation Mail Stop K320 202 Burlington Road Bedford, MA, 01730 USA
[email protected] Curtis W. Nielsen, Douglas A. Few, and David J. Bruemmer Idaho National Laboratory P.O. Box 1625 Idaho Falls, ID 83415 USA {Curtis.Nielsen, Doug.Few, David.Bruemmer}@inl.gov
Abstract This paper describes two steps in the evolution of human-robot interaction designs developed by the University of Massachusetts Lowell (UML) and the Idaho National Laboratory (INL) to support urban search and rescue tasks. We conducted usability tests to compare the two interfaces, one of which emphasized three-dimensional mapping while the other design emphasized the video feed. We found that participants desired a combination of the interface design approaches. As a result, we changed the UML system to augment its heavy emphasis on video with a map view of the area immediately around the robot. We tested the changes in a follow-on user study and the results from that experiment suggest that performance, as measured by the number of collisions with objects in the environment and time on task, is better with the new interaction techniques. Throughout the paper, we describe how we applied human-computer interaction principles and techniques to benefit the evolution of the human-robot interaction designs. While the design work is situated in the urban search and rescue domain, we feel the results can be generalized to domains that involve other search or monitoring tasks using remotely located robots.
1
1 Introduction Over the past several years, there has been a growing interest in using robots to perform tasks in urban search and rescue (USAR) settings (e.g., Casper and Murphy (2003), Jacoff et al. (2000), and Jacoff et al. (2001)). Even the popular press has noted the role of USAR robots at disaster scenes. In Hurricane Katrina’s aftermath, for example, the St. Petersburg Times noted that the Florida Regional Task Force 3 used robots to search two buildings in Biloxi, Mississippi that were too dangerous to enter (Gussow, 2005). In recognition of the growing role of USAR robotics, there has been much recent work on Human-Robot Interaction (HRI) in general and interaction designs for rescue robots in particular (e.g., Nourbakhsh et al. (2005), Kadous et al. (2006), Yanco and Drury (2007)). Both HRI in general and rescue robotics in particular have benefited from applying human factors and human-computer interaction (HCI) design principles and evaluation techniques. For example, Adams (2005) used Goal Directed Task Analysis to determine the interaction needs of officers from the Nashville Metro Police Bomb Squad. Scholtz et al. (2004) used Endsley’s (1988) Situation Awareness Global Assessment Technique (SAGAT) to determine robotic vehicle supervisors’ awareness of when vehicles were in trouble and thus required closer monitoring or intervention. Yanco and Drury (2004) employed usability testing to determine (among other things) how well a search and rescue interface supported use by first responders. Yet HRI design for USAR is by no means a solved problem. There are still open questions on how to best provide to robot operators the necessary awareness to understand what state the robot is in, what part of the space has been searched, and whether there are signs of life. An additional challenge is that the interface needs to facilitate efficient searching because time is important when victims are in need of medical attention or if they are trapped under unstable debris. While the literature has examples such as those cited above of using specific HCI techniques to design or evaluate human-robot interfaces, we have not seen literature that highlights the process of evolving multiple generations of HRI interaction designs based on systematically applying HCI principles. Failure to use this process is contrary to best practices in designing for human-computer (and human-machine) interaction. Even a quick glance at the bookshelf of HCI practitioners and researchers yields titles such as The Usability Engineering Lifecycle (Mayhew, 1999) and Developing User Interfaces: Ensuring Usability Through Product and Process (Hix and Hartson, 1993). In our work, we set out to apply best practices of HCI processes in HRI interface design. This paper reports on two steps in that evolutionary process. Our research groups at the Idaho National Laboratory (INL) and the University of Massachusetts Lowell (UML) have been working on designs for efficient interfaces that promote awareness of the robot’s state and surroundings. We have both built robot systems using the same underlying robot and autonomy levels to act as research platforms. The UML researchers have made significant efforts to specifically address the
2
needs of the USAR community while the INL group has focused on developing general robot behaviors for a variety of conditions, including USAR. Because both groups are developing interfaces for the same basic set of robot behaviors and functionality, comparing these interface approaches prior to evolving to the next step gave us more data on user performance and preferences than would have been the case from simply studying an interface from either group in isolation. This paper begins with the description of the INL and UML systems and interface designs, then discusses the usability study of the two interfaces, which used trained search and rescue personnel as test participants. Based upon the results of the comparison study, we describe the evolution of the UML interface design. The new design was tested in a second user study with novice participants. For each interface design, we describe the HCI principles and evaluation techniques applied. Beyond the USAR domain, the results of investigating alternative interface designs can guide the design of remote robot systems intended for other types of search or monitoring tasks. As with USAR, these tasks rely on the system operator understanding the robot’s relationship to the objects in the environment, as well as the robot’s location within the environment. As another contribution, our work provides a case study of evolving HRI design in accordance with HCI principles. 2 Robot Systems This section describes the robot hardware, autonomy modes and the interfaces for the INL and UML systems. 2.1 Idaho National Laboratories (INL) The INL control architecture is the product of an iterative development cycle where behaviors have been evaluated in the hands of users (Bruemmer et al., 2005), modified, and tested again. The INL has developed a behavior architecture that can port to a variety of robot geometries and sensor suites. INL’s architecture, called the Robot Intelligence Kernel, is being used by several HRI research teams in the community. For the first experiments discussed in this paper, INL used the iRobot ATRV-Mini (shown in Figure 1), which has laser and sonar range finding, wheel encoding, and streaming video. Using a technique developed at the INL, a guarded motion behavior on the robot uses an event horizon calculation to avoid collisions (Pacis et al., 2004). In response to laser and sonar range sensing of nearby obstacles, the robot scales down its speed using an event horizon calculation, which measures the maximum speed the robot can safely travel in order to come to a stop approximately two inches from the obstacle. By scaling down the speed in many small increments, it is possible to insure that, regardless of the commanded translational or rotational velocity, guarded motion will stop the robot at the same distance from an obstacle. This approach provides predictability and ensures minimal interference with the operator’s control of the vehicle. If the robot is being
3
Figure 1: The INL robot, an iRobot ATRV-Mini (left), and interface (right). driven near an obstacle rather than directly towards it, guarded motion will not stop the robot, but may slow its speed according to the event horizon calculation. Various modes of operation are available, affording the robot different types of behavior and levels of autonomy. In teleoperation mode, the robot takes no initiative to avoid collisions. Safe mode is similar to teleoperation mode except the robot takes initiative to avoid collisions with the local environment. In shared mode, the robot navigates based upon understanding of the environment, yet yields to human joystick input. In collaborative tasking mode, the robot autonomously creates an action plan based on the human’s high-level planning (e.g. go to a point selected within the map, return to start, go to an entity). Control of the INL system is actuated through the use of an augmented virtuality interface, defined as displays “in which a virtual environment is enhanced, or augmented, through some addition of real world images or sensations” (Drascic and Milgram, 1996, p. 125). The INL 3D interface combines the map, robot pose, video, and camera orientation into a single perspective view of the environment (Nielsen and Goodrich, 2006; Nielsen et al., 2005). A video window showing real-world information augments the map so that the sum of the two visual elements provides a wider and richer field of view than either could accomplish separately. “When, due to an unnaturally narrow field of view, we are unable to see important parts of the world, such as the floor and our body within the world, we lose a great deal of confidence in our understanding of the world” (Drascic and Milgram, 1996, p. 125). This finding has been confirmed by Keyes et al. (2006), which showed that operators of remotely located robots have fewer collisions when the operator’s camera display shows part of the robot in its view of the environment.
4
The video window moves within the interface display as the robot camera is turned. Assuming the human operator’s point of view is aligned with the robot’s camera direction, the video window movement is intended to simulate the effect of a person turning his or her head to one side or another. From the 3D control interface, the operator has the ability to place various icons representing objects or places of interest in the environment (e.g. start, victim, or custom label). Once an icon has been placed in the environment, the operator may enter into a collaborative task by right-clicking the icon which commissions the robot to autonomously navigate to the location of interest. The other autonomy modes of the robot are enacted through the menu on the right side of the interface. As the robot travels through the remote environment, it builds a map of the area using blue blocks that form columns representing walls or obstacles. The blue blocks are prominent visual features that are given precedence over the video by virtue of appearing in front of the lower part of the video if necessary. The map grows as the robot travels through and discovers the environment. As with all robot-built maps, the fidelity of the map is dependent on the ability of the sensor systems to maintain alignment between the virtual map and the physical map. If the surface traveled by the robot is slippery or the robot slides, physical/virtual alignment may suffer and the user may see such phenomena as the robot traveling through the virtual walls. The user has the ability to select the perspective through which the virtual environment is viewed by choosing the elevated, far, or close button. The elevated view provides a 2D overview of the entire environment. The far and close buttons result in 3D perspectives showing more (far) or less (close) of the environment and are intended to provide depth cues to help in maneuvering the robot. The default view button returns the perspective to the original robot-centered perspective (also 3D). Through continuous evaluation of sensor data, the robot attempts to keep track of its position with respect to its map. As shown in Figure 1 on the right, the robot is represented as the red vehicle in the 3D interface. The virtual robot is sized proportionally to demonstrate how it fits into its environment. Red triangles appear if the robot is blocked and unable to move in a particular direction. 2.2 UMass Lowell (UML) UMass Lowell’s platform is an iRobot ATRV-JR robot. This robot came equipped with a SICK laser rangefinder and a ring of 26 sonar sensors. UML added front and rear pantilt-zoom cameras, a forward-looking infrared (FLIR) camera, a carbon dioxide (CO2) sensor, and a lighting system (see Figure 2). The robot uses autonomy modes similar to the INL system; in fact, the basis for the current autonomy levels is INL’s system. Teleoperation, safe, goal (a modified shared mode) and escape modes are available. In escape mode, the robot autonomously maneuvers away from all obstacles and then stops to await further direction from human operators.
5
Figure 2: The UML robot, an iRobot ATRV-JR, (left) and interface (right). In this version of the interface1, there are two video panels, one for each of the two cameras on the robot (see Figure 2). The main video panel is the larger of the two and was designed to be the user’s focus while driving the robot and searching for victims. Because it is important for robot operators to watch the video panel, in addition to the fact that eyes are naturally drawn to movement, having a powerful attention attractant centrally located in the operator’s visual field is likely to be successful. (See Kubey and Csikszentmihalyi (2002) for a discussion of how the movement in television draws attention.) Having two video panels, with one being more prominently displayed than the other, is a variation of the recommendation for future work made by Hughes and Lewis (2004), who said that “further study of the two camera display may find that one of the screens is more dominant, suggesting that a screen-in-screen technique may be appropriate” (p. 517). The second video panel is smaller, is placed at the top-right of the main video window, and is mirrored to simulate a rear view mirror in a car. The robot operator looks up and to the right to view the second video display just as a driver looks in a car’s rear view mirror. By default, the front camera is in the main video panel, while the rear camera is displayed in the smaller rear view mirror video panel. The robot operator has the ability to switch camera views, called the Automatic Direction Reversal (ADR) mode. In ADR mode, the rear camera is displayed on the main video panel and the front camera is displayed on the smaller panel. All of the driving commands and the range panel readouts (described below) are reversed. Pressing forward on the joystick in this case will cause the robot to back up, but to the user, the robot will be moving “forward” (i.e., the direction that the camera currently displayed in the main window is looking). This essentially eliminates the front/back of the robot because the user is now very rarely “backing up.” 1
See Baker et al. (2004) for a description of the earlier interface design or Keyes (2007) for a discussion of the system’s evolution over several years.
6
UML chose to use the automobile interface metaphor to guide video window placement for two reasons. First, and most obviously, the intended user group (rescue personnel) can be expected to have significant experience driving cars. The ADR mode can take advantage of operators’ prior knowledge of using a car’s rear-view mirror to enable them to use this mode without training. More important, however, is the fact that this metaphor is congruent with the types of attention focus needed by rescue robot operators. The direction of travel requires the operator’s primary focus of attention, with a peripheral focus being 180 degrees from the driving direction (for example, to have awareness of an escape path). These two attention foci align well with the automobile rear-view mirror analogy. Steinfeld (2004) notes that robots that provide a forward video scene are “ripe for mimicking traditional automotive representations” (p. 2753). The main video panel has textual labels identifying which camera is currently being displayed in it and the current zoom level of the camera (1x - 16x). The interface, by default, has an option for showing crosshairs, indicating the current pan and tilt of the camera. Crosshairs have been used previously in HRI designs such as that of Zalud (2006). In the case of the UML design, the crosshairs overlay the video as a type of head up display so that critical information about camera orientation can be provided to users without deflecting their attention from the information being provided by the camera. The horizontal part of the cross acts as a kind of horizon line to indicate how far the camera has been tilted up or down and the vertical component of the cross provides a visual reminder of how far from center, and in which direction, the camera has been panned. The map panel (shown in figure 3) provides a map of the robot’s environment, as well as the robot’s current position and orientation within that environment. As the robot moves throughout the space, it generates a map using the distance information received by its sensors using a Simultaneous Localization and Mapping (SLAM) algorithm. This type of mapping algorithm uses a statistical model to compare current distance readings and odometry information with other readings it has already seen to try to match up its current location while building a representation environment. SLAM is the most widely used and accepted algorithm for real-time dynamic mapping using robotic platforms (see Thrun (2002) for an overview of robot mapping). PMap, the mapping package we used (Howard, 2004), also kept track of the robot’s path through the environment. This path, displayed as a red line on the map, made it easy for users to know where they had started, where they traveled, as well as the path they took to get to where they currently are. Many users in the first experiment talked about in the next section referred to this trail as being “breadcrumbs” that helped them find their way out of the maze.
7
Figure 3. The UML system’s map panel, showing the robot’s position, the entire environment and the trail of “breadcrumbs.” The “zoom mode” feature also exists on the map panel. “Zoom mode,” which can be seen in figure 4, is essentially a view of the map at a zoomed in level. It takes the raw laser data in front of the robot and draws a line, connecting the sensor readings together. There is also a smaller rectangle on the bottom of the display that represents the robot. As long as the white sensor lines do not touch or cross the robot rectangle, then the robot is not in contact with anything. By using data from a laser sensor with approximately 1 mm accuracy, this panel gives a highly accurate and easy to interpret way to tell if the robot is in close proximity to an object. The disadvantage of placing this view in this location is that it is in the same display location as the map view, forcing users to choose whether they wish to view the map or the zoom mode. Information from the sonar sensors and the laser rangefinder is displayed in the range data panel located directly under the main video panel. When nothing is near the robot, the color of the boxes is the same gray as the background of the interface to indicate nothing is there. As the robot approaches an obstacle at a 1 meter distance, the box(es) will turn to yellow, and then to red when the robot is very close (less than .5 m). The ring of boxes is a rectangle, drawn in a perspective view, which makes it look like a trapezoid. This perspective view was designed to give the user the sensation that they are sitting directly behind the robot, akin to sitting behind the wheel of a car looking out at the car’s hood and the obstacles on the side of the road. If the user pans the camera left or right, this ring will rotate opposite the direction of the pan. If, for instance, the front left corner turns red, the user can pan the camera left to see the obstacle, the ring will then rotate right, so that the red box will line up with the video showing the obstacle sensed by the range sensors.
8
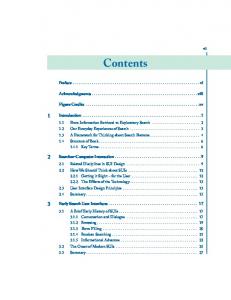
Figure 4. “Zoom mode” showing the front of the robot (the rectangle in the bottom of the figure) and lines indicating obstacles in the area immediately around the robot. The blue arrow-like triangle, in the middle of the range data panel, indicates the true front of the robot. The system aims to make the robot’s front and back be mirror images, so ADR mode will work the same with both; however, the SICK laser, CO2 sensor, and FLIR camera only point towards the front of the robot, so this blue arrow helps the user to distinguish front and back if needed. It was difficult to design a simple yet evocative symbol for the front of the robot. The arrow symbol “affords” pointing in the direction of travel (where a “perceived affordance” is an action the user perceives is possible to take (Norman, 1988)). The travel direction is usually (but not always) along the vector through the front of the robot. The mode indicator panel displays the current mode that the robot is in. The CO2 indicator, located to the right of the main video, displays the current ambient CO2 levels in the area. As the levels rise, the yellow marker moves up. If the marker is above the blue line, then there is possible life in the area. By using a thermometer-like display with a clearly marked threshold, operators do not need to perform a mental translation to determine whether the carbon dioxide level is indicative of life: they can see at a glance whether the meter value is above or below the threshold. The bottom right of the interface shows the status panel. This consists of the battery level, current time, whether the lights are on or off, and the maximum speed level of the robot. The light bulb symbol is either filled with grey or yellow to provide a literal analog of a light being on or off. Similarly, the battery indicator shows a battery symbol filled with dark gray proportionate to the battery power remaining as well as a more precise textual statement of the number of volts remaining. The speed indicator shows
9
the maximum allowable speed of the robot. The joystick is an analog sensor; therefore the more a user pushes on it, the faster the robot will go, as a linear function of the maximum allowable speed. The tortoise and hare icons at the lowest and highest ends of the scale, respectively: a reference to the widely-known Aesop fable and the fact that most people can recognize these as slow and speedy animals. The robot is primarily controlled via a joystick. To move the robot, the operator must hold the trigger and then give it a direction. If the user presses the joystick forward, the robot will move forward, left for left, etc. On top of the joystick is a hat sensor that can read eight compass directions. This sensor is used to pan and tilt the camera. By default, pressing up on this sensor will cause the camera to tilt up, likewise pressing left will pan the camera left. An option in the interface makes it so that pressing up will cause the camera to tilt down; pilots find this option to be more natural because they have been trained to push aircraft controls forward to pitch the nose of the aircraft down. The joystick also contains buttons to home the cameras, perform zoom functions, and toggle the brake. The joystick also has a button to toggle Automatic Direction Reversal mode. Finally, a scrollable wheel to set the maximum speed of the robot is also located on the joystick. All of these functions were placed on the joystick for the sake of efficiency so that the operator could spend the majority of time using a single input device rather than having to repeatedly move a hand from the joystick to the keyboard or mouse and back. However, due to the lack of available buttons on the current joystick, the ability to change modes, as well as turning the lighting system on and off, was relegated to keyboard keys. 2.3 Comparing the designs against HCI principles There are a number of sets of principles and guidelines that have been employed to evaluate how people interact with computer-based systems. Perhaps the most widely used set that is not specific to a single implementation (such as a Macintosh design guide) was developed by Molich and Nielsen (1990; later updated in Nielsen, 1994). Expressed as ten overarching heuristics or “rules of thumb,” this high-level guidance can be tailored for particular systems or used “as is” for a quick evaluation. Drury et al. (2003) adapted Nielsen’s heuristics slightly for use in HRI, and we compared these HRI heuristics to the INL and UML systems to make the observations in table 1. Heuristic evaluations are normally performed by HCI experts who are attempting to keep the needs of “real” users in mind, and so can be thought of as predictions for how the intended users will fare when they use the system. Since heuristic evaluations can surface a large number of minor issues that do not necessarily cause problems for users (Jeffries et al., 1991), it is worthwhile to also perform evaluations involving users or surrogate users before making drastic changes in design. We provide the summary in table 1 as a preview of the difficulties that we expected users might encounter in subsequent experimentation.
10
Table 1. Summary of Applying Heuristics Nielsen’s Heuristics Adapated for HRI (Drury et al., 2003) Is the robot’s information presented in a way that makes sense to human controllers?
Heuristics Applied to INL System Yes, except when the robot slips and the virtual walls are no longer aligned with the physical walls. Also, problems with simply seeing the video information can impede task.
Heuristics Applied to UML System Yes, except that it may take some time to get used to the trapezoidal display of proximity information.
Can the human(s) control the robot(s) without having to remember information presented in various parts of the interface?
Mostly, except users must remember joystick controls and facts such as which icons can be right-clicked for further actions.
Users need to remember how to manipulate the joystick in a number of ways to control motion, camera, and brake.
Is the interface consistent? Is the resulting robot behavior consistent with what humans have been led to believe based on the interface?
Mostly. The movement of the video can seem inconsistent to users who would expect the window to remain stationary.
Yes, except that the “animal” or “Aesop’s fables” metaphor for speed control is quite different from the driving metaphor used elsewhere in the interface.
Does the interface provide feedback?
Yes, regarding where the robot is in the environment, the camera orientation, and what the mode the robot is in.
Yes, regarding where the robot is in the environment, the camera orientation, and what the mode the robot is in.
Does the interface have a clear and simple design?
Mostly, but the map can clutter and occlude the video window.
Yes. There is adequate white (actually gray) space and little clutter.
Does the interface help prevent, and recover from, errors made by the human or the robot?
The map can help prevent driving forward into obstacles, but the lack of a rear-facing camera (and display of its information) can lead to hits in the rear.
The dual camera display can prevent driving problems when backing up but the red and yellow blocks do not provide precise enough information regarding obstacles’ proximity.
Does the interface follow realworld conventions, e.g., for how error messages are presented in other applications?
The use of colors is standard, but the few error messages that we saw are not presented in a standard manner.
The use of colors is standard, but the few error messages that we saw are not presented in a standard manner.
Is the interface forgiving; does it allow for reversible actions on the part of the human or the robot?
Yes, except that once the operator drives the robot impacts something in such a manner that a collision occurs, that action is not really “reversible.”
“Escape” mode allows for getting out of tight spots, but once the robot impacts something that action is not really “reversible.”
Does the interface make it obvious what actions are available at any given point?
The interface has many buttons which remain visible, including camera controls that are redundant to the joystick.
The interface does not make visible those actions that can be controlled via the joystick., and keyboard controls are not visible without physical labels.
Does the interface provide shortcuts and accelerators?
The “go to” function acts as a shortcut for directing the robot to a particular point. The “home cameras” function is a shortcut for moving the camera to the front and level. The “elevated” view is a fast way of getting an overview of the environment without a lot of maneuvering and camera movement.
“Home cameras” button is a shortcut for moving the camera to front and level. “Escape” is a shortcut for getting the robot out of a tight spot.
11
3
Experiment 1
The purpose of this first experiment was to learn which interface design elements are most useful to USAR personnel while performing a search task. To do this we conducted usability studies of the two robot systems at the USAR test arena at the National Institute of Standards and Technology (NIST) in Gaithersburg, MD. Some of the results from this experiment were reported in the 2006 SSRR conference (Yanco et al., 2006). 3.1 Experiment design Because we wished to see differences in preferences and performance between the UML interface and the INL interface, we designed a within-subjects experiment with the independent variable being the human-robot system used. Eight people (7 men, 1 woman) ranging in age from 25 to 60 with search and rescue experience agreed to participate. We asked participants to fill out a pre-experiment questionnaire to understand their relevant experience prior to training them on how to control one of the robots. We allowed participants time to practice using the robot in a location outside the test arena and not within their line of sight so they could become comfortable with remotely moving the robot and the camera(s) as well as the different autonomy modes. Subsequently, we moved the robot to the arena and asked them to maneuver through the area to find victims. We allowed 25 minutes to find as many victims as possible, followed by a 5-minute task aimed primarily at ascertaining whether the robot operator understood where the robot was located with respect to prominent features in the environment (or victims). After that, we took a short break during which an experimenter asked several Likert scale questions. Finally, we repeated these steps using the other robot system, ending with a final short questionnaire and debriefing. The entire procedure took approximately 2 1/2 hours per person. The specific task given to the participants during their 25-minute runs was to “fully explore the approximately 2000 square foot space and find any victims that may be there, keeping in mind that, if this was a real USAR situation, you’d need to be able to direct people to where the victims were located.” Additionally, we asked participants to “think aloud” (Ericsson and Simon, 1980) during the task. After the exploration portion of the experiment, participants were asked to maneuver the robot towards a previously seen point with a five minute time limit. Participants were not informed ahead of time that they would need to remember how to get back to any particular point. We counterbalanced the experiment in two ways to minimize confounding factors. Five of the eight participants started with the UML system and the other three participants began with the INL system. (Due to battery charging considerations, a robot that went first at the start of the day had to alternate with the other system for the remainder of that day. UML started first in testing on days one (2 participants) and three (3 participants). INL started first on day two (3 participants).) Additionally, two different starting positions were identified in the arena so that knowledge of the arena gained from using
12
the first system would not transfer to the use of the second system. The two counterbalancing techniques led to four different combinations of initial arena entrance and initial interface. The tests were conducted in the Reference Test Arenas for Autonomous Mobile Robots developed by the National Institute of Standards and Technology (NIST) (Jacoff et al., 2000; Jacoff et al., 2001). During these tests, the arena consisted of a maze of wooden partitions and stacked cardboard boxes. The first half of the arena had wider corridors than the second half. 3.2 Analysis Method Analysis consisted of two main thrusts: understanding how well participants performed with each of the two systems, and interpreting their comments on post-run questionnaires. Performance measures are valuable as implicit measures of the quality of the humanrobot interaction. Under ordinary circumstances, users who are given better interfaces could be expected to perform better at their tasks than those who are given poor interfaces. Accordingly, we measured the percentage of the arena explored, the number of times the participants bumped the robot against obstacles, and the number of victims found. We investigated two hypotheses. H1: Using INL’s interface will result in exploring more area than using UML’s interface. We predicted that INL’s 3D map display would ease navigation and thus support operators exploring a greater percentage of the arena per unit time. H2: Using UML’s interface will result in finding more victims than using INL’s interface. The prediction leading to H2 is based on the greater emphasis on video and sensor displays such as FLIR and CO2 in the UML interface. After each run, participants were asked to name the features of the robot system that they found “most useful” and “least useful.” We inferred that the “useful” features were considered by participants to be positive aspects of the interface and the “least useful’’ features were, at least in some sense, negative. After reviewing all of the comments from the post-run questionnaires, we determined that they fell into five categories: video, mapping, other sensors, input devices, and autonomy modes. Results are discussed next. 3.3 Results In this section, we present both quantitative and qualitative comparisons of the INL and UML interfaces.
13
3.3.1 Area Coverage We hypothesized that the three-dimensional visualization of the mapping system on INL’s interface would provide users with an easier exploration phase. Table 2 presents the results of arena coverage for each participant with each of the robot systems. There is a significant difference (p