Evolving OWA Operators for Cyber Security Decision Making Problems Susan Appleby
Simon Miller Jonathan M. Garibaldi Horizon Digital Economy Research/Intelligent Modelling and Analysis University of Nottingham Nottingham, UK. Email:
[email protected],
[email protected]
Abstract—Designing secure software systems is a non-trivial task as data on uncommon attacks is limited, costs are difficult to estimate, and technology and tools are continually changing. Consequently, a great deal of expertise is required to assess the security risks posed to a proposed system in its design stage. In this research we demonstrate how Evolutionary Algorithms (EAs) and Simulated Annealing (SA) can be used with Ordered Weighted Average (OWA) operators to provide a suitable aggregation tool for combining experts’ opinions of individual components of an specific technical attack to produce an overall rating that can be used to rank attacks in order of salience. A set of thirty nine cyber security experts took part in an exercise in which they independently assessed a realistic system scenario. We show that using EAs and SA, OWA operators can be tuned to produce aggregations that are more stable when applied to a group of experts’ ratings than those produced by the arithmetic mean, and that the difference between the solutions found by each of the algorithms is minimal. However, EAs do prove to be a quicker method of search when an equivalent number of evaluations is performed by each method. Index Terms—Ordered Weighted Average, Evolutionary Algorithms, Simulated Annealing, Cyber Security, Expert Decision Making
I. I NTRODUCTION Today, an ever-growing number of sensitive transactions of data take place on-line (e.g., e-government, internet banking and e-commerce), and cyber crime has become prevalent. One of the consequences of this is that the cyber security of information systems has become an increasing concern. Assessing the level of risk posed by specific events is an area of ongoing interest for most (if not all) organisations, leading to a requirement for scientific methods of validating the cyber security of proposed software systems in their design stage. Typically, the subjective opinions of cyber security experts are used to verify and validate software systems; this is often the only way to make such assessment. However, it is a lengthy task, and in many cases access to experienced cyber security professionals capable of carrying out such detailed assessment is limited. This work was part funded by CESG - the UK Government’s National Technical Authority for Information Assurance (IA) and RCUK’s Horizon Digital Economy Research Hub grant, EP/G065802/1.
CESG Cheltenham, UK. Email:
[email protected]
In this research we use two different types of survey to elicit the opinions of a set of thirty nine highly experienced expert practitioners including system and software architects, security consultants, penetration testers, vulnerability researchers and specialist systems evaluators. The first involves ranking a series of technical attacks on a system in order of how difficult they are to carry out undetected by the system or its operators. The second requires experts to rate components of attacks in terms of aspects which are thought to contribute to their overall difficulty. In practice, a system is only as secure as its weakest element, i.e., the easiest way in. Identifying which are the weakest aspects of a system, i.e., the easiest ways of attacking it, is thus a highly relevant component of system security assessment, though obviously it does not provide all of the answers. Using this data we demonstrate how technical attack rankings can be derived from the component ratings through aggregation, and compare them with the actual rankings provided by the experts. This is particularly useful in real world assessment, as the method provides the potential for highlighting the most salient attacks for a new system using a database of pre-rated components, reducing the burden on expert resources. Aggregation is achieved using an Ordered Weighted Average (OWA) operator [1]. This allows us to attribute weight based upon the difficulty of compromising or bypassing components, an important aspect of assessment raised by some of the technical experts involved. Choosing OWA weights is not a trivial task, as the solution space is extremely large. In this study we have chosen to use Simulated Annealing (SA) and Evolutionary Algorithms (EAs) to discover suitable weights, as these methods allow us to search a very large solution space, while evaluating only a small fraction of the possible solutions. The paper is structured as follows: Section II provides an overview of the problem of validating the security of software systems, OWA operators, SA, and EAs. Section III describes the decision making exercise conducted with the cyber security technical experts, and Section IV examines the process of OWA aggregation and the implementation of SA and EAs. Sections V and VI provide the results of the analysis and a discussion, and finally, Section VII considers the conclusions
that can be drawn and future work. II. BACKGROUND This section provides an overview of the topics covered in this paper. A. Information System Security The practice of carrying out regular risk assessments (for information systems or otherwise) is a critical part of any organisation’s measures for understanding the threats that face their operation, and the actions that can be taken to eliminate or ameliorate their effects. While risk assessments in other areas have been commonplace for sometime, the need to formally assess risks posed to information systems and computer networks is a relatively recent occurrence for many organisations. Part of the reason for this is the spread of internet usage for an ever increasing number of everyday tasks (e.g., e-government, e-commerce, e-mail, social networking, e-banking and mobile telecommunications). As more of our activities involve the internet, these same activities become vulnerable to attack from malicious agents. Another factor is easily available hardware and software required to compromise software and devices, which can be found on the internet. This reduces the need for technical knowledge, increasing the accessibility of cyber-crime to non-experts. In response to this, many new systems have their security software, devices, architecture and practices assessed before they are implemented in an attempt to prevent unacceptable levels of vulnerability within a system. Naturally, any system can be hacked by an individual or group who have the time, resources and motivation, so the aim of information security risk assessments is not to eliminate all risk (as this is futile), but to assure that there is a proportional level of security in view of the consequences of a successful attack. B. Ordered Weighted Average Discussions with a group of CESG experts generated a hypothesis that the difficulty of a given attack may be determined largely by the component of the attack with the maximum difficulty in terms of bypassing/compromising it without being noticed. However, it became apparent that the use of the maximum or minimum operators in particular produced a lot of equal scores when aggregating components to rate attacks, making the resulting rankings much less meaningful. To help overcome this difficulty an OWA operator [1] was selected as the aggregation method. An OWA allows more weight to be given to the most difficult components of an attack, while still taking into account the other components when rating an attack. This results in a significant reduction in the number of ties obtained, leading to more meaningful rankings. An OWA consists of a set of weights (that add up to 1), and a set of objects. In this case the objects are component ratings. The first step of the OWA is to sort the objects (component ratings) into descending order, in this example the most difficult component will be placed at the start of the list. Then, each of the weights is multiplied by the corresponding
object, the first weight is multiplied by the first object and so on. If the first weight is high (near to one), then the resultant operator is close to a maximum. This weighting will then be reflected in the overall score produced for an attack. In this study we do not restrict the weightings; our search algorithms may find solutions that do not corroborate our hypothesis. OWAs are regularly used to combine sub-components of a problem, producing an overall rating that can be used to aid decision making. For example, in [2] OWA operators are used to aggregate selection criteria in a personnel selection problem, [3] details the use of an OWA to produce an overall indicator of security of energy supply, in [4] performance indicators of small water utilities are combined to produce an overall performance assessment using an OWA operator, [5] describes the use of a fuzzy OWA operator for rating information security products in terms of reduction of information security risk, and in [6] and [7] the authors use modified OWA operators on a financial product selection problem and a football team player selection problem respectively. C. Evolutionary Algorithms Evolutionary Algorithms (EAs) are a popular method of optimisation for problems with very large solution spaces. The most widely used EA method, the Genetic Algorithm (GA) (see [8] and [9]) is a heuristic search technique inspired by evolutionary biology. Selection, crossover and mutation are applied to a population of individuals representing solutions in order to find a near-optimal solution. The GA is able to find suitable solutions to a problem while evaluating a small fraction of the solution space. For problems with an extremely large solution space, this is essential. GA optimisation of OWA weights has previously been demonstrated in [10]. D. Simulated Annealing Like EAs, Simulated Annealing (SA) [11] is inspired by a real-world phenomenon, in this case the process of heating and cooling (annealing) of metals to reduce defects. An initial solution is created, then a neighbouring solution is selected and compared with it. The probability of the algorithm accepting the neighbour as the current solution is based upon a temperature value and the difference in quality between the two solutions. The higher the temperature value, the more likely it is that the algorithm will accept an inferior solution. The process is then repeated using the selected solution as a starting point. Over the course of a run the temperature is gradually decreased, making inferior choices less likely. The aim of this strategy is to avoid the search becoming stuck in a local minima, a problem associated with simpler algorithms such as hill climbing. The authors are not aware of any work in the current literature in which SA is applied to the problem of discovering OWA weights. III. DATA C OLLECTION E XERCISE A key part of this research is the elicitation of opinions from a group of cyber security experts about how difficult it is to
complete attacks and compromise/bypass components for a given system design. The opinions are then used to determine OWA weightings for mapping from component ratings to attack ratings/rankings. Our partnership with CESG gives us a level of access to such experts that would be difficult to attain otherwise. As the National Technical Authority for Information Security in the UK, CESG has access to a cadre of specialist security architects and other technical security experts, and can draw on both public and private sector expertise. A set of thirty nine security professionals from seven groups took part in the main exercise, drawn from a mixture of government and commercial backgrounds. The groups included system and software architects, technical security consultants, penetration testers, vulnerability researchers and specialist systems evaluators. All participants have a high level of expertise, with both breadth and depth of experience. A scenario was created consisting of a system together with various methods, vulnerabilities and attacks, realistic enough to permit reasoned assessment, while being difficult to assess fully, even by leading experts. The scenario was created by a senior member of CESG technical staff and is designed to be representative of a fairly mainstream government system. The system involves a range of core services and back end office facilities together with remote sites and mobile access. Core systems hold the most sensitive business information, with assets rated in terms of their value at Business Impact Level 3 (BIL3) following the standard UK government scheme [12]. This scale rates the impact of an event from BIL0 (no consequences) to BIL6 (catastrophic). The experts were given a presentation by the scenario creator with details and diagrams of the scenario, attacks and their components, and had the opportunity to ask questions about the system. The experts were asked to assume that the software/hardware and frequency of patching was of the typical standard that they came across in their work with this type of government system. They all regularly work with UK government BIL3 systems, and so are aware of associated security policy and how it is typically applied to such systems in terms of component configuration, frequency of anti-virus updates, etc. The first part of the exercise consisted of the experts ranking ten attacks in order of how difficult they thought they would be to carry out without being detected. This activity was conducted in examination-like conditions to ensure that there were no outside influences on the experts opinions. Following this, the second part of the exercise required experts to answer a series of questions about each of the components making up the attacks. The questions were devised in collaboration with CESGs technical experts to determine what the important factors are that contribute to the difficulty of compromising/bypassing components and carrying out attacks. A novel approach to capturing expert opinion and expressing subjective uncertainty was devised that allows participants to make a detailed differentiation between the difficulty of bypassing/compromising a component and their certainty.
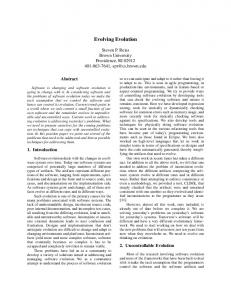
Fig. 1. Interval Response where (a) is a Less Uncertain Response and (b) is a More Uncertain Response
Experts gave their answers as an interval, on a scale of 0 to 100. This was done by drawing an ellipse as shown in Figure 1, which shows two example answers, one more uncertain than the other. The interval is produced using the points where the ellipse intersects the scale. The width of the interval denotes the uncertainty the expert has in their answer, the wider the interval, the less certain the expert is. Using this method, participants are able to impart information about their uncertainty. The experts were divided up, completing the component questions in a number of separate rooms in exam conditions. As there were thirty nine participants and twenty six distinct components in the scenario, with up to eight questions per component, this produced a substantial dataset of around six thousand observations. We believe this scope of data collection and quantity of data collected from highly experienced security practitioners to be unprecedented. IV. DATA A NALYSIS - M ETHODS The analysis conducted involves the data collected regarding the individual components, and potentially relating these to particular attacks. As stated previously, the component rating part of the exercise required experts to answer a series of questions about the twenty six components that make up the ten attacks that were ranked in the first part of the exercise. The result of the exercise was a collection of intervals that describe each experts opinion of a particular aspect of a particular component. For the analysis in this study, we have focused on the means of the intervals given for one question: “Overall, how difficult would it be for an attacker to [successfully bypass/compromise the component]?” This question was designed to elicit one overall difficulty rating for the component, while the other questions focus on specific aspects of that difficulty. In future work, the advantages offered by the interval representation and the complete set of questions for each component will be explored. Each of the twenty six components belongs to one or more of the ten attacks, Table I shows which components belong to each attack. Note that some components are duplicated in a single attack, this is because a particular attack may involve bypassing/compromising the same type of component more than once, for example, an attacker may have to compromise multiple firewalls to reach a target. Using this information, the ratings an expert gave for each component can be used to produce a difficulty value for each attack. In this study, we are using an OWA operator to compute difficulty values for the ten attacks. Table II shows the means of the intervals provided by one expert in response to the ‘Overall’ question for each of the
TABLE I ATTACKS WITH C ONSTITUENT C OMPONENTS Attack 1 2 3 4 5 6 7 8 9 10
Components 2,3,1,4,5 6,7,6,8,4 9 10,11,4,5 12,13,2,3,14,15,4,5 16,16,17,4,5 6,18,4,5 19,20,21 22,23,24 25,26,1,4,5
components of attack 1 (2,3,1,4,5). TABLE II E XPERT ’ S ‘OVERALL’ I NTERVAL M EANS FOR ATTACK 1 Component 1 2 3 4 5
Interval Mean 25.00 40.00 20.50 40.00 70.00
The OWA can then be applied to this set of values to produce an overall score for attack 1. For example, if we wanted to choose an OWA operator that gives more weight to the most difficult hop, our weights could be w = 0.33, 0.27, 0.20, 0.13, 0.07. To apply these to the experts interval means a = 25.00, 40.00, 20.50, 40.00, 70.00, we first sort them by difficulty rating producing the following ordering: o = 70.00, 40.00, 40.00, 25.00, 20.50. We can then compute the OWA by multiplying each weight by the corresponding element in the ordering as shown in (1), where n is equal to the number of weights/components. In this case a value of 46.59 is produced; the mean value is 39.10, showing that this OWA operator has given more weight to higher values of difficulty. OW Aw (a) =
n X
wi oi
(1)
i=1
This procedure can be repeated for each of the attacks, using a given OWA operator. The result is a set of difficulty values for each of the attacks, that can be used to rank them from most to least difficult. Finally, the derived ranking can be compared with the actual ranking given by an expert to validate the OWA operator in question. In these tests OWA operators are applied to multiple experts (two groups of alternate experts, and the overall group) to test their performance. With the two search algorithms we have selected, we can use the comparison of the derived ranking and the actual ranking to rate the fitness of OWA operators. A. Simulated Annealing The SA algorithm is implemented as follows: Solutions are represented using a vector of weights. The maximum number of components in an attack is eight, therefore eight weights are used in solutions. For those attacks that
do not have eight components, their component ratings are padded out with zeros so that there are eight. This avoids the potential for attacks that have fewer components being judged as being more difficult, purely because their weightings are concentrated on fewer components. An attack with more components should be more difficult than an equivalent attack with fewer components. The initial solution is created by generating eight random points on a line from 0 to 1. The weights are the distances between zero, each point and 1. This ensures that the weights will add up to 1. Fitness is determined by comparing each individual’s actual attack ranking with the attack ranking derived from their component ratings using an OWA. Spearman’s Rho is used to rate the correlation between the rankings, and error is calculated by subtracting each Spearman’s Rho value from 1. The mean squared error over all individuals provides a metric for assessing the performance of a particular set of weights. Pertubation is achieved by selecting two weights from a solution, increasing one by a small amount and decreasing the other by the same amount. If either weighting becomes invalid (> 1 or < 0) another two elements are selected. This method ensures that the weights still add up to 1 after perturbation. The temperature is decremented by a specified amount after a given number of tries. The algorithm terminates when the temperature reaches zero. B. Evolutionary Algorithm For the EA, solution representation, initial population generation and fitness evaluation are achieved using the methods described for SA. The mutation operator uses the perturbation method from the SA algorithm, the remainder of the EA is implemented as follows: In parent selection, individuals are sorted by fitness and random individuals are chosen from the population using absolute values over a normal distribution forming a complementary cumulative distribution. That is to say, it is more likely that a lower numbered (and therefore fitter) individual will be chosen, though it is possible for any individual to be chosen. In Elitism the best individuals from each generation are copied into the next generation. This ensures that the best individual in a generation cannot be worse than the best in the preceding generation. A single point crossover is used that takes two parents and creates a child consisting of the first half of the first parent, and the second half of the second parent. To make sure that the weights add up to 1, they are normalised. This allows us to preserve the characteristics of each parent, while maintaining a valid set of weights. The algorithm terminates when a set number of generations have elapsed. V. DATA A NALYSIS - R ESULTS The next step is to conduct a series of tests with each search algorithm. Initially, these experiments are used to determine
TABLE IV SA: T EST S ET 1 - B EST R ESULTS Test Even 10 - 11 12 - 16 Odd 12 All 12 - 16
Best Weights 4 5
Mean Sp.
MSE
1
2
3
6
7
8
0.6815 0.6815
0.1454 0.1454
0.89 0.88
0 0
0.04 0.04
0.01 0.01
0.01 0.01
0.03 0.03
0.01 0
0.01 0.03
0.5643
0.2583
0.78
0.01
0.14
0.05
0.01
0.01
0
0
0.6154
0.2105
0.95
0
0.03
0.01
0
0
0
0.01
TABLE V SA: A PPLICATION OF B EST W EIGHTS TO A LTERNATE G ROUP Test Mean Sp. MSE 1 Best ‘even’ weights applied to ‘odd’ 10-11 0.5128 0.3147 0.89 12-16 0.5128 0.3147 0.88 Best ‘odd’ weights applied to ‘even’ 12 0.5846 0.2533 0.78
3
0 0
0.04 0.04
0.01 0.01
0.01
0.14
0.05
TABLE III SA: T EST S ET 1 Test 1 2 3 4 5 6 7 8 9 10 11 12 13 14 15 16 17 18 19
Temp. 1 0.9 0.8 0.7 0.6 0.5 0.4 0.3 0.2 0.1 0.05 0.025 0.01 0.5 × 10⁻² 0.25 × 10⁻² 0.1 × 10⁻² 0.5 × 10⁻³ 0.25 × 10⁻³ 0.1 × 10⁻³
Weights 4 5
2
Dec. 1.0 × 10⁻² 0.9 × 10⁻² 0.8 × 10⁻² 0.7 × 10⁻² 0.6 × 10⁻² 0.5 × 10⁻² 0.4 × 10⁻² 0.3 × 10⁻² 0.2 × 10⁻² 0.1 × 10⁻² 0.5 × 10⁻³ 0.25 × 10⁻³ 0.1 × 10⁻³ 0.5 × 10⁻⁴ 0.25 × 10⁻⁴ 0.1 × 10⁻⁴ 0.5 × 10⁻⁵ 0.25 × 10⁻⁵ 0.1 × 10⁻⁵
an appropriate configuration for each of the methods. Configurations have been chosen to result in a similar number of evaluations to avoid favouring any particular method or configuration. Experiments have been conducted on three groups of individuals: ‘odd’ (i.e., the 1st, 3rd, 5th,... individuals), ‘even’ (i.e., the 2nd, 4th, 6th,... individuals) and ‘all’ individuals. The reason for this is that after tuning the weights with 50% of the overall group, we can then test these weights to see how they perform on unseen individuals in the remaining 50% of the group. The group containing all individuals will give an indication of the best that can be found using the selected search algorithms for the entire group. A. Simulated Annealing In the first set of tests, a series of configurations are experimented with, with the goal of discovering an ideal
6
7
8
0.01 0.01
0.03 0.03
0.01 0
0.01 0.03
0.01
0.01
0
0
configuration for further testing. Table III provides the configurations tested, and Table IV shows the best results for each group. All of the tests were conducted for 625 tries at each temperature with a random seed of one. The results of the tests show that those starting with smaller temperatures, and making smaller decrements produce OWA operators that make the best mapping from component rating to attack ranking. Within the tests for each group there isn’t a great deal of variation in the quality of the OWAs produced. The results plateau towards the end of the ‘Even’ and ‘All’ group tests, while a single configuration produces the best results with the ‘Odd’ group. All of the best results show a heavy bias towards the first and most difficult component, giving weight to our hypothesis that these are the most important when assessing the danger posed by specific attacks. 1) Alternate Group Weightings: Following this, the best configurations for each set of tests were used to conduct further tests. First, the best weightings found for the ‘even’ data set were used on the ‘odd’ data set and vice versa. The purpose of this test is to discover whether the solutions found are general enough to be applied to unseen individuals. Table V shows the results of applying the best weights with the ‘odd’ and ‘even’ groups on the alternate group. The test numbers are those of the tests that produced these weightings in the previous experiments. The results of these tests show that there are clear differences in the solutions found for each group. While the results of applying the best OWA found with the ‘even’ and ‘odd’ groups are relatively good, they are worse than those produced by the OWA operator discovered using their own data. One reason for this could be that that the SA algorithm has slightly overfitted the OWAs to a specific group of people. Finding a general set of weights that can be applied to unseen data is an important part of this study, as one of our goals is to be able to use pre-rated components to rank/rate new attacks on proposed systems.
TABLE VIII EA: T EST S ET 1 - B EST R ESULTS Test Even 3 Odd 1 All 1 2
MSE
1
2
3
0.6866
0.1425
0.8985
0.0059
0.0311
0.0102
0.5713
0.2543
0.7872
0.0185
0.1242
0.6159 0.6159
0.2069 0.2069
0.9582 0.9621
0.0028 0.0017
0.0242 0.0221
TABLE VI SA: E XTENDED T ESTS Max Sp. 0.6175 Max MSE 0.2157
Min Sp. 0.6076 Min MSE 0.2084
Mean Sp. 0.6143 Mean MSE 0.2105
Std. Dev. Sp. 0.0024 Std. Dev. MSE 0.0019
TABLE VII EA: T EST S ET 1 Test 1 2 3 4 5 6 7 8 9 10
Best Weights 4 5
Mean Sp.
Copy 0.00 0.20 0.40 0.60 0.79 0.50 0.30 0.20 0.10 0.00
Cross. 0.20 0.20 0.20 0.20 0.20 0.00 0.40 0.60 0.80 0.99
Mut. 0.79 0.59 0.39 0.19 0.00 0.49 0.29 0.19 0.09 0.00
6
7
8
0.0065
0.0258
0.0037
0.0184
0.0505
0.0111
0.0032
0.0029
0.0024
0.0003 0.0003
0.0057 0.0045
0.0029 0.0059
0.0002 0.0009
0.0056 0.0025
conducted with a random seed of one. 1) Test Set 1 - Evolutionary Operators: Table VII shows the configurations tested and Table VIII provides the best results for each group. For each of these tests a population of 250 individuals is used over 250 generations, with 1% elitism. In comparison to the SA tests, fewer configurations produce results with the same MSE, also there is more variety in quality between the best OWAs found in the tests. This may be because the configurations are more different to one another, or that the EA is more sensitive to its setup. For all groups, the earlier tests result in the best solutions, when there is a small amount of crossover and large proportion of mutation. The copy operator does not appear to have much influence on the results, though this may be because the best individuals from each population are automatically copied to the next generation through elitism. TABLE IX EA: T EST S ET 2
2) Extended test: One of the configurations that produced the best results on the ‘all’ group (Test 12) is replicated thirty times with differing random seeds to give an idea of the variation in results, and for comparison with the results of the EA search. Table VI shows the results of using the best weights from the ‘all’ group over thirty tests, including the mean of the Spearman’s Rhos and MSEs and the standard deviation. There is little difference in the quality of solutions produced by SA using the different random seeds, suggesting that the search is relatively robust. For the fitness measure (MSE) the different between the largest and the smallest is just 0.0073, and the standard deviation is a further indicator of stability. For the Spearman’s Rho values the results are similar, as we might expect. Looking at the actual weighting produced by each of the thirty tests, it can be seen that the algorithm consistently finds solutions that give almost all (≥ 0.92) of the weight to the most difficult component, again providing corroboration for our hypothesis. B. Evolutionary Algorithm Initially, two separate sets of testing are conducted with the EA, one focusing on the proportion of each evolutionary operator, and the other assessing the effect of altering the ratio of population to generations. Each stage has been conducted with the ‘odd’, ‘even’ and ‘all’ groups. These tests were
Test 11 12 13 14 15 16
Gens. 50 100 200 300 400 500
Pop. 1250 625 315 210 155 125
2) Test Set 2 - Population and Generations: The best configuration from the previous set of tests for each group was used with a variety of generations/population combinations. Table IX provides the configurations tested and Table X provides the results. In the previous tests on the ‘all’ group two configurations were tied for the lowest MSE. Both configurations were used in this set of tests, the (best) result shown in Table X was achieved using the setup from test 2 in the previous set of tests. In these tests there is less variation in the results, as we might expect, altering the configuration has more of an effect on the results than changing the ratio of populations to generations. As was seen in the SA tests, all of the solutions found with the EA have a large bias towards the most difficult component, with very little weight being attributed to the remaining components. 3) Alternate Group Weightings: Like the SA tests, the next stage examines how the best weights for one group perform on the other. Table XI shows the results of applying the best
TABLE X EA: T EST S ET 2 - B EST R ESULTS Test Even 12 13 Odd 13 16 All 15
Best Weights 4 5
Mean Sp.
MSE
1
2
3
6
7
8
0.6885 0.6866
0.1421 0.1421
0.8907 0.8899
0.0011 0.0044
0.0323 0.0297
0.0120 0.0126
0.0070 0.0078
0.0174 0.0242
0.0035 0.0030
0.0359 0.0284
0.5732 0.5733
0.2519 0.2519
0.7858 0.7854
0.0223 0.0246
0.1285 0.1248
0.0471 0.0479
0.0115 0.0117
0.0031 0.0033
0.0015 0.0001
0.0002 0.0021
0.6165
0.2080
0.9456
0.0022
0.0296
0.0006
0.0068
0.0011
0.0086
0.0055
TABLE XI EA: A PPLICATION OF B EST W EIGHTS TO A LTERNATE G ROUP Weights Test Mean Sp. MSE 1 Best ‘even’ weights applied to ‘odd’ 12 0.5228 0.3013 0.8907 13 0.5146 0.3118 0.8899 Best ‘odd’ weights applied to ‘even’ 13 0.5915 0.2381 0.7858 16 0.5947 0.2337 0.7854
2
3
4
5
6
7
8
0.0011 0.0044
0.0323 0.0297
0.0120 0.0126
0.0070 0.0078
0.0174 0.0242
0.0035 0.0030
0.0359 0.0284
0.0223 0.0246
0.1285 0.1248
0.0471 0.0479
0.0115 0.0117
0.0031 0.0033
0.0015 0.0001
0.0002 0.0021
weights from the ‘odd’ and ‘even’ groups on the alternate group. Again, a similar pattern to that which was seen in the SA tests can be seen. While the results are relatively good, they are not as good as those seen in the previous tests with the same weights. 4) Extended test: Finally, the best result from the ‘all’ group is replicated thirty times with differing random seeds to give an idea of the variation in results, and for comparison with the results of the SA search. Table XII shows the results of using the best weights from the ‘all’ group over thirty tests, including the mean Spearman’s Rho, mean MSE and the standard deviation. TABLE XII EA: E XTENDED T ESTS Max Sp. 0.6200 Max MSE 0.2137
Min Sp. 0.6104 Min MSE 0.2057
Mean Sp. 0.6150 Mean MSE 0.2092
Std. Dev. Sp. 0.0022 Std. Dev. MSE 0.0020
The results of the extended test show that the results are relatively stable. There is little difference between the maximum and minimum MSE (0.0080), and looking at the individual sets of weights it can be seen that they are all very similar. All solutions produced in this extended run of tests placed a weight greater than 0.92 on the first (most difficult) component. VI. D ISCUSSION The outcome of the experiments is that we have shown that EAs and SA are appropriate methods of tuning OWA weights for this type of cybersecurity problem. The results also suggest that our hypothesis regarding the method of decision making employed by experts, i.e. they look at the most difficult component of an attack first and then assign lower importance
to the remaining components, is true as both methods found solutions matching this pattern. Table XIII shows a more detailed examination of the results for the best OWA operators found using each method, from EA test 2 and SA test 12; for comparison the results when rankings are created using the arithmetic mean of component ratings are included as a benchmark. The table shows that the search methods employed produced a comparatively robust search, as both the MSEs and the standard deviation in the Spearman’s rhos are lower with the discovered OWA operators than with the mean. This suggests that while the mean may work well for some individuals, the OWA operators found using EAs and SA provide a more stable output when they are applied to a group of individuals. In practice, this is an important advantage as clear and consistent advice is key to successful assessments of proposed information systems. TABLE XIII M ETHOD C OMPARISON SA Max Sp. 0.9394 Max Error 0.8485
Min Sp. 0.1515 Min Error 0.0606
Mean Sp. 0.6154 MSE 0.2105
Std. Dev. Sp. 0.2502 Std. Dev. Error 0.2502
EA Max Sp. 0.9394 Max Error 0.8485
Min Sp. 0.1515 Min Error 0.0606
Mean Sp. 0.6159 MSE 0.2068
Std. Dev. Sp. 0.2436 Std. Dev. Error 0.2436
Mean Max Sp. 0.9636 Max Error 1.4182
Min Sp. -0.4182 Min Error 0.0364
Mean Sp. 0.6335 MSE 0.2312
Std. Dev. Sp. 0.3112 Std. Dev. Error 0.3112
The difference in performance between the methods is
0.30
0.8
0.28
0.7
0.24
0.26
MSE
0.6 MSE
0.5 0.4
0.22
0.3 0.2 0
10000
20000
30000 Iterations
(a)
40000
50000
60000
0
50
100
150
200
250
Generations
(b)
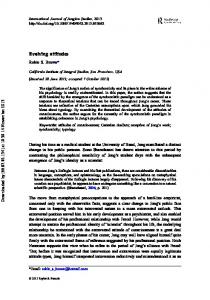
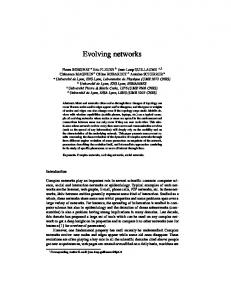
Fig. 2. Example plots from the best performing configurations for (a) EA and (b) SA
minimal, with both methods consistently finding solutions achieving similar MSEs and standard deviations. It should be mentioned however that the EA produced these results much quicker, as it carries out evaluation, and performs evolutionary operations on many individuals at the same time, whereas the nature of SA means that it performs these tasks in a serial manner. For example, one of the EA tests that produced the best result (test 2, which includes all evolutionary operations) took approximately 1 hour and 22 minutes to complete on a laptop equipped with an Intel i3 2.53GHz dual core processor and 4GB RAM. The test that produced the best result in the SA tests (test 12) took approximately 2 hours and 41 minutes, almost twice as long. In both of these tests 625,000 individuals are evaluated. Another outcome of the experiments, illustrated in Figure 2 is that the majority of the improvements in solutions found by the algorithms happen early on in the search, particularly in the case of SA. It could be decided that the benefit gained from allowing these to run for many iterations/generations is not worth the extra processing time. In both cases a result close to that found by the end of the search can be achieved in significantly less time. VII. C ONCLUSIONS AND F UTURE W ORK In this research we have shown how an EA and SA can be used to search for suitable OWA weights for a cyber security problem. Data collected from thirty nine experienced cyber security professionals from various sections of the community (including public and private sectors) has been used to demonstrate how a tuned OWA can be used to aggregate ratings of components of attacks to produce overall ratings and rankings for attacks. These rankings are particularly useful in the real world when assessing systems in their design stage, as they provide an overview of the most salient attacks, and can be used to aid experts in their decision making. It has been established that both methods offer a robust search finding solutions that are more consistent than the arithmetic mean, and that there is little difference in performance between an EA and SA in terms of MSE. However, the EA achieved the results in a much shorter time frame.
Searches could also be completed more quickly by curtailing the number of generations/iterations performed. Both methods found solutions close in quality to their final best solutions in a fraction of the overall run time. There are a number of avenues of possible further work, these include: • Extending the aggregations to include all of the data provided for the ‘Overall’ question. That is, use the left and right end points of the intervals, incorporating more information into the aggregation. • Taking into account the other questions asked about each component, these could provide valuable information for rating components and the attacks they are part of. • Expanding aggregation to include the opinions of multiple experts on the multiple components for an attack. • Constructing a database of expert ratings of generic components for use in rating/ranking unseen attacks on proposed system designs. ACKNOWLEDGEMENT We gratefully acknowledge the role of CESG in financially supporting this work, and would particularly like to thank the CESG cyber security experts who gave their time and expertise in the data collection exercise. This work was part funded by RCUK’s Horizon Digital Economy Research Hub grant, EP/G065802/1. R EFERENCES [1] R. Yager, “On ordered weighted averaging aggregation operators in multicriteria decisionmaking,” Systems, Man and Cybernetics, IEEE Transactions on, vol. 18, no. 1, pp. 183–190, 1988. [2] L. Can´os and V. Liern, “Soft computing-based aggregation methods for human resource management,” European Journal of Operational Research, vol. 189, no. 3, pp. 669–681, 2008. [3] A. Badea, C. Rocco S, S. Tarantola, and R. Bolado, “Composite indicators for security of energy supply using ordered weighted averaging,” Reliability Engineering & System Safety, vol. 96, no. 6, pp. 651–662, 2011. [4] R. Sadiq, M. Rodr´ıguez, and S. Tesfamariam, “Integrating indicators for performance assessment of small water utilities using ordered weighted averaging (owa) operators,” Expert Systems with Applications, vol. 37, no. 7, pp. 4881–4891, 2010. [5] Y. Imamverdiev and S. Derakshande, “Fuzzy owa model for information security risk management,” Automatic Control and Computer Sciences, vol. 45, no. 1, pp. 20–28, 2011. [6] J. Merig´o and A. Gil-Lafuente, “New decision-making techniques and their application in the selection of financial products,” Information Sciences, vol. 180, no. 11, pp. 2085–2094, 2010. [7] ——, “Decision-making in sport management based on the owa operator,” Expert Systems with Applications, vol. 38, no. 8, pp. 10 408–10 413, 2011. [8] J. Holland, Adaptation in natural and artificial systems: an introductory analysis with applications to biology, control, and artificial intelligence. Ann Arbor: University of Michigan, 1975. [9] D. Goldberg et al., Genetic algorithms in search, optimization, and machine learning. Addison-Wesley Reading Menlo Park, 1989. [10] D. Nettleton and V. Torra, “A comparison of active set method and genetic algorithm approaches for learning weighting vectors in some aggregation operators,” International journal of intelligent systems, vol. 16, no. 9, pp. 1069–1083, 2001. [11] S. Kirkpatrick, C. Gelatt Jr., and M. Vecchi, “Optimization by simulated annealing,” Science, vol. 220, no. 4598, pp. 671–680, May 1983. [12] CESG, “Extract from HMG IA Standard No.1 Business Impact Level Tables.” retrieved on 19th November 2012. [Online]. Available: http://www.cesg.gov.uk/publications/Documents/business impact tables.pdf