as Avionics Full-Duplex Switched Ethernet (AFDX) have a low failure rate which ... We cannot, of course, apply network calculus to a network until we have a ..... The current work has allowed the search free reign in configuring networks ... In Proceedings of the 8th Asia Pacific Symposium on Intelligent and Evolutionary.
Evolving Robust Networks for Systems-of-Systems Jonathan M. Aitken, Rob Alexander, Tim Kelly, and Simon Poulding Department of Computer Science, University of York Heslington, York, UK {jonathan.aitken,rob.alexander, tim.kelly,simon.poulding}@york.ac.uk
Abstract. Software systems that rely on ad-hoc networks are becoming increasingly complex and increasingly prevalent. Some of these systems provide vital functionality to military operations, emergency services and disaster relief; such systems may have significant impact on the safety of people involved in those operations. It is therefore important that those networks support critical software requirements, including those for latency of packet transfer. If a network ceases to meet the software’s requirements (e.g. due to a link failure) then engineers must be able to understand it well enough to reconfigure the network and restore it to a requirement-satisfying state. Given a complex network, it is difficult for a human to do this under time pressure. In this paper we present a search-based tool which takes a network defined using the Network Description Language (NDL), annotated with a set of network-hosted applications and a set of latency requirements between each. We then evolve variants of the network configuration which meet the requirements and are robust to single link failures. We use network calculus tools to get a fast, conservative evaluation of whether a given network meets its requirements. We demonstrate that this approach is viable, designs networks much faster than a human engineer could, and is superior to a random generate-and-test approach. Keywords: network calculus; systems of systems; network enabled capability; genetic algorithms
1
Introduction
Many software systems are distributed across a network, and rely on that network having certain properties, such as adequate bandwidth provision and acceptable latency. This is particularly true in a Network Enabled Capability (NEC) System of Systems (SoS) where the networked software is used to coordinate the real-world actions of teams and organisations. For example, in a disaster relief scenario where a network is quickly set up to co-ordinate a response to flooding, conditions on the ground will rapidly change, and it is highly likely that network links will be compromised. Yet operation co-ordinators will
2
Aitken, Alexander, Kelly and Poulding
rely on the network to provide information under all conditions, for example to direct rescuers to critical areas. Any loss of this information could lead to misdirecting rescuers to irrelevant or overly dangerous areas. The network has thus taken on an important safety role. Many network problems (e.g. unacceptable latency between two nodes) can be solved by reconfiguration, particularly if new links can be added. However, as the SoS grows (perhaps organically, while deployed), reconfiguration becomes a more complex task. First, a repair attempt motivated by problems with one service may inadvertently compromise another service. Second, a repair may succeed in the short term, but leave the network in a perilous condition where one more failure could lead to a serious network outage. A real world example of the danger of operating with a marginal network ¨ can be seen in the Uberlingen mid-air collision [14], where air-traffic controllers unknowingly relied on a network that provided them with no connection to the outside world. It was thus impossible for other air-traffic stations to warn the controllers that they had set two aircraft on a collision course. In this paper, we describe our initial work on a search-based method that can design networks that robustly support a set of software applications with strict latency requirements. The main question for our research is “is it possible to produce a software tool that evolves reconfigurations of a given network (built using Commercially available Off-The-Shelf (COTS) technology) to fix an inability to meet a delay requirement, e.g. as a result of link failure, while taking account of the robustness of the resultant network against future failures?” 1.1
Contributions
The main contributions of this paper are to present our method for evolving reconfigurations of robust networks, and to demonstrate that our method can: – Create viable networks far faster than is conceivable for a human engineer – Outperform random search – Take account of factors that matter for safety (e.g. robustness to link failure) and practicality (e.g. network complexity) to produce feasible solutions
2 2.1
Background Hardening Networks
Elia et al. [9] review various modifications to standard Ethernet that are designed to ‘harden’ it against various types of failure and hence make it more reliable (specifically, they bring it up to the level required by the safety-critical electronics standard IEC-61508). Unfortunately, those protocols place many restrictions on how networks can be configured, which make them impractical for ordinary deployments using mainstream software. Given the above, the work described in this paper concentrates on what can be achieved with mainstream equipment and protocols. Advanced protocols such
Evolving Robust Networks for Systems-of-Systems
3
as Avionics Full-Duplex Switched Ethernet (AFDX) have a low failure rate which enables it to be used to satisfy a 1 × 10⁻⁹ per hour dangerous failure rate for critical systems [17]. This is a reasonable target for many safety-critical functions (where their failure may cause a serious accident without any other failure in the system). In our work, however, we are not concerned with such critical functions — we are concerned with cases where the network is only one part of the safety mitigation in the SoS, where a failure rate several orders of magnitude higher might be acceptable. We refer to these as safety-related systems. 2.2
Assessing Network Latency Performance
Skeie et al. [19] suggest two possible methods for assessing the performance of a network — network simulation and network calculus. Simulation techniques (such those implemented by the ns2, ns3 and OMNeT++) provide highly detailed representations of the network that follow each packet as it is transmitted through a complete virtual network including routing tables. This produces a wealth of information about the characteristics of the network, but takes considerable computational effort to get statistical confidence in the results. More importantly, these simulation packages do not produce any guarantees about the latency-characteristics on the network; each run provides a selection of the possible latencies that may be measured within the network. There is no guarantee that the simulation will exercise all corner cases in a given run (or indeed set of runs), and therefore worst-case scenarios may be overlooked. In order to develop a network model that can provide hard guarantees about latency, Cruz and others developed Network Calculus [6, 7]. This mathematical technique calculates a hard bound on latencies, buffer allocations and throughput. Network Calculus is less demanding on computation time than packet-based simulation packages and therefore “can be suitable for online assessment” [19]. Network traffic is generated from source nodes and flows through to sink nodes via a path passing through intermediate routing points. Whenever one flow crosses another (for example by sharing an output or input port) it creates interference that can increase latency. Network calculus represents these flows using arrival curves which represent the data travel within the network. Traffic at various points in the network is bounded by the “leaky bucket” function, b(t) = σ + ρt, where b(t) is an upper bound of the traffic generated based on σ the maximum burst size and ρ the sustainable data rate. Tool kits now exist that provide good solutions to these equations, allowing worst case delays to be calculated. Boyer [4] presents an overview of the available tools that implement network calculus. The DISCO [16] tool has been selected for use in this paper. DISCO allows the creation of service curves and provides a high degree of flexibility, including different methods for flow analysis. It provides an API written in Java allowing for easy integration with other components. The model of the network used by network calculus is much simpler than simulators such as OMNeT++. The representation consists of a basic network topology, link capacities, sustainable data rate (in bits per second) and a maximum packet size in bits. This is a significant abstraction of the network, but it
4
Aitken, Alexander, Kelly and Poulding
is sufficient for basic network modelling including periodic and periodic sources. In addition, the leaky bucket is a simple equation that does not consider data bursts; it assumes the maximum data burst at all times. This is suitable for safety-related work, as it does cover worst-case scenarios. Here, we have only given the briefest of introductions to network calculus; fuller explanations can be found in [3, 6, 7]. The technique has been used successfully to find guaranteed delivery times for the AFDX protocol [5, 15] running on large and complex networks with interference between different data streams. 2.3
Representing Network Configurations in a Machine-Readable Way
We cannot, of course, apply network calculus to a network until we have a representation of the network in human and machine-readable form. NDL [20] provides such a representation, and as it is defined in Extensible Markup Language (XML) and based on the Resource Description Framework (RDF). Whilst NDL has primarily been targeted at optical networks, the schemas are portable to wired and wireless topologies. NDL was developed to represent ad-hoc hybrid networks, helping users understand the likely behaviour of the network and thus be able to modify it to get the macroscopic behaviours they desire. The focus on ad-hoc networks makes NDL naturally applicable to SoS networks, where a key goal is reconfigurability — the aim is to provide a flexible network with many potential configurations that support different operations and different capability configurations. On a practical level, NDL breaks down the network into a bi-directional graph. This representation is of the form used by the DISCO tool, allowing direct coupling of Network Calculus to NDL. 2.4
Evolving Networks
We are not the first to use evolutionary algorithms to generate networks. Leu et al. [12] search for optimal network configurations for large networks, with a trade-off between robustness (where the number of paths between nodes is increased at the expense of a densely connected graph) and cost (where the number of connections is limited at the expense of robustness). They define fitness functions that either produce dense robust networks, or sparse networks, but not hybrids. They do not consider satisfaction of latency requirements. Georges et al. [10, 11] use network calculus as a tool to evaluate the performance of switched networks. In [11] they couple network calculus with a genetic algorithm to create a network configuration that is capable of meeting a requirement under worst case performance. However, this work takes no account of the robustness of the network created (its resilience to failures and disruptions). George et al. are interested in evolving a tree-like network structures that minimises cabling distances but leave one path between end nodes; in contrast, we are interested in developing mesh networks which are more representative of the networks used in SoS where end-to-end connections often need to share links.
Evolving Robust Networks for Systems-of-Systems
5
Ali et al. [1] evolve networks to meet Quality of Service constraints such as latency, but do not consider the robustness of the network to component failure. Newth and Ash [13] do consider the robustness of the networks they generate, but their focus is on power distribution networks rather than data networks. Ducatelle et al. [8] investigate techniques to mitigate against failure events in wireless and optical networks. They acknowledge that faults occur regularly, and therefore dependability is a key concern, especially in wireless ad-hoc networks. They develop a two-stage algorithm. The first stage verifies that a solution is possible. The second stage optimises a set of constraints, such as capacity using a simulated model. A routing algorithms is then used on the simulated model (similar to an Ant Colony Optimisation) to discover routes and calculate their latency. This provides some of the information needed for our purposes, but only measures average latency rather than the worst case information offered by network calculus, and does not optimise the network to ensure that the latencies are acceptable.
3
Proposed Approach for Evolving Robust Networks
We have combined several tools and technique in a combination that: – provides an abstract model of connections and individual nodes so that it is applicable to a wide range of networks and technologies – performs worst case analysis to provide assurance that requirements can be met in that system configuration – generates robust networks without single point failures 3.1
Robustness
Ideally, we would like to evolve a network that supports all aspects of dependability, including availability, safety and maintainability, as defined by Aviˇzienis et al. in [2]. For this work we have limited ourselves to a simpler notion of robustness, which we define informally to mean ‘the ability of the system to meet its requirements under a range of representative failure conditions’. The requirements we are concerned with are (a) the ability of each safety-related service to work at all (to make the connections that it needs) and (b) for such services to get a tolerable level of network latency (each service specifies a maximum endto-end delay that is acceptable to it). We follow Georges et al. [11] in treating the latency specification as a hard deadline which must not be exceeded. We take a simple view of failure, considering only total failures of single links within the network. Ducatelle et al. [8] notes that link failures are frequent in deployed networks, being considerably more frequent than node failures. They are therefore sufficient for this initial study. A network configuration is highly robust (for a given set of services running over that network) if all the services can get the connections they need with the latency they specify under all possible single-link failures. A configuration that does not give the connections and latencies that are needed under some proportion of single-link failures is proportionally less robust.
6
3.2
Aitken, Alexander, Kelly and Poulding
Process Overview
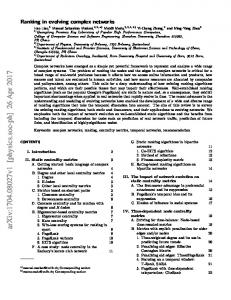
The process we use to evolve network configurations has four basic components, shown in slightly more detail in Figure 1(a). We start from a representation of the available network components (nodes and possible connections) and our software system (applications, node assignments and latency requirements) that is understandable to both humans and computers. We have adopted NDL for this purpose; details are in Section 4.1. Once we have our description of the available components, we need to generate a range of candidate network designs. We therefore convert our NDL description into a genome, where each gene is a pair of integers describing a connection from one network port to another. This representation can be mutated (starting from the base case of a completely unconnected network) to generate new candidates as part of a search process, and as also suitable for crossover. The genome is explained in Section 4.2. Each candidate design needs to be evaluated to assess whether it meets the robustness criteria defined in Section 3.1, given the latency requirements of the software system. As noted in Section 2.2, we use the DISCO network calculus tool to perform this evaluation. As well as evaluating the candidate in its default state, we also evaluate it for each possible single-link failure, and produce a robustness measure that combines all this information. Section 4.3 explains this in more detail. Now that we have a way to generate candidates and assess their robustness, it is possible to search for acceptable networks. We use a genetic algorithm as implemented by Java Evolutionary Computation Toolkit (ECJ), with the core of the fitness function being a measure of the robustness of the network. It is easy, however, to create a robust network by using many redundant connections, which will be expensive. We have therefore introduced an additional fitness term that steers the search towards smaller networks. Section 4.4 explains how the search and fitness function are implemented.
4
Implementing the Process
Our implementation of the process uses a number of different software tools; the tools and their interaction is shown in Figure 1(b). The NDL library (supported by the RDF library) imports the model from the human-editable description, ECJ performs the evolutionary search, and the Java Universal Network/Graph and DISCO frameworks perform the network representation and analysis. 4.1
Describing the Network
The configuration of the network is described using NDL. NDL describes devices in terms of: name (ndl:Device), latitude (geo:Lat), longitude (geo:Long) and a list of interface ports (ndl:hasInterface). An NDL Python parser is used to import the information into a machine readable form. This creates a description of the network devices and internal
Evolving Robust Networks for Systems-of-Systems
Java Code
Represent network in NDL
Network Java Interface Representation for NDL Reader Network Representation
Generate candidate network designs
Perform mapping to network calclulus form
NDL Reader
RDF Library
Candidate Solution Java Universal Network/Graph Framework
Create graph-based solution formed from NDL and candidate network design
Adjust candidate connections list - remove link
Python Code
Support for Reading RDF Files
ECJ Remove parallel and partial connections within the genome
7
*Modify Candidate Solution Removing a Link (Process) For each solution
DISCO Tool Network Calculus
Fitness of Candidate Solution
Perform network calculus analysis
Graph Based Representation of Candidate Solution
Latency of Connections & Performance with Link Removal Fitness Eval. on Link Removal & Latencies
All single failure points proccessed
Evaluate fitness of solution
All solutions in generation processed
(a) Evolutionary Process Overview
(b) Overview of Tool Integration
Fig. 1. Process and Implementation Overview
connections. This also contains a list of all possible interface ports within the network, extracted from each of the individual device descriptions in the NDL. Given the geographical information provided by NDL, the latencies of any given connection be calculated using the Haversine formula [18] to determine crow-flies cabling lengths (adjusted using a scaling factor of 1.5, to allow for deviations or extensions), and assuming a propagation velocity of two-thirds the speed of light.
Expanding NDL for Our Chosen Scenario We have expanded the standard NDL description to represent applications that produce and consume User Datagram Protocol (UDP) video streams. These video streams prove readily analysable using the DISCO tool, as they contain fixed transmission rates and packet sizes. We have added the following fields to a standard NDL description of a network: – ndl:hasVideoServer - represents a video server present at the node, giving a reference name. – ndl:hasVideoServerConnection - represents a video server client present at the node, giving a reference name.
8
Aitken, Alexander, Kelly and Poulding
Each ndl:hasVideoServer is linked to a ndl:VideoServer instance, by reference name, which describes the stream properties: – The time between packets - ndl:videoServerWaitInterval. – The packet data size - ndl:videoServerPacketLength. – The packet data content - ndl:videoServerContentLength. Each ndl:hasVideoServerConnection is linked to a single instance of a ndl:VideoServerConnection which describes the nature of the connection at the sink end, containing: – The name of the server to which the client is connected ndl:applicationToServerConnection. – The latency requirement - ndl:maxDelay. 4.2
Generating and Interpreting the Genome
We use a Genetic Algorithm (GA) comprised of individuals whose genotype is a 1250 gene sequence. Each gene is a pair of integers describing a connection from one port to another. The length of the genome limits the possible number of connections possible, it has been chosen to provide space for junk connections which allow the network to expand and contract the number of links. Each integer maps to one of p possible port names specified within the NDL. The integer values run from −1 to p − 1, where −1 represents no connection. When the NDL is parsed a table is made which maps these integers to physical port names; the genome is interpreted by performing lookups on this table. 4.3
Generating and Analysing the Network Model
After generating the genome for a candidate configuration, an initial filter is applied — this ensures that the network can be analysed by DISCO. This filter uses the following criteria: – Double connections from one port - each port can only have one connection. – Parallel connections between devices - the standard network calculus algorithms do not allow parallel wiring of devices. (Parallel wiring is a valid method to solve robustness problems, although it is not ideal as any environmental condition that causes a link failure may be common mode to both; for example, in a wired network a digger may cut a cable or in a wireless network a source of electromagnetic interference. We will consider ways to support parallel wiring in future work.) – Disconnected source or sink nodes — DISCO requires that each source and sink node is connected to at least one other node. Once through this initial filter, the connection list is made bi-directional before the Java Universal Network/Graph (JUNG) Framework is used to create a in-memory graph representation of the separate nodes and connections. Analysis
Evolving Robust Networks for Systems-of-Systems
9
is carried out on the graph based model using the DISCO tool which applies network calculus to derive the worst-case latencies (using Open Shortest Path First (OSPF) to calculate routes) on each flow specified by the NDL. Our system then repeats this analysis for each single-failure variant of the network; here, each failure is a failure of a (bi-directional) link. This provides: – The worst-case performance of the network under all single point failures. This is expressed as the amount of headroom that is available on each flow when the worst-case delay is compared to the specification — the difference between the latency required and the latency achieved. A negative headroom indicates a failure to meet the requirement. – The number of single-failure cases that completely fail to provide some required connection For a network to be considered robust, all of the services must have the connections that they require within their specified latency under any possible single-link failure. 4.4
Search Algorithm
We used the Evolutionary Computation for Java (ECJ) as a harness for a GA to perform the search functionality. The GA has a population size of 2000 and uses a tournament selection of size 10, crossing over the best individual within the population with the best from the tournament. Mutation then occurs on each gene within the child with a probability of 0.1. When mutation occurs it changes the destination of the connection to either be one from the list specified within the NDL (0 to p − 1) or to become not connected (−1). Fitness Function When evaluating a networks for robustness under our case study situation, four criteria stand out as particularly important: 1. Can represented in, and analysed by, the DISCO tool. 2. Is tolerant to single-point failures. 3. Meets timing constraints for every flow in the network under all single point failure conditions. 4. Contains as few connections as possible. This can be represented as a multi-objective fitness function that is composed of four separate components. Some of these components are simply attributes to be optimise, but others form hard constraints; for example, in order for a network to be robust under the criteria in Section 3.1 it must meet points 2 and 3 in the list above. A network cannot, therefore, merely not be evolved to contain as few connections as possible, as it may fail timing constraints or be intolerant to single-point failures. Each of the objectives is represented by a simple equation that must be maximised in order to produce a network that meets the robustness criteria. The fitness functions for each attribute are shown in a corresponding order in Equations 1-4.
10
Aitken, Alexander, Kelly and Poulding
f itness(0) =
X
nsink ,nsource
1 csinksource
nmissedcases f itness(1) = 1 − ntotalcases ( Htotal if all specified latencies met f itness(2) = 0 otherwise ( starting point, large, network found 1 − ccnetwork initial f itness(3) = 0 otherwise
(1) (2) (3) (4)
Equation 1 represents connections between the sources and sinks, where csinksource represents the number of sinks and sources within the network. Maximising this ensures that all sources and sinks are connected. In the case of the sample network in Section 5.1 there are 17 software-connections from 12 individual nodes therefore the maximum value is 12/17. Equation 2 represents the tolerance of the network to single-point failure. This is a key component in the fitness function, ensuring that the solutions produced do not contain single links that are critical to their operation. The term ntotalcases represents the total number of possible single point failures possible within the network, evaluated for each individual source-to-sink connection pairing, nmissedcases represents the number of these cases where a single point failure will disrupt the source-to-sink connection pairing. In a network resilient to all single-point failures, nmissedcases = 0, so f itness(1) has a maximum value of 1. Equation 3 represents the amount of headroom (the amount of extra delay that could be tolerated before exceeding the specification) that DISCO predicts. It is summed over all source-to-sink connections to provide this value, Htotal - this value is specific for each simulated individual and will be dependent on the network configuration and inter-stream interference due to routing. Together Equations 2 and 3 represent the robustness of the network. The final of these four criteria is shown in Equation 4, and is used to represent the size of the network. The term will increase as smaller networks are found. The denominator, cinitial , represents the size of the first network found which is robust. This is likely to be a large network with many connections, as more fully connected networks are easier to find. Every subsequent individual is then compared with this initial network. This acts as a starting point, as the network size of an individual (cnetwork ) decreases, f itness(3) increases. By maximising this term the network size will be made as small as possible. This term ensures that small networks are promoted, however, these networks must still meet the specification criteria in order to be considered viable. f itness(3) can be both positive and negative - negative values indicate a larger network than the first found. Therefore to optimise the size of a network in Equation 4, Equation 1 must be maximised (constraint), Equation 2 must be equal to unity (constraint) and
Evolving Robust Networks for Systems-of-Systems
11
Equation 3 must be greater than zero (constraint, but can be optimised to be as high as possible). The fittest networks maximised values for f itness(0), an essential value of 1 for f itness(1), and as large values of f itness(2) and f itness(3) as possible.
5
Experimentation
The main aim of our experimentation is to check whether our prototype tool can produce a viable, robust network configuration faster than would be practical for a human engineer. For a sanity check, to show that this is a computationally non-trivial problem, we also compare our tool using a GA with a version of our tool that merely uses random search.
5.1
Choice and Definition of Sample Application
The example used in this paper is a system that transmits video streams, with the assumption that these are then used to take operational decisions under time pressure. As was noted in Section 1, networked software can be used to monitor the environment, streaming videos to keep key people updated on local situations. In order to do this, the network must be tolerant to failure and meet specified latency requirements. Table 1 describes the software system that is to run over our example network, in terms of the nodes where applications (and users) are located, the nature of the data that is sent, and the latency requirements. Each sink node is connected to two source node streams, with the node streams. These streams represent a video encoded with a fixed bit rate of 512kbps, transmitted using a UDP connection with standard size packets. Table 1. Node Connections in Sample Application Source Node
Sink Nodes
0 1 2 3 4 5
6 and 7 7 and 8 8 and 9 9 and 10 10 and 11 11
Packet Period (ms) 20.6 20.6 20.6 20.6 20.6 20.6
Packet Size (bytes) 1344 1344 1344 1344 1344 1344
Data Size (bytes) 1316 1316 1316 1316 1316 1316
Delay Spec.(s) 0.01 0.01 0.01 0.01 0.01 0.01
A fictional network of 21 nodes (12 end-nodes and 9 routing-nodes) has been spaced across the University of York Heslington West Campus. The end nodes are placed in major department buildings, while routing nodes are in key locations such as bridges, walkways and nucleus buildings. We assume that connections can be made as necessary.
12
5.2
Aitken, Alexander, Kelly and Poulding
Experimental Protocol
The software was implemented as outlined in Section 4. The NDL file was written to contain a network as described in Section 5.1. The GA was set up using the parameters outlined in Section 4.4. In order to investigate the performance of the process we ran the tool on our sample network 5 times, each time for 500 generations (this was the only stopping criterion). As a sanity check, to confirm that the example we had chosen was genuinely challenging, we also repeated those experiments using a random search for the same number of generations. As a further evaluation, random search was also applied to the problem in a series of longer runs of 1500 generations. We will make the code used to conduct the experiments and the NDL used to describe the network available on the lead author’s website. 5.3
Evaluation of the Process on Sample Network
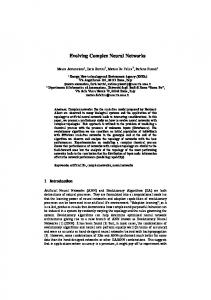
Our tool consistently produced multiple robust network designs early on in the search. The first such robust network appeared after an average of 40.5 ± 13.5s; the average size of this was 33.2 ± 1.3 connections, which is not optimal but is practical. It is unlikely that a human engineer could achieve this performance. Figure 2(a) shows the smallest networks found that meet the latency specification for the GA and (as a comparison) the random search, as time passes averaged across five optimisations. Networks appearing on this graph have been filtered to ensure that they both meet the specification and are tolerant to any single-point failure. Clearly the GA produces smaller networks much more quickly than a random search. It is clear that both the GA and the random search are capable of producing robust networks that meet the specification, but over the same number of candidates generated the GA found significantly smaller robust networks — the average number of connections in the robust networks found was 25.8 ± 0.4 for the GA compared to 30.4 ± 0.8 for the random search. In terms of compute effort (as opposed to simple number of generations), the GA produces large numbers of networks that are testable - an average of 25, 663±1, 393 per experiment, compared with 87±9 by the random search (both out of 1, 000, 000 candidates generated). Each testable network must be built, tested using network calculus and then examined under single-link failure; in contrast, a non-testable network can be ignored. This leads to a longer average processing time per individual — for the GA these 500 generations took an average of 1, 028.2 ± 406.7s, compared with 234.7 ± 22.8s for random search. The longer random runs, however, took an average of 2346.3 ± 95.4s — twice that for 500 generations of the GA. The average size of the network found was 30.6 ± 1.1, no better than for the 500-generation random search and substantially worse than the 25.8 ± 0.4 achieved by the 500-generation GA. It would appear from this that random search performance will not improve rapidly with increased computing power.
Evolving Robust Networks for Systems-of-Systems
13
9
38 Random 36
×10−3
8
GA 7
34
Headroom (s)
Smallest Network Meeting Specification
The Pareto fronts for the GA networks are shown in Figures 2(b), 2(c) and 2(d). Note that the graphs show actual network size, rather than the than the relative size metric used in the fitness function. The Pareto fronts produced by the GA show clear relationships between the different objectives. However, the filtering process used to identify networks that meet the robustness criteria is a key component in identifying viable solutions. Figures 2(b), 2(c) and 2(d) show combinations of the fronts of optimisation for the GA. As can be seen the only clear trade-off that can be made is for Number of Connections versus proportion of single-point failures (Figure 2(c)) — typically networks with fewer connections will prove to be more susceptible to single-point failures. However, different levels of headroom can be achieved at any level of single-point failure (thee specification only demands a headroom exists). As expected, networks with fewest connections, with headroom and robustness prove most desirable.
32 30
6 5 4 3
28 2 26 24 0
1 5
10
15
20
25
30
35
0 14
40
16
18
Time (minutes)
22
24
26
28
30
32
(b) Pareto Front for Number of Connections Versus Headroom Achieved (GA)
1
9
0.9
8
0.8
7
0.7
Headroom (s)
Resilience to Single-Point Failures
(a) Time Comparison of Network Size for GA and Random Search
0.6 0.5 0.4 0.3
×10−3
6 5 4 3 2
0.2
1
0.1 0 14
20
Number of connections
16
18
20
22
24
26
28
30
32
Number of connections
(c) Pareto Front for Number of Connections Versus Resilience to Single-Point Failures (GA)
0 0
0.1
0.2
0.3
0.4
0.5
0.6
0.7
0.8
0.9
1
Resilience to Single-Point Failures
(d) Pareto Front for Resilience to SinglePoint Failures Versus Headroom (GA)
Fig. 2. Investigating the GA and Random Search Over 500 Generations
14
6
Aitken, Alexander, Kelly and Poulding
Conclusions
This paper has described the implementation of a prototype network design tool. This tool can be used to design SoS networks to meet the latency requirements of a given software system, and make those networks robust to single link failures. We have a applied the tool to a simple software system running over a small network. Our experimental results show that the tool can produce viable robust solutions more quickly than is feasible for a human engineer, given the the cognitive effort required to consider network robustness under many different failure conditions. They show that both random and GA search are possible approaches, but that the GA consistently produces smaller networks. It is plausible that our automated approach will scale well to cover other types of failure, and to more complex networks. For a human engineer, by contrast, such changes will make the task even more impractical. 6.1
Future Work
A priority for the future is to apply this tool to larger and more complex networks, including wireless ad-hoc networks. As part of this, we plan to develop a network generator that produces random networks and software specifications with particular attributes (e.g. size, connectivity, range of latency requirements). This will help us explore what factors the performance of the tool is sensitive to — in particular, how it scales with larger networks and higher complexity. The current work has allowed the search free reign in configuring networks from the components available, without reference to any current configuration of the network. In order to explicitly tackle the problem of reconfiguration, an algorithm should be developed to calculate change cost from one configuration to another, and this should be incorporated into the fitness function. The model of robustness used here is quite limited — it only considers total failures of individual links. A richer failure model will be needed to accurately represent real network problems. Modelling more sophisticated failures (e.g. intermittent link failure) is not possible DISCO, so future work will need to consider simulation tools such as ns2, ns3 or OMNeTT++. These tools use much more compute time than DISCO, so an optimal solution may involve an initial search using DISCO followed by fine-tuning for subtle failures using simulation.
7
Acknowledgements
The authors wish to thank Jeroen van der Ham of the University of Amsterdam for assistance with NDL.
References 1. S. Ali, A. A. Maciejewski, H. J. Siegel, and K. J. Kim. Robust resource allocation for sensor-actuator distributed computing systems. In Proceedings of the International Conference on Parallel Processing, 2004.
Evolving Robust Networks for Systems-of-Systems
15
2. A. Aviˇzienis, J. C. Laprie, B. Randell, and C. E. Landwehr. Basic concepts and taxonomy of dependable and secure computing. IEEE Transactions on Dependable and Secure Computing, 1(1):11–33, 2004. 3. J. Y. L. Boudec and P. Thiran. A Theory of Deterministic Queuing Systems for the Internet. Springer-Verlag, 2011. 4. M. Boyer. NC-maude: A rewriting tool to play with network calculus. In 4th International Symposium on Leveraging Applications of Formal Methods, 2010. 5. H. Charara, J. L. Scharbarg, J. Ermont, and C. Fraboul. Methods for bounding end-to-end delays on an AFDX network. In 18th Euromicro Conference on RealTime Systems, 2006. 6. R. L. Cruz. A calculus for network delay, part I: Network elements in isolation. IEEE Transactions on Information Theory, 37(1):114–131, 1991. 7. R. L. Cruz. A calculus for network delay, part II: Network analysis. IEEE Transactions on Information Theory, 37(1):132–141, 1991. 8. F. Ducatelle, L. M. Gambardella, M. Kurant, H. X. Nguyen, and P. Thiran. Algorithms for failure protection in large ip-over-fiber and wireless ad hoc networks. In In Proceedings of Research Results of the DICS Program, 2006. 9. A. Elia, L. Ferrarini, and C. Veber. Analysis of ethernet-based safe automation networks according to iec-61508. In IEEE Conference on Emerging Technology in Factory Automation, Prague, Czech Republic, 2006. 10. J. P. Georges, T. Divoux, and E. Rondeau. Network calculus: Application to switched real-time networking. In 5th International ICST Conference on Performance Evaluation Methodologies and Tools, ValueTools, 2011. 11. J. P. Georges, N. Krommenacker, T. Divoux, and E. Rondeau. A design process of switched ethernet architectures according to real-time application constraints. Engineering Applications of Artificial Intelligence, 19:335–344, 2006. 12. G. Leu and A. Namatame. Evolving failure resilience in scale-free networks. In Intelligent and Evolutionary Systens. Springer-Verlag, 2009. 13. D. Newth and J. Ash. Evolving cascading failure resilience in complex networks. In Proceedings of the 8th Asia Pacific Symposium on Intelligent and Evolutionary Systems, 2004. 14. A. Nunes and T. Laursen. Identifying the factors that contributed to the ¨ Uberlingen mid-air collision. In Proceedings of the 48th Annual Chapter Meeting of the Human Factors and Ergonomics Society, 2004. 15. J. L. Scharbarg, F. Ridouard, and C. Fraboul. A probabilistic analysis of endto-end delays on an AFDX avionic network. IEEE Transactions on Industrial Informatics, 5(1):38–48, 2009. 16. J. B. Schmitt and F. A. Zdarsky. The DISCO network calculator. In First International Conference on Performance Evaluation Methodologies and Tools, 2006. 17. M. Sghairi, J. J. Aubert, P. Brot, A. de Bonneval, Y. Crouzet, and Y. Laarouchi. Distributed and reconfigurable architecture for flight control system. In Digital Avionics Systems Conference, 2009. 18. R. W. Sinnott. Virtues of the haversine. Sky and Telescope, 68(2):159, 1984. 19. T. Skeie, S. Johannessen, and O. Holmeide. Timeliness of real-time IP communication in switched industial ethernet networks. IEEE Transactions on Industrial Informatics, 2(1):25–39, 2006. 20. J. van der Ham, P. Grosso, R. van der Pol, A. Toonk, and C. T. A. M. de Laat. Using the network description language in optical networks. In Integrated Network Management, 2007.