remote sensing Article
Examination of Surface Temperature Modification by Open-Top Chambers along Moisture and Latitudinal Gradients in Arctic Alaska Using Thermal Infrared Photography Nathan C. Healey 1, *, Steven F. Oberbauer 2 and Robert D. Hollister 3 Received: 25 July 2015; Accepted: 30 December 2015; Published: 11 January 2016 Academic Editors: Santonu Goswami, Janet Elizabeth Nichol, Richard Gloaguen and Prasad S. Thenkabail 1 2 3
*
NASA Jet Propulsion Laboratory, California Institute of Technology, 4800 Oak Grove Dr., Pasadena, CA 91109, USA Department of Biological Sciences, Florida International University, 11200 SW 8th St., Miami, FL 33199, USA;
[email protected] Department of Biological Sciences, Grand Valley State University, 212 Henry Hall, 1 Campus Dr., Allendale, MI 49401, USA;
[email protected] Correspondence:
[email protected]; Tel.: +1-818-393-5358; Fax: +1-818-354-0988
Abstract: Passive warming manipulation methodologies, such as open-top chambers (OTCs), are a meaningful approach for interpretation of impacts of climate change on the Arctic tundra biome. The magnitude of OTC warming has been studied extensively, revealing an average plot-level warming of air temperature that ranges between 1 and 3 ˝ C as measured by shielded resistive sensors or thermocouples. Studies have also shown that the amount of OTC warming depends in part on location climate, vegetation, and soil properties. While digital infrared thermometers have been employed in a few comparisons, most of the focus of the effectiveness of OTC warming has been on air or soil temperature rather than tissue or surface temperatures, which directly translate to metabolism. Here we used thermal infrared (TIR) photography to quantify tissue and surface temperatures and their spatial variability at a previously unavailable resolution (3–6 mm2 ). We analyzed plots at three locations that are part of the International Tundra Experiment (ITEX)-Arctic Observing Network (AON-ITEX) network along both moisture and latitudinal gradients spanning from the High Arctic (Barrow, AK, USA) to the Low Arctic (Toolik Lake, AK, USA). Our results show a range of OTC surface warming from 2.65 to 1.27 ˝ C (31%–10%) at our three sites. The magnitude of surface warming detected by TIR imagery in this study was comparable to increases in air temperatures previously reported for these sites. However, the thermal images revealed wide ranges of surface temperatures within the OTCs, with some surfaces well above ambient unevenly distributed within the plots under sunny conditions. We note that analyzing radiometric temperature may be an alternative for future studies that examine data acquired at the same time of day from sites that are in close geographic proximity to avoid the requirement of emissivity or atmospheric correction for validation of results. We foresee future studies using TIR photography to describe species-level thermodynamics that could prove highly valuable toward a better understanding of species-specific responses to climate change in the Arctic. Keywords: remote sensing; thermal imagery; open-top chamber; Arctic; Alaska
1. Introduction Understanding the impacts of climate change on Arctic vegetation is a key requirement for prediction of how Arctic ecosystems will respond to future conditions [1]. Passive warming Remote Sens. 2016, 8, 54; doi:10.3390/rs8010054
www.mdpi.com/journal/remotesensing
Remote Sens. 2016, 8, 54
2 of 19
manipulation methodologies, such as hexagonal open-top chambers (OTCs), that simulate future scenarios of warming on small plots (~1 m2 ) have been extensively investigated in the Arctic [1–7]. Previous warming studies using OTCs have been directed toward analyzing specific species responses [8], radiation dynamics [9], plant phenology [10], snow regime shifts [11], and trace gas exchange [12,13] to name a few. Studies have spanned multiple locations to include gradients; DeFrenne et al. [5,6] examined transplants of forest understory species along a latitudinal gradient, and Oberbauer et al. [13] studied ecosystem CO2 fluxes in response to latitudinal and moisture gradients. Meta-analyses of many sites combined have quantified the impacts of passive warming treatments on tundra vegetation and indicate a warming climate in high latitudes and high elevations is changing plant communities and ecosystem function [14,15]. A key variable in the interpretation of the treatment responses is the effectiveness of the OTC experimental warming within the different climate regimes, vegetation types, and soil microclimates of the tundra biome. The increase in mean air temperatures within OTCs ranges from 1 to 3 ˝ C and is dependent on size and design, site climate, ecosystem type, and soil properties [3,4,16–22]. Soil temperatures at depth have been regularly tested in OTCs, but generally do not show a significant increase [23,24], although surface temperatures do [22]. Most of the research has focused on air temperatures measured by shielded resistive sensors or thermocouples rather than tissue or surface temperatures, but the measurements have been limited to just a few locations per plot. Considerable emphasis has been placed on documenting gradients in air temperature within OTCs by measuring air temperature at specific positions. However, what determines metabolic rates are tissue and surface temperatures. Tissue surface temperatures are determined to a large degree by radiation loads, boundary layer, and evapotranspiraton rates, whereas air temperature is driven by sensible heat [22]. Some measurements have been made with digital infrared thermometers in OTCs, but the resolution is limited. Given the small size of most OTCs, that they trap heat by increasing the boundary layer, and that they slightly reduce the light available to plants inside, detailed comparisons of the surface temperatures of vascular plants, moss, lichens, litter, and soil in and out of OTCs would be highly desirable. Recent advances in thermal infrared photography (TIR) have made possible fine-scale, calibrated surface temperature measurement at resolutions previously unattainable with digital infrared thermometers. The objective of this study was to quantify the range and spatial variation in temperatures of tundra surfaces (vascular and non vascular plants, lichens, litter, and soil) induced by the presence of OTCs installed along moisture and latitudinal gradients in Arctic Alaska, USA. 2. Materials and Methods The locations used for this research were situated along a gradient from High to Low Arctic (Figure 1) including: Barrow (71˝ 181 N, 156˝ 401 W; 7 masl), Atqasuk (70˝ 291 N, 157˝ 251 W; 21 masl), and Toolik Lake, Alaska (68˝ 371 N, 149˝ 361 W; 736 masl). All of these locations are part of the International Tundra Experiment (ITEX) and the Arctic Observatory Network (AON-ITEX). Data for this project are archived at the ACADIS data repository [25]. The OTCs used in this study for passive warming treatments were hexagonal in shape (~1 m in diameter, ~0.5 m in height) with an open top allowing for ventilation and precipitation inputs. They were constructed using 1.0 mm thick walls of Sun-Lite® HP fiberglass glazing (Kalwall Corporation, Manchester, NH, USA) that have high solar transmittance in visible wavelengths (~86%) and low transmittance in longwave (thermal) wavelengths (~5%). The walls of the chambers are inwardly-inclined (60˝ with respect to the horizontal) to trap heat. Each location has had OTCs deployed in representative plant communities at two points on the local soil moisture spectrum (wet/moist and dry) since the mid 1990s. Occurrence of plant growth forms and surface features in the plots was recorded using point-intercept methods (0.75 m2 area with 100 grid points [17]). Percent cover of major surface feature types for each site and moisture regime are presented in Figure 2. Detailed site information is presented below.
Remote Sens. 2016, 8, 54 Remote Sens. 2016, 8, 54
3 of 19 3 of 19
Figure 1. 1. Map Map of of the the three three locations locations used used in in this this study study along along with with weather weather data data during during image image Figure acquisition. Soil Soilmoisture moisture measurements measurementsrecorded recorded within within three three days days of of image image acquisition acquisition are are from from acquisition. plots along along the the ITEX ITEX transects transects immediately immediately adjacent adjacent to to the the study study sites sites as as described described in in Healey Healey et et al. al. [26] [26] plots that represent the wet/moist and dry ITEX OTC/Control plots. that represent the wet/moist and dry ITEX OTC/Control plots.
The The Barrow Barrow wet wet site site is is located located on on the the edge edge of of aathaw thawlake lakebasin basinand andisisdominated dominatedby bygraminoids, graminoids, in particular Carex aquatilis [4]. Soils are organic (Histic Pergelic Cryaquepts) with shallow in particular Carex Cryaquepts) with shallow depth depth of of thaw. thaw. As As a result, standing standing water water is frequently frequently present present at at the wet site. The The vegetation vegetation at at the the Barrow Barrow dry site is dominated by a dwarf deciduous shrub, Salix rotundifolia, with evergreen shrubs (e.g.,
Remote Sens. 2016, 8, 54
Remote Sens. 2016, 8, 54
4 of 19
4 of 19
site is dominated by a dwarf deciduous Salix rotundifolia, with evergreen shrubs (e.g., dry site Cassiope dry tetragona) and graminoids (e.g., Luzula shrub, spp., Arctagrostis latifolia). Soils at the Barrow Cassiope tetragona) and graminoids (e.g., Luzula spp., Arctagrostis latifolia). Soils at the Barrow dry site are mostly mineral Pergelic Cryaquepts on silt, sand, and gravel on a raised beach ridge [4]. are mostly mineral Pergelic Cryaquepts on silt, sand, and gravel on a raised beach ridge [4].
2. Aggregate of major plant growth forms andsurface surface features features atateach Figure 2.Figure Aggregate percentpercent covercover of major plant growth forms and eachsite site (BRW (BRW = Barrow; ATQ = Atqasuk, TLK = Toolik Lake) for dry (a) and wet/moist (b) moisture regimes = Barrow; ATQ = Atqasuk, TLK = Toolik Lake) for dry (a) and wet/moist (b) moisture regimes (ctl = (ctl = control, otc = open top chamber). Note: cover data were not available for all plots at Toolik control, otc = open top chamber). Note: cover data were not available for all plots at Toolik Lake [25]. Lake [25].
The wetThe meadow at Atqasuk is located on the edge of a thaw lake basin and is dominated by wet meadow at Atqasuk is located on the edge of a thaw lake basin and is dominated by Carex aquatilis [4]. Standing water is present most summers this site. Soils at the Carex aquatilis [4]. Standing water is presentthroughout throughout most of of thethe summers in thisin site. Soils at the wet site wet are site Histic Pergelic Cryaquepts. Soils drysite site Pergelic Cryopsamments on aolian are Histic Pergelic Cryaquepts. Soilsat at the the dry areare Pergelic Cryopsamments on aolian of a stabilized dune. Vegetationatatthe the dry dry site by the evergreen shrubs shrubs sand of asand stabilized sand sand dune. Vegetation siteisisdominated dominated bydwarf the dwarf evergreen Ledum palustre, Cassiope tetragona, and Vaccinium vitis-idaea and the graminoids Hierochloe alpina Ledum palustre, Cassiope tetragona, and Vaccinium vitis-idaea and the graminoids Hierochloeand alpina and Luzula confusa [4]. Luzula confusa [4]. At Toolik, the OTCs are placed on moist tussock tundra rather than wet sedge tundra because of the great abundance of tussock tundra in the region around Toolik Lake and the relative rarity of wet sedge vegetation. Tussock tundra at Toolik is dominated by the graminoids Eriophorum vaginatum and Carex bigelowii, the deciduous shrubs Betula nana and Salix pulchra, and the dwarf evergreen
Remote Sens. 2016, 8, 54
5 of 19
At Toolik, the OTCs are placed on moist tussock tundra rather than wet sedge tundra because of the great abundance of tussock tundra in the region around Toolik Lake and the relative rarity of wet sedge vegetation. Tussock tundra at Toolik is dominated by the graminoids Eriophorum vaginatum and Carex bigelowii, the deciduous shrubs Betula nana and Salix pulchra, and the dwarf evergreen shrubs Ledum palustre and Vaccinium vitis-idaea [11]. Eriophorum vaginatum, the dominant plant at the site, is a sedge that forms tussocks or raised mounds with the current year’s growth, persisting on top of the previous year’s growth. Soils are Pergelic Cryaquepts with thaw depths attaining 50–60 cm. Standing water is rarely present at the site except during snowmelt. The dry site vegetation is dry heath dominated by Dryas octopetala, Salix phlebophylla, Arctous alpina, and fruticose lichens [11,21] located on well-drained rocky Pergelic Cryumbrepts. Thaw depth may attain 1 m or more. The timing of this study was designed to analyze thermal properties of vegetation and uncovered soil/moss during peak growth in the Arctic growing season (late July–early August). Thermal infrared photographs were collected from a stable platform/tripod once at midday (~12:00–14:00 AST) from a height of 2.5–3.0 m between 4 and 6 August 2014 (Barrow: 4 August, Atqasuk and Toolik Lake: 6 August) at four randomly selected control plots and four coinciding OTCs within two different moisture regimes at each study location (wet/moist and dry: 24 plots overall). Imagery was collected at midday to minimize any shading effects from the OTC walls. Multiple images of each target were acquired to quantify measurement bias and ensure data integrity was upheld (i.e., maintain nadir angle and ensure camera focus). At Barrow and Toolik Lake we used FLIR A655sc cameras (FLIR Systems, Wilsonville, OR, USA) which have an uncooled microbolometer detector equipped with a 13.1 mm lens exhibiting a 45˝ field of view, a spatial resolution of roughly 3 mm (640 ˆ 480: over 300,000 pixels per image), and a spectral range of 7.5–14 µm. At Atqasuk, we used a FLIR A325sc camera which has an uncooled microbolometer detector equipped with a 10 mm lens exhibiting a 45˝ field of view, a spatial resolution of roughly 6 mm (320 ˆ 240: over 76,000 pixels per image—not resampled to the A655sc resolution), and a spectral range of 7.5–13 µm. The thermal sensitivity of both camera models, defined by the Noise Equivalent Temperature Difference (NETD) is 0.03 ˝ C at 30 ˝ C. Accuracy of temperature measurements for the FLIR a655sc and a325sc cameras is ˘2% of the reading with an average bias of ˘0.104 ˝ C. All images were atmospherically corrected via FLIR’s Research IR Software with inputs of atmospheric temperature and humidity acquired from weather stations onsite, optic temperature (assumed to be equal to air temperature), and surface emissivity was set to 0.98 following the average emissivity between 7.5 and 14 µm for tundra species reported in Wilber et al. [27]. Weather conditions for each day and location are presented in Map 1 and all sites experienced partly-mostly cloudy sky conditions on image dates. We calculated the average temperature of all pixels in each plot for each image, then consolidated the results for each treatment (wet/moist or dry) to examine differences within and among sites. To exclude non-uniform, microclimatic effects of the close proximity of the OTC to the vegetation around the inside perimeter of the structure, the OTC itself and the surface underlying the angled walls of the OTC were removed from image analysis to focus on the surface temperature of a circular area designated around the edge of the OTC opening that is visible from the nadir only (Figures 3–8).
Remote Sens. 2016, 8, 54
Remote Sens. 2016, 8, 54
6 of 19
6 of 19
Figure 3. Images depicting four Barrow dry site plots (a–d) and the coinciding thermal images below Figure 3. Images depicting four Barrow dry site plots (a–d) and the coinciding thermal images below (e–h); and images of four additional plots (i–l) with coinciding thermal images below (m–p). Note: (e–h); and images of four additional plots (i–l) with coinciding thermal images below (m–p). Note: the the ring appearing in panels (d,h) is gas exchange collar not related to this study. Areas of image ring appearing in panels (d,h) is gas exchange collar not related to this study. Areas of image analysis analysis are outlined with dotted white lines. Data within the transparent circular area has been are outlined with dotted white lines. Data within the transparent circular area has been removed. All removed. All temperatures are in degrees Celsius. Plant growth forms and surface features are temperatures are in degrees Celsius. Plant growth forms and surface features are depicted with the depicted with the following abbreviations—BRYO: bryophyte/moss; DSHR: deciduous shrub; ESHR: following abbreviations—BRYO: bryophyte/moss; DSHR: deciduous shrub; ESHR: evergreen shrub; evergreen shrub; FORB: forb; GRAM: graminoid; LICH: lichen; LITT: leaf litter; SOIL: bare soil/rock. FORB: forb; GRAM: graminoid; LICH: lichen; LITT: leaf litter; SOIL: bare soil/rock.
Remote Sens. 2016, 8, 54 Remote Sens. 2016, 8, 54
7 of 19 7 of 19
Figure 4. Images depicting four Barrow wet site plots (a–d) and the coinciding thermal images below Figure 4. Images four Barrow wet(i–l) site with plots coinciding (a–d) and the coinciding thermal (e–h); and imagesdepicting of four additional plots thermal images belowimages (m–p). below Note: (e–h); and images of four additional plots (i–l) with coinciding thermal images below (m–p). Note: the the rings appearing in panels (b,f,i–p) are gas exchange collars not related to this study. Areas of rings appearing in panels (b,f,i–p) are gas exchange collars not related to this study. Areas of image image analysis are outlined with dotted white lines. Data in the transparent circular areas have been analysis are outlined with dotted white lines. Data in the transparent circular areas have been removed. removed. All temperatures are in degrees Celsius. Plant growth forms and surface features are All temperatures are in degrees Celsius. Plant growth forms and surface features are depicted with depicted with the following abbreviations—BRYO: bryophyte/moss; DSHR: deciduous shrub; ESHR: the following abbreviations—BRYO: bryophyte/moss; DSHR: deciduous shrub; ESHR: evergreen evergreen shrub; FORB: forb; GRAM: graminoid; LICH: lichen; LITT: leaf litter; SOIL: bare soil/rock. shrub; FORB: forb; GRAM: graminoid; LICH: lichen; LITT: leaf litter; SOIL: bare soil/rock. White grids White grids symbolize chamber base points or plant identification tags. symbolize chamber base points or plant identification tags.
Remote Sens. 2016, 8, 54 Remote Sens. 2016, 8, 54
8 of 19 8 of 19
Figure Figure 5. 5. Images depicting depicting four Atqasuk Atqasuk dry dry site plots (a–d) and the coinciding thermal thermal images images below below (e–h); additionalplots plots(i–l) (i–l)with withcoinciding coincidingthermal thermalimages imagesbelow below (m–p). Areas (e–h); and and images of four additional (m–p). Areas of of image analysis outlined with dotted black lines. All temperatures in degrees Celsius. image analysis areare outlined with dotted black lines. All temperatures are inare degrees Celsius. Plant Plant growth surface features depictedwith withthe the following following abbreviations—BRYO: growth formsforms and and surface features areare depicted abbreviations—BRYO: bryophyte/moss; DSHR: deciduous deciduous shrub; shrub; ESHR: ESHR: evergreen evergreen shrub; FORB: forb; GRAM: graminoid; bryophyte/moss; DSHR: LICH: LICH: lichen; lichen; LITT: LITT:leaf leaflitter; litter;SOIL: SOIL:bare baresoil/rock. soil/rock.
Remote Sens. 2016, 8, 54 Remote Sens. 2016, 8, 54
9 of 19 9 of 19
Figure 6. 6. Images Figure Images depicting depicting four four Atqasuk Atqasuk wet wet site site plots plots (a–d) (a–d) and and the the coinciding coinciding thermal thermal images images below below (e–h); and and images images of of four four additional additional plots plots (i–l) (i–l) with with coinciding coinciding thermal thermal images images below below (m–p). (m–p). Note: (e–h); Note: the rings appearing in panels (i–p) are gas exchange collars not related to this study. Areas of image the rings appearing in panels (i–p) are gas exchange collars not related to this study. Areas of image analysis are areoutlined outlined with dotted white the transparent areas been analysis with dotted white lines.lines. DataData in thein transparent circularcircular areas have beenhave removed. removed. All temperatures are Celsius. in degrees Celsius. formsfeatures and surface featureswith are All temperatures are in degrees Plant growthPlant formsgrowth and surface are depicted depicted with the following abbreviations—BRYO: bryophyte/moss; DSHR: shrub; deciduous shrub; ESHR: the following abbreviations—BRYO: bryophyte/moss; DSHR: deciduous ESHR: evergreen evergreen shrub; forb; GRAM: graminoid; LICH: LITT: leaf bare litter;soil/rock. SOIL: bare soil/rock. shrub; FORB: forb;FORB: GRAM: graminoid; LICH: lichen; LITT:lichen; leaf litter; SOIL: White grids White grids symbolize chamber base points or plant identification tags. symbolize chamber base points or plant identification tags.
Remote Sens. 2016, 8, 54 Remote Sens. 2016, 8, 54
10 of 19 10 of 19
Figure 7. Images site plots plots (a–d) (a–d) and and the the coinciding coinciding thermal thermal images images Figure 7. Images depicting depicting four four Toolik Toolik Lake Lake dry dry site below (e–h); and images of four additional plots (i–l) with coinciding thermal images below below (e–h); and images of four additional plots (i–l) with coinciding thermal images below (m–p). (m–p). Areas of image analysis are outlined with dotted white lines. All temperatures are in degrees Celsius. Areas of image analysis are outlined with dotted white lines. All temperatures are in degrees Celsius. Plant Plant growth growth forms forms and and surface surface features features are are depicted depicted with with the the following following abbreviations—BRYO: abbreviations—BRYO: bryophyte/moss; DSHR: deciduous shrub; ESHR: evergreen shrub; bryophyte/moss; DSHR: deciduous shrub; ESHR: evergreen shrub; FORB: FORB: forb; forb; GRAM: GRAM: graminoid; graminoid; LICH: lichen; LITT: leaf litter; SOIL: bare soil/rock. Note: cover data were not available LICH: lichen; LITT: leaf litter; SOIL: bare soil/rock. Note: cover data were not available for for all all plots. plots.
Remote Sens. 2016, 8, 54
11 of 19
Remote Sens. 2016, 8, 54
11 of 19
Figure 8. Images depicting four Toolik Lake moist site plots (a–d) and the coinciding thermal images
Figure 8. Images depicting four Toolik Lake moist site plots (a–d) and the coinciding thermal images below (e–h); and images of four additional plots (i–l) with coinciding thermal images below (m–p). below (e–h); and images of four additional plots (i–l) with coinciding thermal images below (m–p). Areas of image analysis are outlined with dotted white lines. All temperatures are in degrees Celsius. AreasPlant of image analysis are outlined with dotted white lines. are in degrees Celsius. growth forms and surface features are depicted with All the temperatures following abbreviations—BRYO: Plantbryophyte/moss; growth formsDSHR: and surface features are depicted with the following abbreviations—BRYO: deciduous shrub; ESHR: evergreen shrub; FORB: forb; GRAM: graminoid; bryophyte/moss; DSHR: ESHR:Note: evergreen shrub; FORB: forb; GRAM: graminoid; LICH: lichen; LITT: leafdeciduous litter; SOIL: shrub; bare soil/rock. cover data were not available for all plots. LICH: lichen; LITT: leaf litter; SOIL: bare soil/rock. Note: cover data were not available for all plots. To quantify warming in this study, we subtracted the average surface temperature among all pixels within each controlin plot (CTL) from allsubtracted pixels withinthe theaverage coinciding OTC immediately adjacent To quantify warming this study, we surface temperature among all (Figures 3–8) and as calculated percent difference as follows:
pixels within each control plot (CTL) from all pixels within the coinciding OTC immediately adjacent − | (Figures 3–8) and as calculated percent difference|as follows:
%
=
× 100 + |OTC ´ 2 CTL|˙ ˆ 100 % Di f f erence “ ˆ OTC ` CTL 2
(1)
(1)
We present both absolute and percent differences because both approaches have value. However, careful consideration is required when examining percent differences between OTCs and controls due
Remote Sens. 2016, 8, 54
12 of 19
RemoteWe Sens.present 2016, 8, 54both
of 19 absolute and percent differences because both approaches have 12 value. However, careful consideration is required when examining percent differences between OTCs and controls due to the dependence on the base values involved in the calculation. Therefore, the absolute to the dependence on the base values involved in the calculation. Therefore, the absolute difference difference may be most appropriate for this analysis. may be most appropriate for this analysis.
3. 3. Results Results 3.1. 3.1. Latitudinal Latitudinal Gradient Gradient The The surface surface temperature temperature for for all all control control and and OTC OTC plots plots averaged averaged across across locations locations and and sites sites were were ˝ ˝ ˝ 10.2 and 12.0 12.0 °C, respectively,a amean meandifference difference (16% increase, range of 1.27–2.65 °C (10%– 10.2 and C, respectively, of of 1.81.8C°C (16% increase, range of 1.27–2.65 C (10%–31% ˝ C (9%–34% 31% increase). The average surface warming induced by thewas OTCs was 1.22–3.05 °C (9%–34% increase). The average surface warming induced by the OTCs 1.22–3.05 increase) ˝ increase) for all dry plots and 1.31–2.24 °C (12%–29% increase) for all wet/moist plots (Figure 9). When for all dry plots and 1.31–2.24 C (12%–29% increase) for all wet/moist plots (Figure 9). When the the results wetdry andplots dryare plots are combined at the each of the three locations, a trend of results fromfrom both both wet and combined at each of three locations, a trend of decreasing decreasing warming from to is Low Arctic iswith noticeable, with warming the greatest warming at Barrow, warming from High to LowHigh Arctic noticeable, the greatest at Barrow, intermediate ˝ intermediate at Atqasuk, and the least warming at Toolik Lake (2.65, 1.48, and 1.27 °C and at Atqasuk, and the least warming at Toolik Lake (2.65, 1.48, and 1.27 C and 31%, 12%,31%, and12%, 10% and 10% difference, respectively, 8). The was primarily the dry plots difference, respectively, Figure 8).Figure The trend wastrend primarily driven bydriven the drybyplots (3.05, 1.70,(3.05, and ˝ 1.70, and 1.22 °C and 33%, 11%, and 9% increase for Barrow, Atqasuk, and Toolik Lake, respectively). 1.22 C and 33%, 11%, and 9% increase for Barrow, Atqasuk, and Toolik Lake, respectively). Among Among the wet/moist the Atqasuk wet showed site dataslightly showed slightly lowerthan warming thanLake the the wet/moist plots, theplots, Atqasuk wet site data lower warming the Toolik ˝ Toolik Lake moist plots (2.24, 1.27, and 1.31 °C and 29%, 15%, and 12% increase for Barrow, Atqasuk, moist plots (2.24, 1.27, and 1.31 C and 29%, 15%, and 12% increase for Barrow, Atqasuk, and Toolik and Lake, respectively). Lake,Toolik respectively). 3.2. Soil Soil Moisture Moisture Effects Dry plot surface temperatures were warmer than those of of wet/moist wet/moist plot plot for for both both control and OTC plots at all three sites. In fact, on the dates images were taken, surface temperatures for both control and OTC dry plots at Atqasuk Atqasuk surpassed those of dry dry plots plots at at Toolik Toolik Lake, our lowest lowest latitude latitude site. Average, dry control plots ranged from a minimum of 5.8 Average,plot-level, plot-level,surface surfacetemperature temperatureamong among dry control plots ranged from a minimum of ˝ CBarrow °C (Figures 3h 3h and 9b), to to a maximum ofof 15.4 5.8 at at Barrow (Figures and 9b), a maximum 15.4°C˝ CatatAtqasuk Atqasuk(Figures (Figures5f5fand and10b). 10b). Average Average ˝ C at Barrow plot-level surface temperature temperature among among dry dry OTC OTC plots plots ranged ranged from from a minimum minimum of 8.3 °C ˝ (Figures 3m and 10b) to a maximum of 17.3 °C C at Atqasuk (Figures 5p and 10b). The average plot ˝ C, °C, surface temperature temperature for forall alldry drycontrols controlsand and OTCs were respectively, equaling a OTCs were 11.811.8 andand 13.813.8 respectively, equaling a total ˝ total difference among dry plots °C (16% increase, difference among dry plots of 2.0ofC2.0 (16% increase, TableTable S1). S1).
Figure Figure 9. 9. Mean Mean difference difference between between Open Open Top Top Chamber Chamber (OTC) (OTC) and and control control plot plot surface surface temperatures temperatures (OTC—control). (OTC—control).
Remote Sens. 2016, 8, 54 Remote Sens. 2016, 8, 54
13 of 19 13 of 19
Figure 10. Boxplots of the plot-level average surface temperature data for all controls (CTL) and all Open Top Chambers (OTC) (a); all dry plots (b); and all wet/moist plots (c).
Remote Sens. 2016, 8, 54
14 of 19
Figure 10. Boxplots of the plot-level average surface temperature data for all controls (CTL) and all Open Top Chambers (OTC) (a); all dry plots (b); and all wet/moist plots (c). Remote Sens. 2016, 8, 54
14 of 19
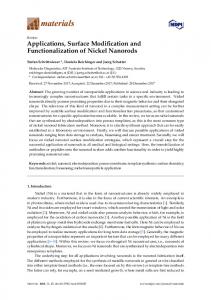
Average surface temperature of the controls among wet/moist plots ranged from a minimum of 5.9 °C at Barrow (Figures 4e and 10c) to a maximum of 12.7 °C at Toolik Lake (Figures 8e and 10c). Average surface temperature of the controls among wet/moist plots ranged from a minimum Average ˝surface temperature within wet/moist OTC plots ˝ranged from a minimum of 7.4 °C at of 5.9 C at Barrow (Figures 4e and 10c) to a maximum of 12.7 C at Toolik Lake (Figures 8e and 10c). Barrow (Figures 4otemperature and 10c) towithin a maximum of 12.6 at Toolik 8nof and average ˝ C atThe Average surface wet/moist OTC°C plots rangedLake from (Figures a minimum 7.410c). Barrow ˝ temperature for all wet/moist controls and OTCs were 8.5 °C and 10.1 °C, respectively, equaling a (Figures 4o and 10c) to a maximum of 12.6 C at Toolik Lake (Figures 8n and 10c). The average totaltemperature difference among wet plotscontrols of 1.6 °Cand (17%, Table for all wet/moist OTCs wereS2). 8.5 ˝ C and 10.1 ˝ C, respectively, equaling a ˝ Thedifference TIR revealed that highly within the OTCs compared to controls, total among wettemperatures plots of 1.6 Care (17%, Tablevariable S2). The revealed temperatures are highly variable within the OTCs compared to controls, especially atTIR Barrow. Thethat range of pixel surface temperature values for dry plot controls vs. OTCs The range of pixel surface temperature dry°C plot OTCs were wereespecially 3–18 °C at vs.Barrow. 3–23 °C, respectively, for Barrow and 9–19values °C vs. for 9–20 forcontrols Toolik vs. Lake, respectively ˝ C vs. 3–23 ˝ C, respectively, for Barrow and 9–19 ˝ C vs. 9–20 ˝ C for Toolik Lake, respectively 3–18 (Figure 11). The range of pixel surface temperature values for wet/moist plot controls vs. OTCs were 11). The°C, range of pixel surface temperature forvs. wet/moist vs. OTCs were 2–13(Figure °C vs. 3–22 respectively, for Barrow and values 8–19˝ °C 9–20 °Cplot for controls Toolik Lake, respectively ˝ ˝ ˝ 2–13 C vs. 3–22 C, respectively, for Barrow and 8–19 C vs. 9–20 C for Toolik Lake, respectively (Figure 11). (Figure 11).
Barrow - Dry Plots
4
4 x 10
Barrow - Wet Plots
4
6 x 10
b
a 3.5
5 4
2.5
Frequency
Frequency
3
2 1.5
3 2
1
1
0.5 0 0
5
10 15 20 Temperature (oC)
25
30
Atqasuk - Dry Plots
0 0
3 x 10
14000
5
10 15 20 Temperature (oC)
25
Atqasuk - Wet Plots
4
d
c 12000
2.5
10000 Frequency
30
2
8000
1.5 6000
1
4000
0.5
2000 0 0
5
10 15 20 Temperature (oC)
25
30
0 0
Figure 11. Cont.
5
10 15 20 Temperature (oC)
25
30
Remote Sens. 2016, 8, 54
15 of 19
Remote Sens. 2016, 8, 54
15 of 19
Toolik Lake - Dry Plots
4
3 x 10
Toolik Lake - Moist Plots
4
12 x 10
f
2.5
10
2
8 Frequency
Frequency
e
1.5
6
1
4
0.5
2
0 0
5
10 15 20 Temperature (oC)
25
30
0 0
5
10 15 20 Temperature (oC)
25
30
Figure 11. Histograms of pixel temperatureswithin within the the OTCs OTCs (gray) coinciding control plotsplots Figure 11. Histograms of pixel temperatures (gray)and andthe the coinciding control (black) at each of the three locations. Pixel values for all four plots and each treatment (OTC or control) (black) at each of the three locations. Pixel values for all four plots and each treatment (OTC or control) at Barrow dry (a); Barrow wet (b); Atqasuk dry (c); Atqasuk wet (d); Toolik Lake dry (e); and Toolik at Barrow dry (a); Barrow wet (b); Atqasuk dry (c); Atqasuk wet (d); Toolik Lake dry (e); and Toolik Lake moist (f) are presented. Lake moist (f) are presented.
Overall, image analysis of individual pixels in the dry plots shows that the greater abundance
Overall, image analysis of individual pixels in the dry plots shows that the greater abundance of exposed litter and standing dead leaves is associated with buildup of higher temperatures when of exposed litter andOTCs standing dead to leaves is associated with buildup of higher when shielded by the compared a more uniform temperature distribution in temperatures the control plots shielded by the OTCs compared to a more uniform temperature distribution in the control (Figures 3, 5 and 7). The highest temperatures within the dry plots coincided with areas where aplots (Figures 3, 5,ofand 7). The soil, highest temperatures within dry plots coincided with areas where a mixture dry exposed rocks, lichens, and litter werethe present. The lowest temperatures coincided mixture drycovered exposed soil,vascular rocks, plants lichens, litter Dryas, were and present. The (evergreen lowest temperatures withof areas by live suchand as Luzula, Vaccinium shrubs), mosses (bryophytes) were present, and greater shading potentially occurs (Figures 3, 5 and 7). coincided with areas covered by live vascular plants such as Luzula, Dryas, and Vaccinium (evergreen The highest temperatures the wet/moist plots were found in areas exhibiting an abundance shrubs), mosses (bryophytes) werewithin present, and greater shading potentially occurs (Figures 3, 5, and 7). of standing dead litter among Eriophorum and Carex species (graminoids) at Toolik Lake and Atqasuk an The highest temperatures within the wet/moist plots were found in areas exhibiting (Figuresof6 and 8). Thedead lowest temperatures within wet/moist plots species occurred(graminoids) where live vascular plantsLake abundance standing litter among Eriophorum and Carex at Toolik such as Salix, Carex, and Betula species (deciduous shrubs and graminoids), little or no standing dead and Atqasuk (Figures 6 and 8). The lowest temperatures within wet/moist plots occurred where live matter, and a greater abundance of moist moss (bryophytes) is exposed. vascular plants such as Salix, Carex, and Betula species (deciduous shrubs and graminoids), little or no standing dead matter, and a greater abundance of moist moss (bryophytes) is exposed. 4. Discussion 4.1. All Plots 4. Discussion Comparison of the combination of all wet and all dry plots among our three sites shows that the
4.1. All Plots OTCs increase average surface temperatures by 1.2–3.0 ˝ C at midday, similar to reported increases in air temperatures [3,4,18,22]. Our results showed that the greatest surface temperature difference
Comparison of the combination of all wet and all dry plots among our three sites shows that the between OTCs and controls (2.65 ˝ C, or 31% warmer) was at our highest latitude site at Barrow, AK and OTCs increase average surface˝temperatures by 1.2–3.0 °C at midday, similar to reported increases in the smallest difference (1.27 C, or 10% warmer) at our lowest latitude site at Toolik Lake. While these air temperatures [3,4,18,22]. results showed thatseason, the greatest surface temperature difference results represent a middayOur snapshot at peak growing conditions during the measurements between OTCs and controls (2.65 °C, or 31% warmer) was at our highest latitude site at Barrow, were generally representative of the typical weather for these sites for early August. While the finding AK and the difference temperature (1.27 °C, or difference 10% warmer) at latitude our lowest latitude site atalso Toolik Lake.inWhile of asmallest greater proportional at high vs. low latitude was reported a thesecross-site results comparison represent [22], a midday snapshot atdifference peak growing season, absolute temperature did not show a clearconditions pattern with during latitude the in that study. The generally best predictor of temperature in OTCs is irradiance [22,28], generally measurements were representative ofincrease the typical weather for these siteswhich for early August. withof increased latitude. The strongest plant response to OTCs has latitude been reported for latitude low Whiledecreases the finding a greater proportional temperature difference at high vs. low latitude sites [15]. The warming effect tends to increase with wind speed at short time scales and was also reported in a cross-site comparison [22], absolute temperature difference did not low show a wind speeds, but not at monthly time scales or high wind speeds [18,22]. clear pattern with latitude in that study. The best predictor of temperature increase in OTCs is The underlying basis for the findings in the present study is likely a combination of the effects of irradiance [22,28], which generally decreases with increased latitude. The strongest plant response to plot surface properties (i.e., vegetation and soil) and climate differences along our site gradient. Plant OTCs has been reported for low latitude sites [15]. The warming effect tends to increase with wind speed at short time scales and low wind speeds, but not at monthly time scales or high wind speeds [18,22]. The underlying basis for the findings in the present study is likely a combination of the effects of plot surface properties (i.e., vegetation and soil) and climate differences along our site gradient.
Remote Sens. 2016, 8, 54
16 of 19
cover generally decreases with increasing latitude such that at high latitudes, bare ground, and rocks comprise an important fraction of the surface. The low albedo of dark soil, rocks, and standing deal litter leads to greater surface temperatures, heat storage, and sensible heat released within the OTC compared to surfaces with greater vegetation. At the same time, surface winds likely increase the difference in temperatures between control plots and the sheltered plots within the OTCs by disrupting the boundary layers on leaf and surface objects within the control plots. For our three locations, the number of windy days is greatest at Barrow and least at Toolik (Hollister and Oberbauer, unpubl. data). At Barrow, in particular, the steady, cold maritime winds from the Beaufort Sea cool any objects above the vegetation boundary layer. The depth of soil thaw may also contribute to surface temperatures. Shallow thaw depths may maintain lower temperatures due to close proximity of frozen soil to the surface. Ping et al. 1998 [29] indicated that the deepest thaw depths in Alaska are generally found at the lowest latitudes and the shallowest thaw depths occur on the Coastal Plain. Thaw depths are in part determined by the soil properties and vegetation type [24]. Moss communities and wet graminoid communities are well known for their ability to maintain shallow thaw depths under peat soils. Generally, however, OTCs have not been documented to increase thaw depth [3]. The lower sun angles at the high latitude location would imply potentially smaller warming effects, but leaves of the dominant vascular plants tend to be near vertical at high latitudes, potentially compensating for low sun angles [30]. For both wet and dry plots, the controls exhibited a narrower range of surface temperatures compared to the distribution of temperatures in the OTCs. In most cases, the effect of the OTCs was to broaden the temperature distribution into higher temperatures compared to controls, rather than a simple shift to higher mean temperature with the same temperature range. Visual inspection of TIR images clearly reveal that these temperature differences were not uniformly distributed. It should be reinforced here that these pixel temperatures are only those from the center portion of the OTC and do not include edge locations near the chamber walls, so the actual temperature ranges in OTCs are likely wider than reported here. Whether this high variance persists for pixel daily averages, at the daily time scale, is uncertain. The surface temperature variability here would predict that measurements of within-plot plant responses should be more variable in OTCs than in controls [22]. 4.2. Soil Moisture Effects Dry plot surface temperatures were generally warmer and had greater increases in response to OTCs compared to those in wet/moist plots for Barrow and Atqasuk (Figures 9 and 10). The warmest plots overall were the dry site plots at Atqasuk, a response in part to low cloud cover during image collection. However, the dry site at Atqasuk is also the least vegetated of all the sites with the greatest potential for soil heating. The Atqasuk wet site measured within 2 h of the dry site on the same day had much lower temperatures and was intermediate in temperatures between those of Barrow and Toolik wet/moist sites. The wet/moist plots at the three locations have essentially no exposed soil and rocks and low diversity of surface features overall compared to the dry sites (Figures 4, 6 and 8). On that basis, wet/moist plots would be expected to have lower ranges of surface temperatures in the OTCs compared to those of the dry sites, as was generally found though the temperature range on the Barrow wet sites was quite large. The moist site at Toolik was quite different from the wet sites at Barrow and Atqasuk, with drier soils and higher plant and structural diversity, factors that may have led to the similar degree of warming as that found for the Toolik Lake dry site. In addition to the vegetation and soil surface effects on surface temperature differences between dry and wet/moist plots discussed previously, these plot types differ strongly in terms of soil depth of thaw and soil moisture. A frequent effect of OTCs is reduced soil moisture [18]. If vascular and poikilohydric plants in dry OTC plots are water limited and evapotranspiration is reduced, the difference in surface temperatures between those in OTCs and controls will be magnified. The dry sites, with primarily mineral soils and sparse vegetation cover, typically have thaw depths well below 1 m at peak growing season. In contrast, the insulative effects of the organic soils in the wet/moist
Remote Sens. 2016, 8, 54
17 of 19
sites result in shallower depths of thaw in the wet/moist sites that maintain lower soil temperatures and the water table closer to the surface. The wet sites of Barrow and Atqasuk frequently have water at or above the soil surface during the growing season. While image analysis shows that vegetation with leaves and/or standing dead matter above the soil/standing water within the plot warm to higher temperatures when shielded by the OTC, the presence of standing water generally lowers the warming effect. Water near the surface, while lowering the albedo, facilitates energy loss by latent rather than sensible heat and surface cooling via evapotranspiration, especially from moist moss surfaces [31]. Water at or near the surface also represents a thermal mass that requires large heat input to increase temperature [13,18]. 5. Conclusions This study reports on the use of advanced thermal infrared imagery to analyze the peak growing season temperature patterns within OTCs, the passive warming devices commonly used for simulation of future temperature regimes in Arctic, Antarctic, and alpine communities. We selected long-term monitoring sites spanning latitudinal and moisture gradients where OTCs have been in place every growing season since the mid 1990s. The use of this technology enabled for the first time the quantification of the frequency distribution of surface temperatures within the OTCs and control plots at high spatial resolution. Major findings of our study are: (1) Similar to air temperature modification by OTCs, midday surface temperatures increased by 1–3 ˝ C on average across all sites; (2) The greatest average surface warming (wet and dry sites combined) occurred at the highest latitude site (2.65 ˝ C: Barrow, AK) and the lowest average surface warming occurred at our lowest latitude site at (1.27 ˝ C: Toolik Lake); (3) Surface temperatures were higher and OTCs tended to increase temperatures more at dry sites than wet sites; (4) Surface temperatures within OTCs have much broader temperature distributions then those within control plots. These results imply that plant responses within OTCs should have greater variance than those in control plots. This study serves as a foundation for future studies examining temperature-related phenomena (such as metabolism, heat stress, water stress, etc.) at finer scales, potentially targeting thermal properties of specific species, rather than just a plot average. Ground-based Light Detection and Ranging (LIDAR), in combination with detailed species abundance, and spatial composition data (i.e., proximity to neighboring plants and height differences among species present) would aid in quantifying the level to which surface structure plays a role in temperature modification to different tundra species at such a fine scale. Other variables to consider for future research are differences in temperature modification due to irradiance level, fraction direct/diffuse, sun angle, and duration of sunlight. Considering image processing techniques, when sites are geographically close, improvements are potentially attainable in similar studies if radiometric temperatures are analyzed which relieves the complications of atmospheric correction and emissivity requirements. Although, the instruments used in this study utilize on-the-fly radiometric calibration with an internal blackbody. Furthermore, the very small distance between our sensor and target reduces the impact of atmospheric effects and potential errors in emissivity assignment become negligible. Becker and Li found that if variation in emissivity and actual temperature within a pixel are small, then the radiometric temperature and the surface temperature are the same [32]. Further research could quantify the magnitude of warming by each species, using radiometric temperatures for validation of results to potentially identify thresholds for survival or mortality throughout different time periods including diurnal, weekly, monthly, and seasonal timescales to investigate potential bias by midday image acquisition times at peak growing season. We foresee future studies expanding these findings to describe species-level thermodynamics that could prove highly valuable toward a better understanding of species-specific responses to changes in Arctic climate conditions. Acknowledgments: This material is based in part upon work supported by the National Science Foundation under Grant Numbers OPP-0856710, OPP-0856516, PLR-1432982, and PLR-1432277. Any opinions, findings, and conclusions or recommendations expressed in this material are those of the author(s) and do not necessarily
Remote Sens. 2016, 8, 54
18 of 19
reflect the views of the National Science Foundation. The authors acknowledge the following for assistance in this research: Timothy Botting, Jeremy May, and Christine Pardo for aid in field data collection, the Toolik Lake Biological Field Station Staff, CH2MHill Polar Services, and UMIAQ Logistics. The authors of this manuscript also graciously acknowledge the independent peer reviewers for improving the quality of this manuscript. Additional support for Nathan C. Healey was carried out at the Jet Propulsion Laboratory, California Institute of Technology, under a contract with the National Aeronautics and Space Administration. Author Contributions: All authors assisted in the analyzing and editing of the paper. Nathan C. Healey is the main author who processed the data, developed the methodology, analyzed the results, and wrote the manuscript. Conflicts of Interest: The authors declare no conflicts of interest.
References 1. 2.
3. 4. 5.
6.
7.
8.
9. 10. 11.
12.
13.
14.
15.
Henry, G.H.R.; Molau, U. Tundra plants and climate change: The International Tundra Experiment (ITEX). Glob. Chang. Biol. 1997, 3, 1–9. [CrossRef] Arft, A.M.; Walker, M.D.; Gurevitch, J.; Alatalo, J.M.; Bret-Harte, M.S.; Dale, M.; Diemer, M.; Gugerli, F.; Henry, H.R.; Jones, M.H.; et al. Responses of tundra plants to experimental warming: Meta-analysis of the international tundra experiment. Ecol. Monogr. 1999, 69, 491–511. [CrossRef] Hollister, R.D.; Webber, P.J. Biotic validation of small open-top chambers in a tundra ecosystem. Glob. Chang. Biol. 2000, 6, 835–842. [CrossRef] Hollister, R.D.; Webber, P.J.; Tweedie, C.E. The response of Alaskan Arctic tundra to experimental warming: Differences between short- and long-term responses. Glob. Chang. Biol. 2005, 11, 525–536. [CrossRef] De Frenne, P.; de Schrijver, A.; Graae, B.J.; Gruwez, R.; Tack, W.; Vandelook, F.; Hermy, M.; Verheyen, K. The use of open-top chambers in forests for evaluating warming effects on herbaceous understory plants. Ecol. Res. 2010, 25, 163–171. [CrossRef] De Frenne, P.; Brunet, J.; Shevtsova, A.; Kolb, A.; Graae, B.J.; Chabrerie, O.; Cousins, S.A.; Decocq, G.; de Schrijver, A.; Diekmann, M.; et al. Temperature effects on forest herbs assessed by warming and transplant experiments along a latitudinal gradient. Glob. Chang. Biol. 2011, 17, 3240–3253. [CrossRef] Oberbauer, S.F.; Elmendorf, S.C.; Troxler, T.G.; Hollister, R.D.; Rocha, A.V.; Bret-Harte, M.S.; Dawes, M.A.; Fosaa, A.M.; Henry, G.H.R.; Høye, T.T.; et al. Phenological response of tundra plants to background climate variation tested using the International Tundra Experiment. Philos. Trans. R. Soc. B 2013, 368, 20120481. [CrossRef] [PubMed] Jones, M.H.; Bay, C.; Nordenhäll, U. Effects of experimental warming on Arctic willows (Salix spp.): A comparison of responses from the Canadian High Arctic Alaskan Arctic and Swedish Subarctic. Glob. Chang. Biol. 1997, 3, 55–60. [CrossRef] Johnson, D.; Campbell, C.D.; Lee, J.A.; Callaghan, T.V.; Gwynn-Jones, D. Arctic microorganisms respond more to elevated UV-B radiation than CO2 . Nature 2002, 416, 82–83. [CrossRef] [PubMed] Totland, Ø.; Alatalo, J.M. Effects of temperature and date of snowmelt on growth reproduction and flowering phenology in the arctic/alpine herb Ranunculus glacialis. Oecologia 2002, 133, 168–175. [CrossRef] Walker, M.D.; Walker, D.A.; Welker, J.M.; Arft, A.M.; Bardsley, T.; Brooks, P.D.; Fahnestock, T.; Jones, M.H.; Losleben, M.; Parsons, A.N.; et al. Long-term experimental manipulation of winter snow regime and summer temperature in Arctic and alpine tundra. Hydrol. Process. 1999, 13, 2315–2330. [CrossRef] Jones, M.H.; Fahnestock, J.T.; Walker, D.A.; Walker, M.D.; Welker, J.M. Carbon dioxide fluxes in moist and dry Arctic tundra during the snow-free season: Responses to increases in summer temperature and winter snow accumulation. Arct. Alp. Res. 1998, 30, 373–380. [CrossRef] Oberbauer, S.F.; Tweedie, C.E.; Welker, J.M.; Fahnestock, J.T.; Henry, G.H.R.; Webber, P.J.; Hollister, R.D.; Walker, M.D.; Kuchy, A.; Elmore, E.; et al. Tundra CO2 fluxes in response to experimental warming across latitudinal and moisture gradients. Ecol. Monogr. 2007, 77, 221–238. [CrossRef] Walker, M.D.; Wahren, C.H.; Hollister, R.D.; Henry, G.H.R.; Ahlquist, L.E.; Alatalo, J.M.; Bret-Harte, M.S.; Calef, M.P.; Callaghan, T.V.; Carroll, A.B.; et al. Plant community responses to experimental warming across the tundra biome. Proc. Natl. Acad. Sci. USA 2006, 103, 1342–1346. [CrossRef] [PubMed] Elmendorf, S.C.; Henry, G.H.R.; Hollister, R.D.; Bjórk, R.G.; Bjorkman, A.D.; Callaghan, T.V.; Collier, L.S.; Cooper, E.J.; Cornelissen, J.H.C.; Day, T.A.; et al. Global assessment of experimental climate warming on tundra vegetation: Heterogeneity over space and time. Ecol. Lett. 2012, 15, 164–175. [CrossRef] [PubMed]
Remote Sens. 2016, 8, 54
16. 17.
18.
19.
20. 21.
22.
23.
24.
25. 26.
27.
28. 29. 30. 31. 32.
19 of 19
Webber, P.J.; Walker, M.D. The International Tundra Experiment (ITEX): Resolution. Arct. Alp. Res. 1991, 23, 124. Brown, J.; Böcher, J.; Desforges, M.N.; Edlund, S.; Henry, G.H.R.; Johnstone, J.; Jones, G.A.; Lévesque, E.; Lewkowicz, T.; Marion, G.M.; et al. International Tundra Experiment Manual, 2nd ed.; Molau, U., Mølgaard, P., Eds.; Danish Polar Centre: Copenhagen, Denmark, 1996. Marion, G.M.; Henry, G.H.R.; Freckman, D.W.; Johnstone, J.; Jones, G.; Jones, M.H.; Lévesque, E.; Molau, U.; Mølgaard, P.; Parsons, A.N.; et al. Open-top designs for manipulating field temperature in high-latitude ecosystems. Glob. Chang. Biol. 1997, 3, 20–32. [CrossRef] Welker, J.M.; Fahnestock, J.T.; Henry, G.H.R.; O’Dea, K.W.; Chimner, R.A. CO2 exchange in three Canadian high arctic ecosystems: Response to long-term experimental warming. Glob. Chang. Biol. 2004, 10, 1981–1995. [CrossRef] Jónsdóttir, I.S.; Magnusson, B.; Gudmundsson, J.; Elmarsdottir, A.; Hjartarson, H. Variable sensitivity of plant communities in Iceland to experimental warming. Glob. Chang. Biol. 2005, 11, 553–563. [CrossRef] Wahren, C.H.A.; Walker, M.D.; Bret-Harte, M.S. Vegetation responses in Alaskan Arctic tundra after 8 years of a summer warming and winter snow manipulation experiment. Glob. Chang. Biol. 2005, 11, 537–552. [CrossRef] Bokhorst, S.; Huiskes, A.; Aerts, R.; Convey, P.; Cooper, E.J.; Dalen, L.; Erschbamer, B.; Gudmundsson, J.; Hofgaard, A.; Hollister, R.D.; et al. Variable temperature effects of Open Top Chambers at polar and alpine sites explained by irradiance and snow depth. Glob. Chang. Biol. 2013, 19, 64–74. [CrossRef] [PubMed] Chivers, M.R.; Turetsky, M.R.; Waddington, J.M.; Harden, J.W.; McGuire, A.D. Effects of experimental water table and temperature manipulations on ecosystem CO2 fluxes in an Alaskan rich fen. Ecosystems 2009, 12, 1329–1342. [CrossRef] Hollister, R.D.; Webber, P.J.; Nelson, F.E.; Tweedie, C.E. Soil thaw and temperature response to air warming varies by plant community: Results from an open-top chamber experiment in northern Alaska. Arct. Antarct. Alp. Res. 2006, 38, 206–215. [CrossRef] ACADIS Gateway: An Arctic Data Repository. Available online: http://www.aoncadis.org/projects (accessed at 25 July 2015). Healey, N.C.; Oberbauer, S.F.; Ahrends, H.E.; Dierick, D.; Welker, J.M.; Leffler, A.J.; Hollister, R.D.; Vargas, S.A.; Tweedie, C.E. A mobile instrumented sensor platform for long-term terrestrial ecosystem analysis: An example application in an Arctic tundra ecosystem. J. Environ. Inform. 2014, 24, 1–10. [CrossRef] Wilber, A.C.; Kratz, D.P.; Gupta, S.K. Surface Emissivity Maps for Use in Satellite Retrievals of Longwave Radiation; National Aeronautics and Space Administration, Langley Research Center: Hampton, VA, USA, 1999; pp. 1–31. De Boeck, H.J.; de Groote, T.; Nijs, I. Leaf temperatures in glasshouses and opentop chambers. New Phytol. 2012, 194, 1155–1164. [CrossRef] [PubMed] Ping, C.L.; Bockheim, J.G.; Kimble, J.M.; Michaelson, G.J.; Walker, D.A. Characteristics of cryogenic soils along a latitudinal transect in Arctic Alaska. J. Geophys. Res. 1998, 103, 28917–28928. [CrossRef] Miller, P.C.; Stoner, W.A.; Tieszen, L.L. A model of stand photosynthesis for the wet meadow tundra at Barrow, Alaska. Ecology 1976, 57, 411–430. [CrossRef] Beringer, J.; Lynch, A.H.; Chapin, F.S., III; Mack, M.; Bonan, G.B. The representation of Arctic soils in the land surface model: The importance of mosses. J. Clim. 2001, 14, 3324–3335. [CrossRef] Becker, F.; Li, Z.-L. Surface temperature and emissivity at various scales: Definition, measurement, and related problems. Remote Sens. Rev. 1995, 12, 225–253. [CrossRef] © 2016 by the authors; licensee MDPI, Basel, Switzerland. This article is an open access article distributed under the terms and conditions of the Creative Commons by Attribution (CC-BY) license (http://creativecommons.org/licenses/by/4.0/).