Garfinkel, Stephanie Eyes, Dawn Blake, Chris Smith, and Megan Milligan. ... Billy Aubry who helped with the majority of my plots. Veg plots are tedious ... sure I kept the delicate balance of science and their culture in mind); and High School.
EXAMINING ECOSYSTEM SERVICES AND DISSERVICES OF BEAR DAMAGE ON HOOPA VALLEY INDIAN RESERVATION
By
Shannon M. Mendia
A Thesis Presented to The Faculty of Humboldt State University In Partial Fulfillment of the Requirements for the Degree Master of Science in Natural Resources: Wildlife
Committee Membership Dr. Matthew D. Johnson, Committee Chair J. Mark Higley, Committee Member Dr. William T. Bean, Committee Member Dr. John-Pascal Berrill, Committee Member Dr. Alison O’Dowd, Graduate Coordinator
July 2016
ABSTRACT
EXAMINING ECOSYSTEM SERVICES AND DISSERVICES OF BEAR DAMAGE ON HOOPA VALLEY RESERVATION
Shannon M. Mendia
Economic loss due to tree damage by black bears (Ursus americanus) on managed timberlands has been valued at several million dollars annually in the Pacific Northwest. While bear damage to trees may negatively affect timber production, it also alters forest structure and habitat that may contribute to forest wildlife diversity. I studied the relationship between bear damage to coast Douglas-fir (Pseudotsuga menziesii var. menziesii) trees and response of cavity nesting birds on the Hoopa Valley Indian Reservation. I measured disservices from bear damage by calculating current and future timber revenue loss, and ecosystem services by calculating forest structural complexity, abundance and diversity of cavity nesting birds, and woodpecker activity. Bear damage negatively affected tree growth and estimated lumber recovery. Forest structural complexity was positively correlated with bear damage, and cavity nester abundance and woodpecker foraging activity were positively correlated to forest structural complexity and bear damage. Pileated woodpeckers and red-breasted sapsuckers used bear damaged trees out of proportion to their availability, and pileated woodpeckers selected for more structurally complex sample units. Information from this study advances our understanding of the potential for bear foraging to negatively ii
affect economic revenue and the trade-offs which help to create habitat conditions favoring other important wildlife species. To the best of our knowledge, this is the first study to evaluate ecosystem services for multiple species in relation to disservices from another species. Understanding the costs and benefits of bear damage can help guide management decisions vital to forest managers both on and off tribal lands.
iii
ACKNOWLEDGEMENTS
I would like to thank my major Advisor and mentor, Dr. Matthew Johnson, for his enthusiasm, expertise, and guidance throughout this project and throughout my entire HSU career. Thanks for taking a chance with me as a grad student knowing that I am not a stellar academic and didn't have 100% of my time to give, for rescuing me from getting lost in the details of my study by bringing me back to the big picture, time and time again, and for giving me my space and understanding that life happens, but also giving me that needed push when necessary. Thanks to my boss, mentor, and work Dad, J. Mark Higley for always having an open door for my questions even with stacks of deadlines piled up (even when he wasn't listening, it still helped me to brainstorm). Thanks for always guilt-tripping me to go the extra mile and press on to figure out a difficult analysis and for not letting me lose track of the details of this study (thankfully I had both Matt and Mark to level things out). Thanks for providing me with the baseline idea for this project and staying interested enough to help brainstorm my findings for (almost) the entire span of this study. Thanks for always helping me interpret the foreign, and most times convoluted results from the forestry side of things. Thanks to Dr. Sean Matthews, my mentor and predecessor of the Hoopa black bear conifer damage project, and one of the most patient, kind-hearted men I know, for always having an open-door (email/phone rather) policy. Thanks for always being a straight-shooter and telling me that I need to do better. As the first in my family to iv
succeed in college, I'm usually praised by my loved ones for what I do in school. Sean always pushed me to do better; I respect him for that. Thanks to Dr. William T. Bean for helping me decipher and clean up tedious R code, noticing interesting patterns in my data when I didn’t, as well as reviewing my thesis proposal and draft. Thanks to Dr. John Pascal Berrill for reviewing my thesis proposal and draft, for being thorough and catching a mistake in my calculations before the thesis was carved in stone, and for giving me advice on reasonable ways to proceed with my timber volume projections, as well as advising me to not proceed with the timber loss section of my thesis... if only I would have taken that advice. Thanks to Dr. Daniel Barton for always giving me the time of day if his door was open or if I caught him in the halls. Thanks for helping me dig through a difficult spotted owl-barred owl occupancy analysis that was completely unrelated to my thesis but almost its own thesis worth of effort. When I first met Dan, I didn't understand him because he spoke stats so fluently, but I can proudly say that I now speak Dan-ish. Thanks to Jim Campbell for hours and days and weeks of tech support (there are not enough Certs mints on the planet to repay him for his help). Thanks for walking me through multiple GIS, and LiDAR analyses, helping me with the giant hassles when my computer(s) went corrupt, and always making me laugh. Thanks to Jim Ladwig for helping me through the timber volume (disservice) part of my thesis. He painstakingly built spreadsheets for timber volume calculations based on Mark and I's wishes and his expertise and then converted them from Quattro to v
Excel. Thanks for months of brainstorming with us crazy wildlifers and for taking on FVS for my timber volume simulations, over and over again. Thanks to Matt Brinkman who helped me survive my first stats class as a grad student, which was also my intro to Program R. I teased that Matt should walk with me at graduation since he helped me with that class; not sure how I would have made it otherwise. Thanks to Darin Jarnaghan, the Hoopa Tribe's Forest Manager, for providing me field assistance, a vehicle, and equipment for the project, and for reminding me to think of plan B (just in case things don't go as planned- definitely great advice). Thanks to my "Labbies" for helping in the brainstorming process: Megan Garfinkel, Stephanie Eyes, Dawn Blake, Chris Smith, and Megan Milligan. I owe appreciation to the following people who also gave me technical assistance and helped with brainstorming: Aaron Pole, Roy Ammon, Robert Mattocks, Jeff Lindsey, Sandra Hunt-von Arb, and Dave Lamphere. This work would not have been possible without countless hours of veg plots from my awesome field helpers: especially my field technicians: Emily Culhane, and Billy Aubry who helped with the majority of my plots. Veg plots are tedious and can make a person grouchy and loopy after a while, but we survived; Friends and fellow Graduate Students who volunteered their time: Kerry Rennie (for helping with several plots as well as giving me feedback on my papers and conference abstracts) and Dawn Blake (for coming out in the field with me, always keeping it real with me, and making
vi
sure I kept the delicate balance of science and their culture in mind); and High School Interns: Cole Kane and Timothy Blake. Thanks to the Hoopa Valley Tribe for allowing me to study this tradeoff of economics and culture on their land. Thanks to the Hoopa Wildlife crew for always keeping me on my toes, and especially Anthony Colegrove and Alexandria Jarnaghan for taking the reins and running the crew in my absence. I would especially like to thank my Husband, Armando “Tito” and my family for unconditional love and support through this Grad process. I also want to thank my funders: Hoopa Tribal Forestry, Wright Refuge, and California North Coast Chapter of the Wildlife Society.
vii
TABLE OF CONTENTS
ABSTRACT ..................................................................................................................... ii ACKNOWLEDGEMENTS ............................................................................................. iv TABLE OF CONTENTS .............................................................................................. viii LIST OF TABLES ............................................................................................................ x LIST OF FIGURES ......................................................................................................... xi LIST OF APPENDICES................................................................................................ xiv INTRODUCTION ............................................................................................................ 1 METHODS ....................................................................................................................... 8 Study System ................................................................................................................ 8 Stand Selection ........................................................................................................... 12 Field Methods ............................................................................................................. 12 Economic loss from bear foraging damage ............................................................ 13 Structural complexity.............................................................................................. 16 Point-count surveys................................................................................................. 18 Woodpecker sign .................................................................................................... 19 Statistical Analysis ..................................................................................................... 20 Economic loss from bear foraging damage ............................................................ 23 Structural complexity.............................................................................................. 23 Point-count surveys................................................................................................. 24 Woodpecker sign .................................................................................................... 24 RESULTS ....................................................................................................................... 26 viii
Economic Loss from Bear Foraging Damage ............................................................ 26 Structural Complexity................................................................................................. 29 Point-Count Surveys ................................................................................................... 31 Woodpecker Sign ....................................................................................................... 33 Woodpecker Habitat Selection ................................................................................... 37 DISCUSSION ................................................................................................................. 39 LITERATURE CITED ................................................................................................... 49
ix
LIST OF TABLES
Table 1. Bear damage wound severity categorization and resulting impact on estimated volume loss. .................................................................................................................... 13 Table 2. Woodpecker Species surveyed during playback on Hoopa Valley Reservation, April 2-June 30, 2014. .................................................................................................... 19 Table 3. A priori hypothesized models and associated error structures run in R. .......... 22
x
LIST OF FIGURES
Figure 1. Black bears damage immature conifers by stripping bark and consuming the sapwood; they remove the bark with their claws and scrape the vascular tissues with their incisors. a) bear damaged Douglas-fir; b) Incisor marks on a tree's sapwood. ........ 3 Figure 2. Hupa men dressed in Brush Dance regalia, adorned with pileated woodpecker scalps. Photo credit: Dawn Blake. .................................................................................... 4 Figure 3. Traditional Hupa houses (or xontahs) with round hole for entrance (unknown source)............................................................................................................................... 5 Figure 4. Study area on the Hoopa Valley Indian Reservation. a) Located in Northwestern California; b) 82 sample units randomly placed within 44 harvest units; c) Data were collected in four systematically placed subplots and 1 three-legged transect, as well as one point-count survey per sample unit. ........................................................ 11 Figure 5. Decay Classification categories for snags and logs (Maser et al. 1979; Backhouse and Lousier 1991; Pederson 1991). .............................................................. 17 Figure 6. a.) Pileated woodpecker foraging sign is distinctive with large (>6"), deep, rectangular excavations; b.) Red-breasted sapsucker sapwells are distinctive rows of small holes. ..................................................................................................................... 20 Figure 7. Model prediction of timber revenue lost to bear damage ($) per hectare and increasing % timber volume loss due to bear damage, when accounting for harvest unit and elevation held constant at the median value (847.5m). Shaded area represents the 95% confidence interval. Points represent the raw current timber revenue values per hectare. ............................................................................................................................ 27 Figure 8. Model prediction of structural complexity index and increasing % timber volume loss due to bear damage, when accounting for harvest unit and elevation held constant at the median value (847.5m). Shaded area represents the 95% confidence interval. Points represent the raw structural complexity index values. .......................... 29 Figure 9. Bear foraging damage increases forest structural complexity in old clear-cuts on the Hoopa Valley Reservation. Shown here is a range of forest structural complexity related to bear damage. Bear-killed trees turn to snags that house invertebrate woodpecker forage, and the broken snags turn to logs. Canopy gaps from the dead trees allow sun to reach the understory, increasing the physiognomic as well as structural complexity. ..................................................................................................................... 30
xi
Figure 10. Model prediction of cavity nesting bird abundance and increasing a.) structural complexity index, and b) % timber volume loss due to bear damage, when accounting for harvest unit and wind held constant at the median value (0.61). Shaded area represents the 95% confidence interval. Points represent the raw cavity nesting bird abundance values. ........................................................................................................... 32 Figure 11. Model prediction of abundance of trees with woodpecker foraging sign and increasing a.) structural complexity index, and b) % timber volume loss due to bear damage, when accounting for harvest unit and elevation held constant at the median value (847.5 m). Shaded area represents the 95% confidence interval. Points represent the raw abundance of trees with woodpecker foraging sign values. .............................. 34 Figure 12. Model prediction of abundance of trees with pileated woodpecker foraging sign and increasing a.) structural complexity index, and b) % timber volume loss due to bear damage, when accounting for harvest unit and elevation held constant at the median value (847.5 m). Shaded area represents the 95% confidence interval. Points represent the raw abundance of trees with pileated woodpecker foraging sign values. . 35 Figure 13. Model prediction of abundance of trees with red-breasted sapsucker sapwells and increasing % timber volume loss due to bear damage, when accounting for harvest unit and elevation held constant at the median value (847.5 m). Shaded area represents the 95% confidence interval. Points represent the raw abundance of trees with redbreasted sapsucker sapwells values. ............................................................................... 36 Figure 14. Red-breasted sapsuckers select for bear damaged trees for sapwells in old clear cut harvest units on Hoopa Valley Indian Reservation, in Northwestern California. ........................................................................................................................................ 37 Figure 15. Tradeoff between cultural ecosystem service (creation of structure for use by pileated woodpeckers) and economic disservice (loss of timber revenue). Model prediction of timber revenue and abundance of trees with pileated woodpecker foraging sign and increasing % timber volume loss due to bear damage, when accounting for harvest unit and elevation held constant at the median value (847.5 m). Green line and shaded area represents the model prediction and 95% confidence interval of timber revenue lost to bear damage and the red dashed line and shaded area represents the model prediction and 95% confidence interval of abundance of trees with pileated woodpecker foraging sign. Green circles represent the timber revenue loss values and red triangles represent the abundance of trees with pileated woodpecker foraging sign values. ............................................................................................................................. 42 Figure 16. Bear-created canopy openings possibly increase deer use of clear-cut stands on the Hoopa Valley Indian Reservation, in northwestern California. a-c) bear-created gaps in the forest canopy; d) deer forage on western swordfern (Polystichum munitum) in a canopy gap; e) deer scat in a canopy gap. ................................................................ 44 xii
Figure 17. Small mammal activity may be increased in areas with bear damage on the Hoopa Valley Indian Reservation, in northwestern California. a) Douglas' squirrel (Tamiasciurus douglasii) midden at the base of a bear damaged tree; b) Tanoak acorns eaten by unknown rodents; c) Douglas-fir cones eaten by Douglas' squirrels. .............. 45
xiii
LIST OF APPENDICES
Appendix A. Parameter estimates (β), unconditional standard errors, lower and upper 95% confidence intervals, AICc values, degrees of freedom, log likelihood, AICc weight, and marginal and conditional R2 from final set of generalized linear mixed models. Model averaged estimates have an asterisk (*) next to the estimate. 95% confidence intervals were bolded if the values did not cross over zero. Hoopa Valley Indian Reservation, April-November 2014. ................................................................... 58 Appendix B. Ehrlich et al. (1988) categorization of bird species detected during breeding season point count surveys (April 2- June 30, 2014) on Hoopa Valley Indian Reservation, Humboldt County, California. ................................................................... 62
xiv
1 INTRODUCTION
“The Hoopa Valley Tribe (HVT) is rich with natural resources and is dedicated to the protection and sustainability of those resources today and for future generations” (Hoopa Valley Tribe 2013). Hoopa refers to the geographic location (e.g., the Hoopa Valley) and Hupa refers to the people and culture (Golla 1996). The language and cultural practices of the Hupa people, which they have maintained for millennia, are reliant on stewardship of and reverence for their natural resources. The Hupa people perceive the enhancement of human community wellbeing and of the forest ecosystem as mutually dependent goals (Baker 2003). Timber management is the largest source of revenue and employment for the HVT, and its economy relies heavily on timber harvest. The Bureau of Indian Affairs managed forests on the reservation for decades, and relied on even-aged management with little residual structural diversity. After 1989, HVT increased their sovereignty through “Self Governance” and thereafter managed their forests according to the community-based Forest Management Plan (FMP) created in 1994. Their FMP was recognized as being exemplary and communitybased by the United Nations in 1995, and timber from the Tribe has been certified as Ecologically Sustainable by the Forest Stewardship Council® since 1999. In the Hupa culture, American black bears (Ursus americanus) (hereafter, bears) are considered human relatives. “Bears have significance as a symbolic spiritual figure; they are not hunted for food like black-tailed deer (Odocoileus hemionus), they are a
2 spiritual being that is honored” (Brandon B. Colegrove, Hupa tribal member, pers. comm., 2013). Ecologically, the role of bears in the forests on the Hoopa Valley Indian reservation (HVIR) is complex. Bears perform as seed dispersers and nutrient providers in Hoopa forests, breaking up downed logs while searching for insects, and accelerating the decay process in the forest as well as the return of nutrients to the soil (Rogers and Applegate, 1983). Economically, perhaps the most significant effect of bears in the region stems from their damage to timber production. It is a common problem across western North America for bears to damage immature conifers by stripping bark and consuming the sapwood (phloem and xylem oleoresin located immediately underneath the cork cambium; Kimball et al. 1998); in some cases this damage kills trees (Glover 1955; Higley et al. 2006). Damage follows emergence of bears from winter dens and corresponds with the period of new sapwood growth (Flowers 1987; Partridge et al. 2001). Healthy, growing trees contain an abundance of simple sugars (such as sucrose, glucose, and fructose; Radwan 1969; Kimball et al. 1998) and have loose bark. While they are in the process of converting starch stored in the sapwood back to sugars to transport through the tree, bears remove the bark with their claws and scrape with their incisors the vascular tissues that are high in carbohydrates (Figure 1). Once the bark of the tree has been removed, the tree is exposed to the elements (water, fungus, disease, etc.) and therefore vulnerable to decay and death.
3
Figure 1. Black bears damage immature conifers by stripping bark and consuming the sapwood; they remove the bark with their claws and scrape the vascular tissues with their incisors. a) bear damaged Douglas-fir; b) Incisor marks on a tree's sapwood.
The silvicultural practice of pre-commercially thinning can lead to extensive bear damage. Thinning (pre-commercial) occurs when trees are felled in immature stands, prior to them achieving commercial size, in order to stimulate growth of remaining trees to increase the total yield from the stand (Smith 1962). The accelerated growth increases sugar content in sapwood that attracts bears (Mason and Adams 1989). In Montana, Mason and Adams (1989) found five times as much bear damage in thinned stands than those not thinned. On HVIR, 17% of cut-over forest has been precommercially thinned (Hoopa Valley Tribe 2013). Of the pre-commercially thinned stands, at least 51% of those dominated by Douglas-fir (Pseudotsuga menziesii) had been impacted by bear damage as of fall 1999 (Hoopa Tribal Forestry 2001). While damage to trees from bears may negatively affect timber production, it also alters forest structure and habitat that may contribute to forest wildlife diversity including, and perhaps especially, for woodpeckers.
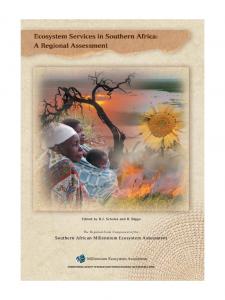
4 Woodpeckers, especially pileated woodpeckers (Dryocopus pileatus), are also culturally significant to the Hupa people. Jordan (2012) describes reciprocity between Hupa people and the woodpecker. Woodpeckers adorn their sacred regalia and are highly honored as an important part of their dances (Figure 2). Ceremonial regalia are considered to be the most valuable possessions for the Hupa people as each piece of regalia possesses a spirit. This spirit is cared for and danced in ceremonies to prevent the world from sickness and famine. This is one reason woodpeckers are revered as the most sacred, culturally significant animals to the Hupa people. “Woodpeckers are found either directly informing or influencing aspects of traditional Hupa architecture (Figure 3), formal economy, spiritualism, mythology, and religious ceremony” (Jordan 2012).
Figure 2. Hupa men dressed in Brush Dance regalia, adorned with pileated woodpecker scalps. Photo credit: Dawn Blake.
5
Figure 3. Traditional Hupa houses (or xontahs) with round hole for entrance (unknown source).
Woodpeckers are responsive to forest structure and local habitat conditions. Many studies have reported positive correlations between the abundance of woodpeckers (and birds in general) and certain habitat characteristics such asthe availability of large diameter at breast height (DBH) live and dead trees (Mannan et al. 1980; Savignac et al. 2000; Aubrey and Raley 2002a; Aubrey and Raley 2002b; Hartwig et al. 2004; Vaillancourt et al. 2008), basal area of trees and snags (Hartwig et al. 2006), tree species diversity (Aubrey and Raley 2002a; Tews et al. 2004; Drever et al. 2008), canopy cover (Renken and Wiggers 1989; Bull and Holthausen 1993), crown ratio (Fan et al. 2003), supply of dead and declining trees (Harris 1983; Bull and Holthausen 1993; Savignac et al. 2000; Aubrey and Raley 2002a; Hartwig et al. 2002; Vaillancourt et al. 2008) and downed woody debris (Renken and Wiggers 1989; Bull and Holthausen 1993; Hartwig et al. 2002; Hartwig et al. 2006; Rosenvald et al. 2011), availability of trees at different stages of decay (Tews et al. 2004; Vaillancourt et al. 2008), and elevation (Hartwig et al. 2004). Timberlands managed primarily for wood
6 production are notoriously limited in structural diversity and natural habitat elements. Many of these habitat characteristics may become available in stands that have been damaged by bears, but this had yet to be documented rigorously before this project. A better understanding of the potential for bear foraging to negatively affect economic revenue and to create habitat conditions favoring other important wildlife species (esp. woodpeckers) is vital for Hoopa Forest managers to fully evaluate impacts of bear damage to the Hoopa Tribe. This project sought to provide this understanding. While the specific outcomes of the research are applicable to the Hupa, this case study is more generally relevant to the field of conservation science. In the last twenty years the concept of ecosystem service values has been mainstreamed in the field of conservation biology (Gómez-Baggethun et al. 2010; Fisher et al. 2009), yet the concept has also been sharply criticized for several reasons, including its supposed assumption that nature is benevolent (McCauley 2006, Child 2009). Moreover, the recognition of ‘cultural services’ has been neglected compared to services with more direct economic impact. This is due to the intangible nature of cultural services; they are difficult to characterize and even more so to measure, yet they present some of the most compelling reasons for conserving ecosystems (Chan et al. 2012; Milcu et al. 2013; Satz et al. 2013). This project is one of the first to explicitly acknowledge trade-offs in positive and negative ecosystem services (i.e., services and disservices; Zhang et al. 2007), and is one of the first to offer information useful in balancing economic and cultural services.
7 The objective of this study was to investigate the relationship between bear damage and: 1) monetary loss to the tribe, 2) structural complexity of forest attributes, and 3) composition and structure of bird communities. I hypothesized that the ecological value of increased habitat structure for woodpeckers would increase cultural value of stands and may ameliorate the monetary loss in value of timber due to bear damage. To examine this hypothesis, I tested the following predictions: 1) bear damage results in measurable monetary loss; 2) structural complexity is positively associated with bear damage; and 3) abundance and diversity of cavity-nesting birds and foraging sign of culturally significant woodpeckers is positively associated with structural complexity and bear damage.
8 METHODS
Study System
This study was conducted on the Hoopa Valley Indian Reservation (HVIR), in northwest California (Figure 4a), located within the Klamath physiographic province (Küchler 1977). The area of HVIR is approximately 367 km2, and elevation ranges between 75 and 1511 meters. Forests have an overstory dominated by Douglas-fir and a midstory dominated by hardwood trees including tanoak (Lithocarpus densiflorus), madrone (Arbutus menziesii), California black oak (Quercus kelloggii), and canyon live oak (Quercus chrysolepis). In some areas hardwood dominated stands occur. At higher elevations, the Douglas-fir canopy is replaced by white fir (Abies concolor) and pine (Pinus sp.). The shrub layer is extensively dominated by evergreen huckleberry (Vaccinium ovatum), tobacco brush (Ceanothus velutinus), or salal (Gaultheria shallon). The nonforested areas are made up of urban areas, previously maintained prairies, large rock outcrops, and brush fields, which are irregularly distributed through the otherwise forested landscape. The Trinity River splits HVIR into east and west sections (Figure 4b). Prior to implementation of the Tribe's FMP, stands were clear-cut, with harvest units averaging 12-20 ha. Thirty percent of the reservation was harvested between 1960 and 1980, averaging over 500 ha cut annually. The resulting even-aged second-growth forests now cover roughly 40% of HVIR’s forested land and lack the structural diversity
9 characteristic of old growth stands (Matthews et al. 2008a; Higley 2012). The Tribe’s current forest management program includes timber harvesting of 9.85 million board feet on roughly 150 ha and pre-commercial thinning of roughly 165 ha annually. Clearcutting is a practice that has not been used on the reservation since the Tribe began implementing its own FMP. The Tribe now manages their forest with future generations in mind, leaving trees that benefit wildlife, such as snags, logs, and live trees with defects (such as cavities and scars). Historic and recent timber harvests on HVIR have resulted in a mix of mature-old growth forest and early seral forest. Tree damage by bears was initially observed in the northwest corner of HVIR in 1977 and in July 1990 a survey for bear-damaged trees was conducted (Abbott 1994). Abbott (1994) categorized damage severity on HVIR based on the percent of the tree circumference damaged and reported 42% of measured trees to have some damage. The decrease in quality of trees equates to loss of tribal income, but this had not been rigorously documented on HVIR. There is probably a higher potential economic impact from bear damage on HVIR than most other areas within the Pacific Northwest (Higley et al. 2006) because HVIR sustains one of the densest populations of black bear in the continental United States (Matthews 2002; Matthews et al. 2008b). Bear damage to trees was estimated to reduce the allowable annual timber harvest by at least 15%, which equates to about two million dollars annually (Higley et al. 2006; Higley 2012; Hoopa Tribal Forestry 2001). The evident economic burden consequently led the Tribe’s Cultural leaders to approve a bear damage control plan, which attempted to
10 identify and remove individual bears known to be damaging trees from the population. The goal of the plan was to decrease the spread and intensity of bear damage while having the least impact on the local black bear population (Hoopa Tribal Forestry 2001; Higley et al. 2006). However, this plan ended in 2010 due to lack of funding (Mark Higley, pers. comm., 2013) and currently there is no explicit bear management in place.
11
Figure 4. Study area on the Hoopa Valley Indian Reservation. a) Located in Northwestern California; b) 82 sample units randomly placed within 44 harvest units; c) Data were collected in four systematically placed subplots and 1 three-legged transect, as well as one point-count survey per sample unit.
12 Stand Selection
To test my predictions, I selected harvest units with varying levels of bear damage on HVIR. To minimize effects of confounding variables, the selected harvest units met each of three criteria: 1) clear-cut, 2) logged 40-57 years ago (between 19571974), and 3) pre-commercially thinned. Forty-three harvest units across the reservation matched these criteria, providing a range of variation representative of conditions on my study area. Although the Tribe no longer harvests in ways that produce such uniform stands, this design was helpful in revealing the ongoing ecological and economic effects of bear damage on previously clear-cut logged, regenerating stands. Field Methods
Data were collected on 82 sample units distributed randomly within the 43 harvest units (Figure 4b). Harvest units ranged in size from 6 to 92 ha (mean ± 1 SE: 34 ± 2.5). To ensure independence between sample units, they were distributed with their centers at least 250 m apart and 100 m from the harvest unit edge using ArcMAP 10.1 (ESRI 2012) through Geospatial Modeling Environment (Beyer 2012). The number of sample units per harvest unit varied from 1 to 7. I collected bear damage data on four 0.02 ha circular subplots (8 m radius) placed within each sample unit. The first subplot was placed at the center of each sample unit and three more subplots were placed at fixed azimuths and distances (0°, 120°, and 240°), each at 50 m from the center of the
13 sample unit (Figure 4c). Habitat characteristics were collected from a combination of on-the-ground data on subplots along with entire sample-unit level data from GIS and LiDAR. Point count surveys were conducted at the center of each sample unit. Woodpecker sign data was collected on subplots as well as on one three-legged transect per sample unit that consisted of two 50m legs and one 90m leg while walking between subplots (Figure 4c). Economic loss from bear foraging damage Bear foraging damage was easily identified by a presence of incisor grooves on the sapwood (Figure 1b; Maser 1967; Poelker and Hartwell 1973). During subplot vegetation measurements, if a measured tree was damaged by bear foraging, I noted location, surface area, and severity of the wound. Wound severity was categorized as minor, moderate or high using several characteristics, including wood surface area exposed, % conductive remaining tissue, and % wound healed (Table 1). If a wound was too high to reach I visually estimated the measurements. Table 1. Bear damage wound severity categorization and resulting impact on estimated volume loss.
Wound Severity
% Circumference girdled
% Conductive tissue
% Volume Loss at wound
Minor
0-30
100
0
Moderate
31-50
100
50
High
51-100
>25
100
14 Douglas-fir was the only tree species to be analyzed for this study; it dominates the HVIR, is the HVTs primary forest product, and 99% of bear damaged trees were Douglas-fir. In order to identify the economic loss due to bear foraging damage, I calculated current timber volume loss (loss of volume due to bear foraging damage at the time the plot was measured) as well as the projected volume loss at the time of scheduled future harvest. Current timber volume loss. I calculated current loss in timber volume at each sample unit using summed measurements from each subplot (from the above section “Bear foraging damage”). First, because only conifers are sold by the Tribe, I subsetted conifers from the LiDARderived tree heights at the mean minimum height for 10” DBH Douglas-fir trees, 14 m (mean minimum height obtained using the Hoopa Tribe’s Continuous Forest Inventory survey data from 1981-2015, n = 378). I then extracted the mean conifer tree height for each sample unit from LiDAR data. Then, working with the Forest Inventory Forester for Hoopa Tribal Forestry (James Ladwig, pers. comm., 2016), a spreadsheet was created to calculate segment volume in board feet (bf1) for each tree, and account for the volume loss due to bear damage. Total segment volume for each measured Douglas-fir was calculated using formulas from Wensel and Krumland (1983), including the diameter of inside bark at point above breast height and diameter of inside bark at 1 foot 1
A board foot is a standard silvicultural unit of timber volume; it corresponds to the volume of a 1 square foot of wood one inch thick. Board feet (bf) are used in this thesis as a measure of wood volume, rather than a metric volume measure such as m3, because of its universal use in the timber industry (1000 bf = 2.36 m3).
15 (0.30 m) stump height, and the sum of each tree’s volume provided a measure of gross bf in the sample unit. Volume lost to bear damage was then calculated for each live tree segment, using the categorizations for volume loss at wound based on wound location, height, and severity (Table 1). Dead trees were considered 100% volume loss. After deducting volume lost to bear damage from gross bf volume, the net bf volume was estimated (Oester and Bowers 1999). Simulated timber volume loss. For a more complete assessment of timber volume loss, calculations needed to account for projected tree growth over a 20-40 year span, when the harvest units I surveyed would be logged next. I used the Northern California variant of the Forest Vegetation Simulator (Version2.02; Dixon 2002; FVS-NC) model to simulate growth on each harvest unit for a period of 25-40 years depending on a unit’s current age, to a harvest age of 80 years. FVS is an individual-tree, semi-distance-independent, growth and yield model (Dixon 2002). A substantial portion of the NC variant of FVS was based on 1986 Hoopa Continuous Forest Inventory data, so I was confident that the model produced projections relevant to my study area. I collected individual stand reports for every 10 years of the simulation, which included the simulated number of individuals, their DBH, height, species, merchantable volume, and percent defect. Tree growth was simulated two different ways: 1) with surviving trees grown forward, and 2) with trees killed by bear damage simulated to be alive and grown forward with the model. The second method, with killed trees "stood back up and grown," more realistically accounts
16 for the loss of future timber volume that would have accumulated if bear damage had not occurred. Defect volume due to bear damage was allowed to grow with the trees maintaining a constant percent defect. In other words, if a tree had defect from bear damage when measured, the projected tree volume would be corrected by multiplying the percent defect by the predicted gross volume. Ingrowth was incorporated into FVS growth projections using count data for young trees (24.5cm DBH, I recorded species, DBH using Spencer® logger’s tape, height using a Relaskop® or clinometer, crown ratio, and 9-category scale of decay class (Maser et al. 1979; Petersen 1991; Figure 5). I calculated the ShannonWeiner diversity of shrubs and trees in each sample unit using the Vegan 2.2-1 package in Program R (Oksanen et al. 2007). I estimated basal area of live and dead trees for each subplot using a Reliskop®, by projecting the index derived from subplot measurements.
Figure 5. Decay Classification categories for snags and logs (Maser et al. 1979; Backhouse and Lousier 1991; Pederson 1991).
18 Point-count surveys To characterize the cavity-nesting bird community I surveyed diurnal birds at each sample unit during the breeding season (April 2 to July 31, 2014) with playbackaugmented, point-count surveys. Surveys were conducted between 15 minutes before sunrise and 4 hours after sunrise (McGarigal and McComb 1995; Ralph et al. 1995a). At every sample unit I recorded temperature, cloud cover, wind on the Beaufort scale, and precipitation. I did not survey in rain, cold drizzle, sleet, snow, heavy ground fog or wind >34 km/hr (Huff et al. 2000, Ralph et al. 1995a). Upon arrival to a sample unit, I waited at least two minutes to allow birds to resume normal activity (McGarigal and McComb 1995; Huff et al. 2000) and then recorded all birds detected at any distance during a 10 min sampling period. All point-count surveys were conducted by myself to avoid observer bias (Howe et al. 1995, Ralph et al. 1995a). Woodpeckers can be difficult to detect during point count surveys, due to their large home ranges and often secretive nature. To increase their detection rate, each 10min point count was immediately followed by broadcast surveys for woodpeckers, including a mixture of territorial calls and drumming (Johnson et al. 1981; Marion et al. 1981; Mosher et al. 1990; Setterington et al. 2000; Drever et al. 2008; Drever and Martin 2010). I played two minutes of calls and drums followed by 1 minute of listening for each species present on HVIR (Table 2). Point-count and broadcast surveys were approved by the Humboldt State University Animal Care and Use Committee (Protocol 13/14.W.99-A).
19 Table 2. Woodpecker Species surveyed during playback on Hoopa Valley Reservation, April 2-June 30, 2014.
Common name Acorn Woodpecker Red-breasted Sapsucker Downy Woodpecker Hairy Woodpecker Northern Flicker Pileated Woodpecker
Scientific name Melanerpes formicivorus Sphyrapicus ruber Picoides pubescens Picoides villosus Colaptes auratus Dryocopus pileatus
Woodpecker sign When woodpecker sign was located, I noted its presence, species (if known), sign type (roost or nest hole or foraging sign), whether bear damage was present on the structure, tree species, DBH, height, crown class, crown ratio, and decay class, as described in more detail below. Pileated woodpeckers and Red-breasted sapsuckers (Sphyrapicus ruber) have distinctive foraging sign, and thus were the only species whose sign were confirmed. Pileated woodpecker forage sign is distinguished from other species of woodpecker by the large (>15cm long), deep, rectangular excavations they drill (Bull and Jackson 1995) and red-breasted sapsuckers drill a series of shallow holes (sap wells) in the tree bark to provide access to sap on return visits (Figure 6).
20
Figure 6. a.) Pileated woodpecker foraging sign is distinctive with large (>6"), deep, rectangular excavations; b.) Red-breasted sapsucker sapwells are distinctive rows of small holes.
Statistical Analysis
All predictor variables were centered and scaled before analysis. All analyses were carried out using linear mixed models (LMMs) and generalized linear mixed models (GLMMs) via the ‘lme4’ package in R (version 1.1-11; Bates et al. 2014) with harvest unit as the random effect for all models. Using stepwise regression, I first determined which of 5 potential nuisance variables was most strongly associated with cavity-nester abundance (Julian date, elapsed time since sunrise, cloud cover, temperature, and wind), which was then used in all subsequent models examining hypothesized effects of habitat. Similarly, I determined which of 2 potential nuisance variables for woodpecker sign abundance (mean elevation and quadratic mean
21 elevation) and then used that variable in all woodpecker sign, structural complexity, and timber revenue models. Each response variable was modeled with the corresponding significant nuisance variable, both with and without each predictor variable and then compared using model selection. Model selection was executed using the ‘MuMIn’ package in R (version 1.15.6; Barton and Barton 2015). The best fitting model was selected from an a priori set of models with an information theoretic approach using Akaike’s Information Criterion (AICc) and Akaike weights adjusted for small sample size (Burnham and Anderson 2002; Table 3). The ‘best’ model with respect to AICc was assumed to be the one with the lowest AICc value, indicating greatest model parsimony and weight of evidence. If more than 1 model in the model set had ΔAICc value 25.4cm DBH) live trees, 4) number of large dead trees, 5) Shannon-Weiner diversity of tree species, 6) Shannon-Weiner diversity of shrub species, 7) percent canopy gap, 8) stand height, 9) coefficient of variation (CV) of DBH of measured trees, 10) Huber
24 volume of downed woody debris (Wenger 1984), 11) number of decay classes present, and 12) CV of canopy cover. These values were scaled from 0-10 and then added together (McElhinny et al. 2006) and the resulting value, SCI, was then analyzed as a single predictor value against the response variables using GLMMs. To determine whether bear damage predicts structural complexity, I modeled a LMM with SCI as the response and percent volume lost to bear damage as the predictor (Table 3). Point-count surveys Birds were classified into cavity-nesters or non cavity-nesters (Ehrlich et al. 1988) and into woodpeckers and non-woodpeckers. To determine whether forest structural complexity or bear damage were significant predictors of abundance or diversity of cavity nesting birds or abundance of woodpeckers, I modeled each response variable against each predictor variable using GLMMs (Table 3). Woodpecker sign To determine whether forest structural complexity or bear damage were significant predictors of woodpecker sign, I modeled each response variable against structural complexity and bear damage using GLMMs (Table 3). Abundance of trees with any woodpecker species' sign, with pileated woodpecker sign, and with red-breasted sapsucker sign were modeled using GLMMs with Poisson error distribution. Using presence of species-specific foraging sign, GLMMs with binomial error distribution allowed for interpretation of selection of sample units by pileated woodpeckers and red-breasted sapsuckers via a resource
25 selection function (RSF) framework (Manly et al. 2002). This corresponds to design 1 from Thomas and Taylor (1990, 2006), with resource availability and use being measured at the population level of pileated woodpeckers and red-breasted sapsuckers. All sample units were considered “available”, and considered “used” by each species if their confirmed sign was present (Boyce and McDonald. 1999; Boyce et al. 2002; Manly et al. 2002; Lemaître and Villard 2005; Johnson et al. 2006). Available sample units were coded as “0” and used sample units as “1” (Manly et al. 2002). Predictions generated from a RSF are relative measures of habitat selection, not true probabilities of the occurrence of pileated woodpeckers and red-breasted sapsuckers.
26 RESULTS
Economic Loss from Bear Foraging Damage
I examined 3241 Douglas-fir trees and found 24% to be damaged from bear foraging wounds and 12% to be killed by those wounds (50% of damaged trees were killed). Timber revenue lost due to bear damage was strongly associated with volume loss due to bear damage, however net timber revenue was not, when accounting for harvest unit and elevation. Current timber revenue lost due to bear damage was strongly associated with timber volume lost due to bear damage (Figure 7), with timber volume lost due to bear damage ranging from 0-30% (mean = 5.6%). This corresponded to a timber revenue loss of $0 to $7,889 per hectare (mean=$1,349). The model with the strongest support (ΔAICc = 0, model weight = 1.0) included elevation and timber volume lost due to bear damage (Appendix A). The top model included positive effects of both elevation and volume lost due to bear damage (Appendix A). Among the estimates from the top model, the only parameter whose 95% confidence interval did not overlap zero was volume lost due to bear damage (β=1841; 95% CI: 1703 – 1978; Appendix A). However, current timber revenue was not strongly associated with the volume loss due to bear damage. The model predicting current timber revenue with the strongest support (ΔAICc = 0, model weight = 1.0) included both elevation and volume
27 lost due to bear damage (Appendix A), but the parameters had a coefficients with 95% confidence interval overlapping zero (elevation: β = 1841; 95% CI: -393 – 4076; volume lost due to bear damage: β = -797; 95% CI: -2890 – 1296; Appendix A).
Figure 7. Model prediction of timber revenue lost to bear damage ($) per hectare and increasing % timber volume loss due to bear damage, when accounting for harvest unit and elevation held constant at the median value (847.5m). Shaded area represents the 95% confidence interval. Points represent the raw current timber revenue values per hectare.
Likewise, future timber revenue lost due to bear damage, simulating the surviving trees on each harvest unit grown to 80 years, was strongly associated with timber volume lost due to bear damage (ranged from 0-9% (mean=1.4%)). This corresponded to a timber revenue loss of $0 to $4,669 per hectare (mean=$726). The model with the strongest support (ΔAICc = 0, model weight = 1.0) included elevation and timber volume lost due to bear damage (Appendix A). The top model included positive effects of both elevation and volume lost due to bear damage (Appendix A). Among the estimates from the top model, the only parameter whose 95% confidence
28 interval did not overlap zero was volume lost due to bear damage (β=0.99; 95% CI: 0.95 – 1.03; Appendix A). However, as with current timber revenue, future timber revenue was also not strongly associated with the volume loss due to bear damage. The model with the strongest support (ΔAICc= 0, model weight=1.0) included only elevation (Appendix A), but again the parameter had a coefficient with 95% confidence interval overlapping zero (elevation: β 0.21; 95%CI: -0.03 – 0.46; Appendix A). Future timber revenue lost due to bear damage, projected with dead trees "stood back up and grown" to 80 years old, was also strongly associated with timber volume lost due to bear damage. The model with the strongest support (ΔAICc = 0, model weight = 1.0) included elevation and timber volume lost due to bear damage (Appendix A). The top model included positive effects of both elevation and volume lost due to bear damage (Appendix A). Among the estimates from the top model, the only parameter whose 95% confidence interval did not overlap zero was volume lost due to bear damage (β=0.96; 95% CI: 0.91 – 1.0; Appendix A). Future timber revenue projected with dead trees "stood back up and grown" to 80 years old was also not strongly associated with the volume loss due to bear damage (Ranged from 0-26.4% (mean=3.2%), but resulted in an overall projected monetary loss, corresponding to a timber revenue loss of $0 to $12,880 per hectare (mean=$1,660). The model with the strongest support (ΔAICc= 0, model weight=0.84) included elevation only (Appendix A). The estimate from the top model, elevation, had
29 a parameter whose 95% confidence interval overlapped zero (elevation: β=0.12; 95%CI: -0.02 – 0.47; Appendix A).
Structural Complexity
Structural complexity was positively associated with percent volume lost due to bear damage (Figure 8 and Figure 9). Stepwise regression revealed that elevation was the important nuisance variable for structural complexity models. The model with the strongest support (ΔAICc= 0, model weight=0.85) included both elevation and timber volume lost due to bear damage (Appendix A). Among the estimates from the top model, the only parameter whose 95% confidence interval did not overlap zero was volume lost due to bear damage (β=2.1; 95% CI: 0.02 – 4.2; Appendix A).
Figure 8. Model prediction of structural complexity index and increasing % timber volume loss due to bear damage, when accounting for harvest unit and elevation held constant at the median value (847.5m). Shaded area represents the 95% confidence interval. Points represent the raw structural complexity index values.
30
Figure 9. Bear foraging damage increases forest structural complexity in old clear-cuts on the Hoopa Valley Reservation. Shown here is a range of forest structural complexity related to bear damage. Bear-killed trees turn to snags that house invertebrate woodpecker forage, and the broken snags turn to logs. Canopy gaps from the dead trees allow sun to reach the understory, increasing the physiognomic as well as structural complexity.
31 Point-Count Surveys
I detected a total of 1404 birds of 47 species across all point count surveys. Thirteen species were determined to be cavity nesters (n = 335) and 6 species were woodpeckers (n = 100) (Appendix B). By far, the most abundant cavity nesting species detected was chestnut-backed chickadee (n = 111). As a group, cavity-nesting bird abundance (Figure 10), but not diversity, was positively associated with SCI and bear damage using point-count data. Stepwise regression resulted in wind being the important nuisance variable for point-count models. With SCI as a predictor, the abundance of cavity nesters model with the strongest support (ΔAICc= 0, model weight=0.73) included wind and SCI (Figure 10a; Appendix A). Among the estimates from the top model, the only parameter whose 95% confidence interval did not overlap zero was SCI (wind: β=-0.11; 95%CI: -0.25 – 0.03; SCI: β=0.13; 95%CI: 0.01 – 0.25; Appendix A). With bear damage as a predictor, the model with the strongest support (ΔAICc= 0, model weight=0.81) included wind and volume lost due to bear damage (Figure 10b; Appendix A). Among the estimates from the top model, the only parameter whose 95% confidence interval did not overlap zero was volume lost due to bear damage (wind: β=-0.12; 95%CI: -0.25 – 0.01; volume lost due to bear damage: β=0.15; 95%CI: 0.03 – 0.27; Appendix A).
32
Figure 10. Model prediction of cavity nesting bird abundance and increasing a.) structural complexity index, and b) % timber volume loss due to bear damage, when accounting for harvest unit and wind held constant at the median value (0.61). Shaded area represents the 95% confidence interval. Points represent the raw cavity nesting bird abundance values.
Separating woodpeckers as a group did not show the same relationship as the more broad cavity-nesters group. Woodpecker abundance was not strongly associated with SCI or bear damage. With SCI as a predictor, the woodpecker abundance model with the strongest support (ΔAICc= 0, model weight=0.75) included only wind (Appendix A). The estimate from the top model, wind, had a parameter whose 95% confidence interval did not overlap zero (β=0.02; 95%CI: -0.27 – 0.31; Appendix A). With bear damage as a predictor, the models had nearly the same weight and both had ΔAICc values < 2, so I used model averaging to extract parameter estimates. Both had 95% confidence intervals that overlapped zero (Wind: β=0.02; 95%CI: -0.27 – 0.31; volume lost due to bear damage: β=0.21; 95%CI: -0.08 – 0.5; Appendix A). Species diversity of cavity nesting birds was also not strongly associated with SCI or bear damage. With SCI as a predictor, the cavity nester diversity model with the
33 strongest support (ΔAICc= 0, model weight=0.98) included only wind (Appendix A). The estimate from the top model, wind, had a parameter whose 95% confidence interval did not overlap zero (β=-0.09; 95%CI: -0.15 – -0.03; Appendix A). With bear damage as a predictor, the model with the strongest support (ΔAICc= 0, model weight=0.96) included only wind (Appendix A). The estimate from the top model, wind, had a parameter whose 95% confidence interval did not overlap zero (β=-0.09; 95%CI: -0.15 – -0.03; Appendix A). Woodpecker Sign
I inspected a total of 3547 trees of 10 species across all sample units for woodpecker sign. Overall, 77% of trees with woodpecker foraging sign and 99% of trees with bear damage were Douglas-fir, so only Douglas-fir relationships were analyzed in this analysis. Of 541 bear damaged Douglas-firs, 33% had woodpecker foraging sign; 8% had foraging from pileated woodpecker, and 13% had red-breasted sapsucker sapwells. 91% of trees with pileated woodpecker sign and 56% of trees with red-breasted sapsucker sapwells were Douglas-fir. Abundance of trees with woodpecker sign was positively associated with SCI (Figure 11a) and bear damage (Figure 11b). Elevation was found to be the important nuisance variable for woodpecker sign models, using stepwise regression. With SCI as a predictor, the abundance of trees with woodpecker sign model with the strongest support (ΔAICc= 0, model weight=1.0) included elevation and SCI index (Appendix
34 A). Both estimates from the top model, elevation and SCI, had parameters whose 95% confidence interval did not overlap zero (elevation: β=-0.18; 95%CI: -0.33 – -0.02; SCI: β=0.21; 95%CI: 0.11 – 0.36; Appendix A). With bear damage as a predictor, the model with the strongest support (ΔAICc= 0, model weight=1.0) included elevation and volume lost due to bear damage (Appendix A). Among the estimates from the top model, the only parameter whose 95% confidence interval did not overlap zero was volume lost due to bear damage (elevation: β=-0.08; 95%CI: -0.22 – 0.06; volume lost due to bear damage: β=0.35; 95%CI: 0.23 – 0.47; Appendix A).
Figure 11. Model prediction of abundance of trees with woodpecker foraging sign and increasing a.) structural complexity index, and b) % timber volume loss due to bear damage, when accounting for harvest unit and elevation held constant at the median value (847.5 m). Shaded area represents the 95% confidence interval. Points represent the raw abundance of trees with woodpecker foraging sign values.
Abundance of trees specifically with pileated woodpecker sign was also positively associated with SCI (Figure 12a) and bear damage (Figure 12b). With SCI as a predictor, the abundance of trees with pileated woodpecker sign model with the strongest support (ΔAICc= 0, model weight=1.0) included elevation and SCI index
35 (Appendix A). Among the estimates from the top model, the only parameter whose 95% confidence interval did not overlap zero was SCI (elevation: β=-0.23; 95%CI: -0.46 – 0.01; SCI: β=0.33; 95%CI: 0.17 – 0.49; Appendix A). With bear damage as a predictor, the model with the strongest support (ΔAICc= 0, model weight=1.0) included elevation and volume lost due to bear damage (Appendix A). Among the estimates from the top model, the only parameter whose 95% confidence interval did not overlap zero was volume lost due to bear damage (elevation: β=-0.05; 95%CI: -0.26 – 0.15; volume lost due to bear damage: β=0.46; 95%CI: 0.28 – 0.64; Appendix A).
Figure 12. Model prediction of abundance of trees with pileated woodpecker foraging sign and increasing a.) structural complexity index, and b) % timber volume loss due to bear damage, when accounting for harvest unit and elevation held constant at the median value (847.5 m). Shaded area represents the 95% confidence interval. Points represent the raw abundance of trees with pileated woodpecker foraging sign values.
Abundance of trees specifically with red-breasted sapsucker sapwells was positively associated with bear damage (Figure 13 and Figure 14), but independent of SCI. With SCI as a predictor, the abundance of trees with red-breasted sapsucker sapwells model with the strongest support (ΔAICc= 0, model weight=0.71) only
36 included elevation (Appendix A). The estimate from the top model, elevation, had a parameter whose 95% confidence interval did not overlap zero (β=0.002; 95%CI: -0.25 – 0.26; Appendix A). With bear damage as a predictor, the model with the strongest support (ΔAICc= 0, model weight=0.98) included elevation and volume lost due to bear damage (Appendix A). Among the estimates from the top model, the only parameter whose 95% confidence interval did not overlap zero was volume lost due to bear damage (elevation: β=0.10; 95%CI: -0.15 – 0.35; volume lost due to bear damage: β=0.34; 95%CI: 0.13 – 0.55; Appendix A).
Figure 13. Model prediction of abundance of trees with red-breasted sapsucker sapwells and increasing % timber volume loss due to bear damage, when accounting for harvest unit and elevation held constant at the median value (847.5 m). Shaded area represents the 95% confidence interval. Points represent the raw abundance of trees with red-breasted sapsucker sapwells values.
37
Figure 14. Red-breasted sapsuckers select for bear damaged trees for sapwells in old clear cut harvest units on Hoopa Valley Indian Reservation, in Northwestern California.
Woodpecker Habitat Selection
Habitat selection by pileated woodpeckers, measured by comparing used and available sample units, was associated with more structurally complex sample units with higher percent volume lost due to bear damage. With SCI as a predictor, the pileated woodpecker sign RSF with the strongest support (ΔAICc= 0, model weight=0.57) included elevation and SCI (Appendix A). Both estimates from the top RSF, elevation and SCI, had parameters whose 95% confidence interval overlapped zero (elevation: β=0.16; 95%CI: -0.42 – 0.74; SCI: β=0.5; 95%CI: -0.11 – 1.1; Appendix A). With bear damage as a predictor, the RSF with the strongest support
38 (ΔAICc= 0, model weight=0.99) included elevation and volume lost due to bear damage (Appendix A). Among the estimates from the top model, the only parameter whose 95% confidence interval did not overlap zero was volume lost due to bear damage (elevation: β=0.63; 95%CI: -0.03 – 1.3; volume lost due to bear damage: β=2.04; 95%CI: 0.27 – 3.8; Appendix A). Habitat selection by sapsuckers, also measured by comparing used and available sample units, was associated with higher percent volume lost due to bear damage, but was not strongly associated with SCI. Red-breasted sapsuckers preferred sample units with bear damage and used structural complexity in proportion to its availability. Fiftysix (68%) sample units had evidence of sapwells. With SCI as a predictor, the redbreasted sapsucker sapwells RSF with the strongest support (ΔAICc= 0, model weight=0.75) only included elevation (Appendix A). The estimate from the top RSF, elevation, had a parameter whose 95% confidence interval overlapped zero (β=-0.11; 95%CI: -0.91 – 0.7; Appendix A). With bear damage as a predictor, the RSF with the strongest support (ΔAICc= 0, model weight=0.60) included elevation and volume lost due to bear damage (Appendix A). Both estimates from the top RSF, elevation and volume lost due to bear damage, had parameters whose 95% confidence interval overlapped zero (elevation: β=0.03; 95%CI: -0.8 – 0.85; volume lost due to bear damage: β=0.71; 95%CI: -0.15 – 1.58; Appendix A).
39 DISCUSSION
Results of this study demonstrate both negative economic and positive ecological effects of black bear damage to Douglas-fir trees on the Hoopa Valley Indian Reservation. Economic loss was immediate, with loss of revenue from timber in a sample unit strongly associated with the amount of bear damage, corresponding to a loss of timber revenue from $0 to $7,889 per ha (Figure 7). When timber volume was projected to a harvest age of 80 years and including lost future growth from killed and damaged trees, loss of timber revenue was again strongly associated with bear damage, corresponding to even more pronounced losses of $0-12,880 per ha, when compared against a modeled scenario where bear-damaged and bear-killed trees were treated as healthy and undamaged in the FVS modeling. However, bear damage also enhanced forest structure (Figure 8 and 9), and was positively associated with woodpeckers and other cavity nesting birds. For example, both an index of stand structural complexity and the amount of bear damage were positively associated with the abundance of cavity nesting birds (Figure 10), the abundance of trees with woodpecker sign (Figure 11), and the selection of trees by pileated woodpeckers and red-breasted sapsuckers. Woodpeckers are vital in this ecosystem for both their cultural and ecological value. To the Hupa people and other Pacific Northwestern Tribes, woodpeckers (especially pileated woodpeckers) are revered as culturally significant, as they are used in sacred regalia (Jordan 2012). Woodpeckers are also keystone facilitator species
40 (Aubrey and Raley 2002b) as well as indicators of mature and old forest habitat conditions in the Pacific Northwest (Mikusinski and Gromadzki 2001; Aubry and Raley 2002b; Bull et al. 2007), and several species in the Pacific Northwest are in decline (Sauer et al. 2011 (BBS)). As keystone species, some birds, mammals and invertebrates benefit from the cavities that woodpeckers create (Aubry and Raley 2002a; Aubrey and Raley 2002b); Pederson 1991; Drever and Martin 2010; Ouellet-Lapointe et al. 2012) and their effect on the community is disproportionate to their abundance (Bednarz et al. 2004). The pileated woodpecker is considered a species of conservation concern and availability of suitable habitat is reported to probably be a limiting factor for populations in northeastern Oregon (Bull and Holthausen 1993). Several studies found that pileated woodpeckers select for older forests with larger, more decayed trees, and high densities of dead wood (snags and logs; Bull and Holthausen 1993; Flemming et al. 1999; Savignac et al. 2000). Renken and Wiggers (1989) suggest forest log and stump volume, and percent overstory canopy cover may be structural cues used by pileated woodpeckers to ascertain food availability within a forest and they may adjust territory size in response to these structural cues. Furthermore, Hartwig et al. (2002 & 2006) found that pileated woodpeckers did not use intensively managed forests < 80 years old that had low densities of dead wood. Bears appear to be creating these characteristics in immature (40-60 yr) clear cut units on the HVIR, producing a food resource for pileated woodpeckers where it would otherwise be lacking. A greater understanding of the ecological factors affecting woodpecker distribution is essential for
41 future timber harvest plans on the HVIR to ensure forestry practices provide for future generations (Kroll et al 2012; Linden et al 2012). My results suggest that, on the HVIR, pileated woodpeckers and red-breasted sapsuckers selected for bear damage, and cavity nester abundance was higher with increased bear damage. My study is the first to reveal resource selection and response of pileated woodpeckers, red-breasted sapsuckers, and other woodpeckers to bear damage of Douglas-fir trees. Sapsuckers forage differently than other woodpeckers; they create sapwells in the bark of woody plants and feed on the emergent sap (Walters et al. 2002). The redbreasted sapsucker sapwells I detected on Douglas-fir trees were on the healing bark of live bear damaged trees. The bark of the healing trees grows fast and transfers a lot of sugars; frequently bears also forage on the healing wound. The sapsuckers' use of live trees may explain why they differed from other woodpeckers in my study and did not have strong associations to structural complexity; bear damage was a significant predictor of structural complexity, largely due to the canopy gaps created by bear-killed trees. 50% of affected trees survived their wounds, so they wouldn't have created the canopy gaps and major structural changes that the killed trees did. Thus, there appears to be a tradeoff on HVIR where bears are exacting an economic disservice through timber loss while also providing a cultural ecosystem service by improving habitat for sacred species (Figure 15). Bears are “ecosystem engineers” on HVIR, increasing structural diversity in the forest, creating canopy gaps and generating coarse woody debris (Ziegltrum and Nolte 2001) in old clear-cut units
42 that would otherwise be almost devoid of such structures. Clear-cuts are notorious for lacking structural complexity and availability of dead trees (Spies and Franklin 1991), and thus wildlife are less likely to select them for foraging or breeding (Mannan et al. 1980; Dickson et al. 1983; Hansen et al. 1991; Martin and Eadie 1999; Vaillancourt et al. 2008). Among other cavity-nesting species, the pileated woodpecker is selecting for these created structures, which means the HVT will benefit from bear damage in terms of increased cultural resource. The cultural value of bear damaged stands may ameliorate the economic losses.
Figure 15. Tradeoff between cultural ecosystem service (creation of structure for use by pileated woodpeckers) and economic disservice (loss of timber revenue). Model prediction of timber revenue and abundance of trees with pileated woodpecker foraging sign and increasing % timber volume loss due to bear damage, when accounting for harvest unit and elevation held constant at the median value (847.5 m). Green line and shaded area represents the model prediction and 95% confidence interval of timber revenue lost to bear damage and the red dashed line and shaded area represents the model prediction and 95% confidence interval of abundance of trees with pileated woodpecker foraging sign. Green circles represent the timber revenue loss values and red triangles represent the abundance of trees with pileated woodpecker foraging sign values.
43 Bear damage created opportunities for other wildlife to exploit as well. Deer browse was found on the fresh new growth in the canopy gaps created by bear damage (Figure 16). Deer are also very cultural significant to the Hupa people and they may be benefitting from bear damage, which would add weight to the cultural services bears are providing. Squirrels, chipmunks, and other rodents' foraging sign was found on the dropped cones from the dying Douglas-fir trees, as well as the Tanoak acorns (Figure 17). Conceivably, in these old clear-cuts, the increase in coarse woody debris caused by bear damage could alter the composition and increase the abundance of salamanders (Welsh and Lind 1991; Butts and McComb 2000) and create roosting structures for bats (Wunder and Carey 1994; Erickson and West 2003); the canopy gaps could provide foraging patches for bats as well (Crome and Richards 1988; Wunder and Carey 1994; Erickson and West 2003).
44
Figure 16. Bear-created canopy openings possibly increase deer use of clear-cut stands on the Hoopa Valley Indian Reservation, in northwestern California. a-c) bear-created gaps in the forest canopy; d) deer forage on western swordfern (Polystichum munitum) in a canopy gap; e) deer scat in a canopy gap.
45
Figure 17. Small mammal activity may be increased in areas with bear damage on the Hoopa Valley Indian Reservation, in northwestern California. a) Douglas' squirrel (Tamiasciurus douglasii) midden at the base of a bear damaged tree; b) Tanoak acorns eaten by unknown rodents; c) Douglas-fir cones eaten by Douglas' squirrels.
During this study, a manuscript was published that found a similar connection between brown bear (Ursus arctos) damage to silver fir trees (Abies alba) and
46 woodpecker foraging in Poland (Zyśk-Gorczyńska et al. 2015); they also found signs of woodpecker forage on 33% of bear damage wounds they inspected. My study differs from theirs because I measured resulting forest structural complexity, monetarily quantified timber loss, surveyed all cavity nesting species, and because of the cultural context of woodpeckers in this system, I examined a tradeoff between economic disservices and cultural and ecological services disservice caused by bear damage to trees. This study had a few caveats that future studies should address. First, although timber revenue lost to bear damage was predicted by the amount of bear damage found in a sample unit, net timber revenue was not strongly associated with bear damage. This was likely because other environmental factors overwhelm bear damage in governing how much timber a stand can produce, including site factors affecting forest growth such as elevation and stand density (i.e., how crowded the stand is) which affects the tradeoff between tree- and stand growth rates. Future researchers may wish to examine the mechanisms by which tree growth, bear foraging, and woodpecker distribution respond to elevation, especially given that ongoing climate change may strongly affect the ecology of mountain ecosystems (Elsen and Tingley 2015). Second, the results from point count surveys in this study were based on one survey, which impeded the capability to estimate detection probability, and are thus based on measures of relative abundance. I recorded the distance to each detected bird, but with my field methods the numbers of individuals per survey unit was insufficient to reliably calculate detection
47 probabilities with using distance sampling (e.g., Program DISTANCE (Buckland et al. 2001). Future work could use other field and analytical methods to rigorously assess detection probabilities and yield estimate of bird density rather than relative abundance. Third, my resource selection analyses were restricted due to the difficulty in distinguishing between the sign of several woodpecker species. I could only positively distinguish the forage sign of pileated woodpecker and red-breasted sapsucker, so all other foraging sign was generally categorized as woodpecker. Future research could use other methods (e.g., telemetry) to more thoroughly examine habitat selection of woodpeckers species and how they respond to structural variation on the HVIR. Fourth, FVS has limited capabilities as a simulation program; there is no built in bear damage defect model as with Douglas-fir beetle (Dendroctonus pseudotsugae), so the model does not account for the growth rate changes typical of surviving bear damaged trees. The program is a sort of "black box" that allows some adjustments such as percent defect, crown ratio, broken heights, diameter growth multipliers, or species modeled, but is limited in it capacity to model effects of bear damage. Future studies should develop a bear damage model for FVS, which takes into account the specific characteristics of bear damaged tree growth for more accurate simulations. Information from this study advances our understanding of the potential for bear foraging to negatively affect economic revenue and the trade-offs that help to create habitat conditions favoring other important wildlife species. To the best of our knowledge, this is the first study to evaluate ecosystem services for multiple species in
48 relation to economic disservices from another species. Understanding the costs and benefits of bear damage can help guide management decisions vital to forest managers both on and off tribal lands.
49 LITERATURE CITED
Abbott, 1994. Environmental Assessment for the Hoopa Valley Reservation. Aubry, K. B., and C. M. Raley. 2002a. Selection of nest and roost trees by pileated woodpeckers in coastal forests of Washington. The Journal of wildlife management 392–406. Aubry, K. B., and C. M. Raley. 2002b. The pileated woodpecker as a keystone habitat modifier in the Pacific Northwest. USDA Forest Service General Technical Report PSW-GTR181 257–274. Backhouse, F. and J. D. Lousier. 1991. Silviculture Systems Research: Wildlife Tree Problem Analysis. Ministry of Forests, Ministry of Environment and B.C. Wildlife Tree Committee. Baker, M. 2003. Against the Odds: (Re-) Building Community Through Forestry on the Hoopa Reservation. Technical Report. Pacific West Community Forestry Center. Barton, K., & M. K. Barton. 2015. Package ‘MuMIn’. Version, 1, 18. Bates, D., M. Maechler, B. Bolker, & S. Walker. 2014. lme4: Linear mixed-effects models using Eigen and S4. R package version, 1(7). Bednarz, J. C., Ripper, D., & Radley, P. M. 2004. Emerging concepts and research directions in the study of cavity-nesting birds: keystone ecological processes. The Condor 106: 14. Beyer, H.L. 2012. Geospatial Modelling Environment (Version 0.6.0.0). (software). URL: http://www.spatialecology.com/gme. Boyce, Mark S., and Lyman L. McDonald. 1999. Relating populations to habitats using resource selection functions. Trends in Ecology & Evolution 14: 268-272. Boyce, M. S., Vernier, P. R., Nielsen, S. E., & Schmiegelow, F. K. 2002. Evaluating resource selection functions. Ecological modelling 157: 281-300. Bull, E. L., and R. S. Holthausen. 1993. Habitat use and management of pileated woodpeckers in northeastern Oregon. The Journal of wildlife management 335–345.
50 Bull, E. L., and Jackson, J. A. 1995. Pileated woodpecker: Dryocopus pileatus. American Ornithologists' Union. Bull, E. L., N. Nielsen-Pincus, B. C. Wales, & J. L. Hayes. 2007. The influence of disturbance events on pileated woodpeckers in Northeastern Oregon. Forest ecology and management 243: 320-329. Burnham, K. P., & D. R. Anderson. 2002. Model selection and multi-model inference: a practical information-theoretic approach. Springer. Butts, S.R. and W.C. McComb. 2000. Associations of forest-floor vertebrates with coarse woody debris in managed forests of western Oregon. The Journal of wildlife management: 95-104. Child, M. F. 2009. The Thoreau ideal as a unifying thread in the conservation movement. Conservation Biology 23: 241-243. Crome, F.H.J. and Richards, G.C. 1988. Bats and gaps: microchiropteran community structure in a Queensland rain forest. Ecology:1960-1969. Dickson, J. G., R. N. Conner, & J. H. Williamson. 1983. Snag retention increases bird use of a clear-cut. The Journal of Wildlife Management, 799-804. Dixon, Gary E. 2002. Essential FVS: A user's guide to the Forest Vegetation Simulator. Internal Rep. Fort Collins, CO: U.S. Department of Agriculture, Forest Service, Forest Management Service Center. 226p. (Revised: November 2, 2015). Drever, M. C., K. E. H. Aitken, A. R. Norris, and K. Martin. 2008. Woodpeckers as reliable indicators of bird richness, forest health and harvest. Biological Conservation 141:624– 634. Drever, M. C., & K. Martin. 2010. Response of woodpeckers to changes in forest health and harvest: implications for conservation of avian biodiversity. Forest Ecology and Management 259: 958-966. Ehrlich, P., D. S. Dobkin, & D. Wheye. 1988. Birder's handbook. Simon and Schuster. Elsen, P.R. and Tingley, M.W., 2015. Global mountain topography and the fate of montane species under climate change. Nature Climate Change, 5(8), pp.772-776.
51 Erickson, J.L. and S.D. West. 2003. Associations of bats with local structure and landscape features of forested stands in western Oregon and Washington. Biological Conservation, 109:95-102. ESRI 2012. ArcGIS Desktop: Release 10.1. Redlands, CA: Environmental Systems Research Institute. Fan, Z., S. R. Shifley, M. A. Spetich, F. R. Thompson Iii, and D. R. Larsen. 2003. Distribution of cavity trees in midwestern old-growth and second-growth forests. Canadian Journal of Forest Research 33: 1481-1494. Fisher, B., R. K. Turner, and P. Morling. 2009. Defining and classifying ecosystem services for decision making. Ecological economics 68: 643-653. Flemming, S. P., G. L. Holloway, E. J. Watts, and P. S. Lawrance. 1999. Characteristics of foraging trees selected by pileated woodpeckers in New Brunswick. The Journal of wildlife management 461-469. Flowers, R. H. 1986. Supplemental feeding of black bear in tree damaged areas of western Washington. In Proceedings of animal damage management in Pacific Northwest forest symposium. Washington State University, Pullman, Washington, USA: pp. 147-148. Franklin, J. F., T.A. Spies, R. Van Pelt, A. Carey, D. Thornburgh, D.R. Berg, D.B. Lindenmayer, M. Harmon, W. Keeton, D.C. Shaw. 2002. Disturbances and structural development of natural forest ecosystems with silvicultural implications, using Douglas-fir forests as an example. Forest Ecology and Management 155: 399-423. Franklin, J. F., and R. Van Pelt. 2004. Spatial aspects of structural complexity in old-growth forests. Journal of Forestry 102: 22-28. Glover, F. 1955. Black bear damage to redwood reproduction. Journal of Wildlife Management 49:651-652. Golla, V. 1996. Hoopa Language Dictionary. Second Edition. Hoopa Valley Tribal Council, Hoopa, California, USA. Gómez-Baggethun, E., R. De Groot, P. L. Lomas, & C. Montes. 2010. The history of ecosystem services in economic theory and practice: from early notions to markets and payment schemes. Ecological Economics 69: 1209-1218. Hansen, A. J., T. A. Spies, F. J. Swanson, & J. L. Ohmann. 1991. Conserving biodiversity in managed forests. BioScience, 41:382-392.
52
Harris, R. D. 1983. Decay characteristics of pileated woodpecker nest trees. Pages 7–9 in: Davis, Jerry W.; Goodwin, Gregory A.; Ockenfels, Richard A., technical coordinators. Snag habitat management: proceedings of the symposium. Hartwig, C. L., D. S. Eastman, and A. S. Harestad. 2002. Forest Age and Relative Abundance of Pileated Woodpeckers on Southeastern Vancouver Island. USDA Forest Service Gen. Tech. Rep. PSW-GTR-181. Hartwig, C. L., D. S. Eastman, and A. S. Harestad. 2004. Characteristics of pileated woodpecker (Dryocopus pileatus) cavity trees and their patches on southeastern Vancouver Island, British Columbia, Canada. Forest Ecology and Management 187:225–234. Hartwig, C. L., D. S. Eastman, and A. S. Harestad. 2006. Characteristics of Foraging Sites and Structural Elements by th pileated woodpecker (Dryocopus pileatus) on southeastern Vancouver Island, British Columbia, Canada. Annales Zoologici Fennici 43: 186-197. Higley, J. M., D. V. Masters, and J. L. Sajecki. 2006. Bear Management Plan. Hoopa Tribal Forestry. Hoopa, Ca 95546 Higley, J. M. 2012. Hoopa Valley Tribe Forest Management Plan (2011-2026) Programmatic Biological Assessment. Hoopa Tribal Forestry. Hoopa Tribal Forestry. 2001. Bear Environmental Assessment for the Hoopa Valley Reservation. Hoopa Valley Tribe. 2013. Hoopa Valley Tribe website. http://www.hoopansn.gov/departments/natural-resources. Accessed 28 October 2013. Howe, R. W., A. T. Wolf, and T. Rinaldi. 1995. Monitoring Birds in a Regional Landscape: Lessons from the Nicolet National Forest Bird Survey. In: Ralph, C. John; Sauer, John R.; Droege, Sam, technical editors. Monitoring bird populations by point counts. Gen. Tech. Rep. PSW-GTR-149. Albany, CA: U.S. Department of Agriculture, Forest Service, Pacific Southwest Research Station: p. 83-92 Huff, M. H., K. A. Bettinger, H. L. Ferguson, M. J. Brown, and B. Altman. 2000. A habitatbased point-count protocol for terrestrial birds, emphasizing Washington and Oregon. US Department of Agriculture, Forest Service, Pacific Northwest Research Station. Johnson, R. R., B. T. Brown, L. T. Haight, J. M. Simpson. 1981. Playback recordings as a special avian censusing technique. Studies in Avian Biology 6:68-75.
53
Johnson, C. J., S. E. Nielsen, E. H. Merrill, T. L. McDonald, & M. S. Boyce. 2006. Resource selection functions based on use-availability data: theoretical motivation and evaluation methods. Journal of Wildlife Management 70: 347-357. Jordan, T. 2012. Reciprocity and Hupa Woodpeckers. California Cultures: A Monograph Series. Number 2. Kimball, B. A., D. L. Nolte, R. M. Engeman, J. J. Johnston, & F. R. Stermitz. 1998. Chemically mediated foraging preference of black bears (Ursus americanus). Journal of Mammalogy 79: 448-456. Kroll, A. J., M. J. Lacki, and E. B. Arnett. 2012. Research Needs to Support Management and Conservation of Cavity-Dependent Birds and Bats on Forested Landscapes in the Pacific Northwest. Western Journal of Applied Forestry 27:128-136. Küchler, A. W. 1977. The map of the natural vegetation of California. Lemaître, J., & M. A. Villard. 2005. Foraging patterns of pileated woodpeckers in a managed Acadian forest: a resource selection function. Canadian journal of forest research 35: 2387-2393. Linden, D. W., G. J. Roloff, & A. J. Kroll. 2012. Conserving avian richness through structure retention in managed forests of the Pacific Northwest, USA. Forest Ecology and Management 284: 174-184. Manley, B.F.J., L.L. McDonald, D.L. Thomas, T.L. McDonald, and W.P. Erickson. 2002. Resource selection by animals: statistical design and analysis for field studies. 2nd edition. Kluwer Academic Publishers, Boston, Massachusetts, USA. Mannan, R. W., E. C. Meslow and H. M. Wight. 1980. Use of Snags by Birds in Douglas-Fir Forests, Western Oregon. The Journal of Wildlife Management 44: 787-797. Marion, W. R., T. E. O’Meara, and D. S. Maehr. 1981. Use of playback recordings in sampling elusive or secretive birds. Studies in Avian Biology 6:81–85. Martin, K., and J. M. Eadie. 1999. Nest webs: a community-wide approach to the management and conservation of cavity-nesting forest birds. Forest Ecology and Management 115:243–257. Maser, C. 1967: Black bear damage to Douglas-fir in Oregon. The Murrelet, 48, 34-38.
54 Maser, C., R. G. Anderson, , K. Cromack Jr, J. T. Williams, & R. E. Martin. 1979. Dead and down woody material. Wildlife habitats in managed forests: the Blue Mountains of Oregon and Washington. Agric. Handb 553: 78-95. Maser, C., and J. M. Trappe. 1984. The seen and unseen world of the fallen tree. Mason, A .C., and D. L. Adams. 1989. Black bear damage to thinned timber stands in northwest Montana. West. J. Appl. For. 4: 10-13. Matthews, S. M. 2002. Population Attributes of Black Bear in Relation with Douglas-fir Damage on the Hoopa Valley Reservation, California. Thesis. Humboldt State University. Matthews, S. M., J. J. Beecham, H. Quigley, S. S. Greenleaf, H. M. Leithead. 2006. Activity patterns of black bears in Yosemite National Park. Ursus 17:30-40. Matthews, S. M., J. M. Higley, J. A. Hilty, and K. Wang. 2008a. Culturally-based Wildlife Conservation on Native American Lands: A Challenge of Scale and Governance. Part 4.1 in Protected Areas, Governance, and Scale. Edited by K. H. Redford and C. Grippo. Wildlife Conservation Society Working paper no. 36. Matthews, S. M., R. T. Golightly, and J. M. Higley. 2008b. Mark-resight density estimation for American black bears in Hoopa, California. Ursus 19:13–21. McCauley, D. J. 2006. Selling out on nature. Nature 443(7107), 27. McElhinny, C., P. Gibbons, and C. Brack. 2006. An objective and quantitative methodology for constructing an index of stand SCI. Forest Ecology and Management 235:54-71. McGarigal, K., and W. C. McComb. 1995. Relationships between landscape structure and breeding birds in the Oregon Coast Range. Ecological Monographs 65:235–260. McGaughey, R. J. 2009. FUSION/LDV: Software for LIDAR data analysis and visualization. US Department of Agriculture, Forest Service, Pacific Northwest Research Station: Seattle, WA, USA, 123(2). Mikusiński, G., Gromadzki, M., & Chylarecki, P. 2001. Woodpeckers as indicators of forest bird diversity. Conservation biology, 15: 208-217. Milcu, A. I., J. Hanspach, D. Abson, & J. Fischer. 2013. Cultural Ecosystem Services: A Literature Review and Prospects for Future Research. Ecology & Society 18(3).
55 Mosher, J. A., M. R. Fuller, and M. Kopeny. 1990. Surveying Woodland Raptors by Broadcast of Conspecific Vocalizations. Journal of Field Ornithology: 453-461. Nakagawa, S., and H. Schielzeth. 2013. A general and simple method for obtaining R2 from generalized linear mixed‐effects models. Methods in Ecology and Evolution 4: 133-142. Oester, P. and S. Bowers. 1999. Forest Measurement. Oregon State University. Woodland Workbook EC1127. Oksanen, J., R. Kindt, P. Legendre, B. O’Hara, B., M. H. H. Stevens, M. J. Oksanen, & M. A. S. S. Suggests. 2007. The vegan package. Community ecology package, 10. Ouellet-Lapointe, U., P. Drapeau, P. Cadieux, & L. Imbeau. 2012. Woodpecker excavations suitability for and occupancy by cavity users in the boreal mixedwood forest of eastern Canada. Ecoscience 19: 391-397. Partridge, S. T., D. L. Nolte, G. J. Ziegltrum, & C. T. Robbins. 2001. Impacts of supplemental feeding on the nutritional ecology of black bears. USDA National Wildlife Research Center-Staff Publications, 578. Pederson, R. J. 1991. Managing Small Woodland Plots for Cavity Nesting Birds. Woodland Fish and Wildlife Project. World Forestry Center, Portland, Oregon. 97221. Poelker, R.J. and Hartwell, H.D. 1973. Black bear of Washington. Wash. State Game Dept., Federal Aid Project W-71-R. R Development Core Team 2005. R: A language and environment for statistical computing. R Foundation for Statistical Computing, Vienna, Austria. ISBN 3-900051-07-0, URL http://www.R-project.org. Radwan, M. A. 1969. Chemical composition of the sapwood of four tree species in relation to feeding by the black bear. Forest Science 15: 11-16. Ralph, C. J., S. Droege, and J. R. Sauer. 1995a. Managing and Monitoring Birds Using Point Counts: Standards and Applications1, 3. Random Lengths. 2016. The weekly report on North American forest products markets. Price information from website: www.randomlengths.com. January 11. Renken, R. B., & E. P. Wiggers. 1989. Forest characteristics related to pileated woodpecker territory size in Missouri. Condor 642-652.
56 Rogers, L. L., and R. D. Applegate. 1983. Dispersal of fruit seeds by black bears. Journal of Mammalogy 64:310–311. Rosenvald, R., A. Lõhmus, A. Kraut, and L. Remm. 2011. Bird communities in hemiboreal old-growth forests: The roles of food supply, stand structure, and site type. Forest Ecology and Management 262:1541–1550. Satz, D., R. K. Gould, K. M. Chan, A. Guerry, B. Norton, T. Satterfield, B. S. Halpern, J. Levine, U. Woodside, N. Hannahs, X. Basurto, & S. Klain, S. 2013. The challenges of incorporating cultural ecosystem services into environmental assessment. Ambio 42: 675-684. Sauer, J. R., J. E. Hines, J. E. Fallon, K. L. Pardieck, D. J. Ziolkowski, Jr., and W. A. Link. 2011. The North American Breeding Bird Survey, Results and Analysis 1966 - 2010. Version 12.07.2011 USGS Patuxent Wildlife Research Center, Laurel, MD. Savignac, C., A. Desrochers, & J. Huot. 2000. Habitat use by pileated woodpeckers at two spatial scales in eastern Canada. Canadian Journal of Zoology 78: 219-225. Setterington, M. A., I. D. Thompson and W. A. Montevecchi. 2000. Woodpecker Abundance and Habitat Use in Mature Balsam Fir Forests in Newfoundland. The Journal of Wildlife Management 64: 335-345. Smith, D. M. 1962. The Practice of Silviculture. John Wileya dn Sons, Inc. , New York, New York, USA. Spies, T. A., and J. F. Franklin. 1991. The structure of natural young, mature, and old-growth Douglas-fir forests in Oregon and Washington. Wildlife and vegetation of unmanaged Douglas-fir forests. USDA Forest Service General Technical Report PNW-GTR-285, Portland, USA. Pacific Northwest Research Station: 91-111. Tews, J., U. Brose, V. Grimm, K. Tielborger, M. C. Wichmann, M. Schwager and F. Jeltsch. 2004. Animal species diversity driven by habitat heterogeneity/diversity: the importance of keystone structures. Journal of Biogeography 31, 79–92 Thomas, D. L., and E. J. Taylor. 1990. Study designs and tests for comparing resource use and availability. The Journal of wildlife management: 322-330. Thomas, D. L., & E. J. Taylor. 2006. Study designs and tests for comparing resource use and availability II. Journal of Wildlife Management 70: 324-336.
57 Vaillancourt, M.-A., P. Drapeau, S. Gauthier, and M. Robert. 2008. Availability of standing trees for large cavity-nesting birds in the eastern boreal forest of Québec, Canada. Forest Ecology and Management 255:2272–2285. Walters, E. L., E. H. Miller, and P. E. Lowther. 2002. Red-breasted sapsucker: Sphyrapicus ruber: Red-naped sapsucker: Sphyrapicus nuchalis. Birds of North America, Incorporated. Welsh, H. H., and A. J. Lind. 1991. The structure of the herpetofaunal assemblage in the Douglas-fir/hardwood forests of northwestern California and southwestern Oregon. LF Ruggiero, KB Aubry, AB Carey, and MH Huff (technical coordinators), Wildlife and vegetation of unmanaged douglas-fir forests. United States Department of Agriculture, Forest Service, General Technical Report PNW-285: 394-413. Wenger, K. F. 1984. Forestry handbook. Vol. 84, no. 1. John Wiley & Sons. Wensel, L. C., and B. E. Krumland. 1983. Volume and taper relationships for redwood, Douglas-fir, and other conifers in California's north coast. Wunder, L. and Carey, A.B., 1996. Use of the forest canopy by bats. Northwest Science, 70: 79–85. Zhang, W., T. H. Ricketts, C. Kremen, K. Carney, & S. M. Swinton. 2007. Ecosystem services and disservices to agriculture. Ecological economics 64: 253-260. Ziegltrum, G. J., and D. L. Nolte. 2001. Black bear forest damage in Washington State, USA: economic, ecological, social aspects. Ursus: 169-172. Zyśk-Gorczyńska, E., Z. Jakubiec, & A. Wuczyński. 2014. Brown bears (Ursus arctos) as ecological engineers: the prospective role of trees damaged by bears in forest ecosystems. Canadian Journal of Zoology, 93:133-141.
58 Appendix A. Parameter estimates (β), unconditional standard errors, lower and upper 95% confidence intervals, AICc values, degrees of freedom, log likelihood, AICc weight, and marginal and conditional R2 from final set of generalized linear mixed models. Model averaged estimates have an asterisk (*) next to the estimate. 95% confidence intervals were bolded if the values did not cross over zero. Hoopa Valley Indian Reservation, April-November 2014. AICc Marginal Conditional Response Predictor AICc df logLik ΔAICc Weight R2 R2 Variable Estimate 95% CI Bear Damaged Timber Data Timber Revenue Elev 1691 4 -841.20 14.07 0 0.05 0.40 Elev 2076 -64.32 – 4216.32 Current Elev + % vol Timber loss BD 1677 5 -833.10 0 1 0.06 0.40 Elev 1841 -393 – 4076 Revenue % vol loss BD -797 -2890 – 1296 Projected Timber Revenue (only live trees) Projected Timber Revenue ("stand up dead trees")
Elev Elev + % vol loss BD
Elev Elev + % vol loss BD
231.1
4
-111.267
0
0.9
0.04
0.53
Elev
0.21
-0.03 – 0.46
235.4
5
-112.285
4.3
0.1
0.04
0.52
Elev % vol loss BD
0.23
-0.02 – 0.47
0.08
-0.16 – 0.31
230.5
4
-110.97
0
0.84
0.05
0.53
Elev
0.22
-0.02 – 0.47
233.8
5
-111.49
3.3
0.16
0.07
0.51
Elev % vol loss BD
0.18
-0.07 – 0.43
-0.14
-0.37 – 0.09
Timber Revenue Lost Current Timber Revenue Lost to Bear Damage
Elev Elev + % vol loss BD
1438. 2 1251. 4
4
-714.8
187
0
0.02
0.64
Elev
-301
-771 – 170
5
-620.3
0
1
0.85
0.97
Elev % vol loss BD
82.66
-76.1 –241.4
1841
1703 –1978
59 Projected Timber Elev Revenue Elev + % vol Lost to Bear loss BD Damage (only live trees) Projected Timber Elev Revenue Elev + % vol Lost to Bear loss BD Damage ("stand up dead trees") Structural Complexity Data Elev Structural Elev + % vol Complexity loss BD Index
224.2
4
-107.84
263.7
0
0.01
0.54
Elev
-0.1
-0.34 – 0.13
-39.5
5
25.145
0
1
0.97
0.98
Elev
0.04
-0.0006 – 0.09
% vol loss BD
0.99
0.95 – 1.03
211.7
4
-101.569
226.83
0
0.013
0.87
Elev
-0.13
-0.35 – 0.09
-15.2
5
12.983
0
1
0.9
0.99
Elev
0.009
-0.04 – 0.06
% vol loss BD
0.96
0.91 – 1.0
591.6
4
-291.50
3.55
0.15
0.002
0.24
Elev
0.43
-1.69 – 2.6
588.0
5
-288.60
0
0.85
0.05
0.30
Elev % vol loss BD
1.1
-1.1 – 3.3
2.1
0.02 – 4.2
Wind Wind SCI Wind
-0.11 -0.11 0.13 -0.11
-0.25 – 0.03 -0.25 – 0.03 0.01 – 0.25 -0.25 – 0.02
Wind % vol loss BD
-0.12
-0.25 – 0.01
0.15
0.03 – 0.27
Wind Wind SCI
0.02 0.02 -0.01
-0.27 – 0.31 -0.27 – 0.31 -0.29 – 0.27
Point-Count Data
Cavity Nester Relative Abundance
Woodpecker Relative Abundance
Wind Wind + SCI
371.6 369.6
3 4
-182.63 -180.52
2.01 0
0.27 0.73
0.04 0.09
0.29 0.31
Wind Wind + % vol loss BD
371.6
3
-182.63
2.88
0.19
0.04
0.29
368.7
4
-182.60
0
0.81
0.10
0.29
Wind Wind + SCI
239.0 241.2
3 4
-116.35 -116.35
0 2.21
0.75 0.25
0 0
0.41 0.41
60 Wind Wind + % vol loss BD
Cavity Nester Species Diversity
# trees with pileated woodpecker sign
3
-116.35
0
0.53
0
0.41
239.3
4
-115.37
0.25
0.47
0.03
0.37
Wind Wind + SCI
43.7 51.1
4 5
-17.60 -20.15
0 7.38
0.98 0.02
0.07 0.07
0.69 0.69
Wind Wind + % vol loss BD
43.7
4
-17.59
0
0.96
0.07
0.69
50.1
5
-19.59
6.37
0.04
0.08
0.70
Woodpecker Sign Data Elev Elev + SCI # trees with woodpecker Sign
239.0
Elev Elev + % vol loss BD
594.6 580.3
3 4
-294.16 -285.88
14.34 0
0 1
0.07 0.13
0.37 0.44
594.6
3
-294.16
27.73
0
0.07
0.37
566.9
4
-279.19
0
1
0.27
0.41
Elev Elev + SCI
490.6 476.7
3 4
-242.15 -234.08
13.94 0
0 1
0.03 0.07
0.16 0.25
Elev Elev + % vol loss BD
490.6
3
-242.15
20.79
0
0.03
0.16
469.8
4
-230.65
0
1
0.20
0.24
Wind % vol loss BD
0.02*
-0.27 – 0.31
0.21*
-0.08 – 0.5
Wind Wind SCI Wind
-0.09 -0.09 0.01 -0.09
-0.15 – -0.03 -0.15 – -0.03 -0.05 – 0.07 -0.15 – -0.03
Wind % vol loss BD
-0.1
-0.15 – -0.04
0.03
-0.04 – 0.1
Elev Elev SCI Elev
-0.15 -0.18 0.21 -0.15
-0.31 – 0.004 -0.33 – -0.02 0.11 – 0.36 -0.31 – 0.004
Elev % vol loss BD
-0.08
-0.22 – 0.06
0.35
0.23 – 0.47
Elev Elev SCI Elev
-0.19 -0.23 0.33 -0.19
-0.41 – 0.03 -0.46 – 0.01 0.17 – 0.49 -0.41 – 0.03
Elev % vol loss BD
-0.05
-0.26 – 0.15
0.46
0.28 – 0.64
61
# trees with red-breasted sapsucker sign
Use/ Availability of pileated woodpecker sign
Use/ Availability of redbreasted sapsucker sign
Elev Elev + SCI
346.6 348.3
3 4
-170.13 -169.91
0 1.76
0.71 0.29
0 0.01
0.20 0.17
Elev SCI
-0.0002* 0.07*
-0.26 –0.25 -0.13 – 0.27
Elev Elev + % vol loss BD
346.6
3
-170.13
6.98
0.03
0
0.20
Elev
0.00
-0.25 – 0.26
336.6
4
-165.50
0
0.97
0.10
0.18
Elev % vol loss BD
0.10
-0.15 – 0.35
0.34
0.13 – 0.55
Elev Elev + SCI
83.9 74.0
3 4
-38.82 -32.76
9.91 0
0.01 0.99
0 0.08
0.00 0.08
Elev SCI
0.17* 0.5*
-0.40 – 0.74 -0.11 – 1.1
Elev Elev + % vol loss BD
83.9
3
-38.82
9.83
0.01
0
0
Elev
0.18
-0.38 – 0.73
74.1
4
-32.80
0
0.99
0.52
0.52
Elev % vol loss BD
0.63
-0.03 – 1.3
2.04
0.27 – 3.8
Elev Elev SCI
-0.11 -0.11 0.07
-0.91 –0.7 -0.9 – 0.69 -0.65 – 0.78
Elev % vol loss BD
0.03*
-0.8 – 0.85
0.71*
-0.15 – 1.58
Elev Elev + SCI
99.5 101.6
3 4
-46.58 -46.56
0 2.18
0.75 0.25
0 0
0.48 0.47
Elev Elev + % vol loss BD
99.5
3
-46.58
0.79
0.40
0
0.48
98.7
4
-45.10
0
0.60
0.08
0.45
62 Appendix B. Ehrlich et al. (1988) categorization of bird species detected during breeding season point count surveys (April 2- June 30, 2014) on Hoopa Valley Indian Reservation, Humboldt County, California. Number of Common Name Scientific Name Nest Diet Forage Individuals 1 Steller's jay Cyanocitta stelleri 171 CUP OM GG 2 Chestnut-backed Chickadee Poecile rufescens 111 CAV IN FG 3 Hermit warbler Dendroica occidentalis 109 CUP IN FG 4 Dark-eyed "Oregon" junco Junco hyemalis 97 CUP SE GG Unknown(Hermit warbler or 5 93 CUP IN FG Black-throated gray-warbler) 6 Black-headed grosbeak Pheucticus melanocephalus 84 CUP IN FG 7 Golden-crowned kinglet Regulus satrapa 83 PEN IN FG 8 Hermit thrush Catharus guttatus 76 CUP IN GG 9 Wilson's warbler Wilsonia pusilla 71 CUP IN FG 10 Hutton's vireo Vireo huttoni 67 CUP IN FG 11 Pacific wren Troglodytes pacificus 58 CAV IN GG 12 Pacific-slope flycatcher Empidonax difficilis 43 CAV IN H 13 Western tanager Piranga ludoviciana 42 CUP IN FG 14 Wrentit Chamaea fasciata 35 CUP IN FG 15 Acorn woodpecker Melanerpes formicivorus 27 CAV OM BG 16 Northern flicker Colaptes auratus 26 CAV IN GG 17 Red-breasted nuthatch Sitta canadensis 18 CAV IN BG 18 Pileated woodpecker Dryocopus pileatus 17 CAV IN BG 19 Hairy woodpecker Picoides villosus 15 CAV IN BG 20 Nashville warbler Oreothlypis ruficapilla 12 CUP IN FG 22 Orange-crowned warbler Oreothlypis celata 11 CUP IN FG 23 Warbling vireo Vireo gilvus 11 CUP IN FG 21 Mountain quail Oreortyx pictus 11 SCR SE GG 24 Cassin's vireo Vireo cassinii 10 CUP IN FG 25 Purple finch Carpodacus purpureus 10 CUP SE GG 26 Swainson's thrush Catharus ustulatus 10 CUP IN FG 28 Unknown woodpecker 8 CAV IN BG 27 Olive-sided flycatcher Contopus cooperi 8 CUP IN H 29 Brown creeper Certhia americana 7 UNBA IN BG 30 Black-throated gray-warbler Dendroica nigrescens 6 CUP IN FG 31 Common raven Corvus corax 6 CUP OM GG 32 Spotted towhee Pipilo maculatus 6 CUP IN GG 35 Red-breasted sapsucker Sphyrapicus ruber 5 CAV IN BG 33 American robin Turdus migratorius 5 CUP IN GG 34 Fox sparrow Passerella iliaca 5 CUP IN GG 37 Northern pygmy-owl Glaucidium gnoma 4 CAV SM S 36 Band-tailed pigeon Patagioenas fasciata 4 PLAT NU FG 39 Unknown hummingbird Selasphorus sp. 3 CUP N H.G 40 Western wood-peewee Contopus sordidulus 3 CUP IN H 38 Sooty Grouse Dendragapus fuliginosus 3 SCR GR GG 41 Downy woodpecker Picoides pubescens 2 CAV IN BG 42 Townsend's warbler Dendroica townsendi 2 CUP IN FG Unknown (Western tanager 43 2 CUP IN FG or Black-headed grosbeak)
63 48 45 50 49 47 44
Tree swallow MacGillivray's warbler Varied thrush Turkey vulture Sharp-shinned hawk California quail
Tachycineta bicolor Oporornis tolmiei Ixoreus naevius Cathartes aura Accipiter striatus Callipepla californica
1 1 1 1 1 1
CAV CUP CUP NONE PLAT SCR
IN IN IN CA BI SE
AF FG GG HP AP GG