Examining the Pseudo-Standard Web Search Engine Results Page Andrew Turpin Dept. of Computer Science & IT RMIT University Melbourne, Australia
[email protected] Bodo Billerbeck Sensis Pty Ltd Melbourne, Australia
[email protected]
Abstract Nearly every web search engine presents its results in an identical format: a ranked list of web page summaries. Each summary comprises a title; some sentence fragments usually containing words used in the query; and URL information about the page. In this study we present data from our pilot experiments with eye tracking equipment to examine how users interact with this standard list of results as presented by the Australian sensis.com.au web search service. In particular, we observe: different behaviours for navigational and informational queries; that users generally scan the list top to bottom; and that eyes rarely wander from the left of the page. We also attempt to correlate the number of bold words (query words) in a summary with the amount of time spent reading the summary. Unfortunately there is no substantial correlation, and so studies relying heavily on this assumption in the literature should be treated with caution. Keywords web search engine, eye tracking, web page summaries
1
Introduction
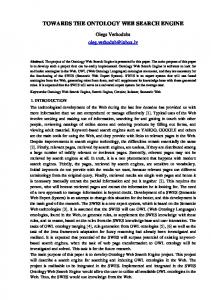
All major Internet search engines such as Google, Yahoo!, MSN Search, and Sensis present answers to queries in a similar format, as typified by the screenshot in Figure 1. The top section of the answer screen contains some searching options and the query in an editable box, with the majority of the screen filled with a list of summaries of web pages. Each of these summaries is composed of four parts: 1. the page title, which is extracted from the HTML of the page; 2. a query-biased extract of the page, which is typically two to three sentence fragments that contain the query words (highlighted in bold); Proceedings of the 11th Australasian Document Computing Symposium, Brisbane, Australia, December 11, 2006. Copyright for this article remains with the authors.
Falk Scholer Dept. of Computer Science & IT RMIT University Melbourne, Australia
[email protected] Larry A. Abel Dept. Optometry and Vision Science University of Melbourne Melbourne, Australia
[email protected]
3. the URL of the page; and 4. some information about the page, for example a link to its cached version, or more pages from the same domain The bottom of the screen typically contains links to more pages of summaries, and links relevant to the search engine; and the right of the screen typically contains advertisements. Given that the format of the results page is so ubiquitous, it has received little attention in the scientific literature. In particular, investigations of what people actually look at on the screen in relation to their searching behaviour remains unpublished, apart from some work that we summarise in the next section. Presumably search engine companies have invested a large amount of resources into studying the effectiveness of their results pages, but the results of these studies are not in the public domain. While the main aim of many eye tracking studies related to web search is to improve methods for offline evaluation of search engines, in this paper we focus on the behaviour of the users as they read the results page. In particular, we report that users with some web searching experience look at URLs in the results page when performing a navigational type task, and generally do not read the page snippets. When performing an informational type search, the snippets are heavily read. We also attempt to correlate the number of bold/query words in a summary with the amount of time spent reading a summary, as has been suggested in the literature [1], but find no substantial correlation.
2
Related Work
The study of eye movements as a reflection of cognitive processes have been investigated in the field of psychology for over 50 years, with many studies supporting the view that shifts in viewer attention are reflected by changes in the point of visual fixation [5]. The advent of non-intrusive eye tracking technology has enabled researchers to explore the usefulness of using eye move-
Figure 1: A screenshot of a results page of the style that is typical of most major web search engines.
ments as evidence for changes in attention in a variety of information system domains, such as the design of user interfaces, and to analyse the viewing patterns of web users [3, 7, 9]. The use of eye tracking to analyse the behaviour of online searchers was investigated by Granka [2], who conducted a series of experiments with 29 subjects. Participants carried out a series of search tasks, including informational searches (where the user is seeking to learn about a topic, for which there may be several relevant answer resources) and navigational searches (where the user is looking for a single named resource). Her results demonstrated that user search behaviour is influenced by various factors, including task type (more document summaries in a result list are viewed for informational searches than for navigational searches) and task difficulty (more summaries below a selected resource in a result list are viewed for harder search tasks, than for easier search tasks). Subject variables, such as gender, were also found to have an effect. Eye tracking analysis has also been used to demonstrate that users tend to read items in a search results list sequentially, spending significantly more time viewing the first items, and that even when users skip some items and click on an answer further down in the results list, they will generally have spent some time reading the abstracts of items that were ranked more highly [4].
In the information retrieval domain, the key challenge is to present users with resources that are relevant to an information need. As such, an interesting question to consider is whether features derived from eye tracking systems can be used to infer the relevance of items in an answer list. Saloj¨arvi et al. [10] collected data from users viewing titles of documents with known relevance. Their results show that a discriminative Hidden Markov Model can be trained to infer relevance more effectively when using features derived from eye tracking, compared to a system that does not incorporate eye tracking data. In subsequent work, Puolam¨aki et al. [8] explore different statistical models to combine implicit feedback from eye movements with collaborative filtering. Their results show that more complex mixtures models are more effective than simple linear models at making relevance predictions for users of web search engine results. While these findings are promising, it is still unclear to what extent these benefits would translate into gains for users of a live search system. Click-through data — recording those items in a list of search results that a user actually clicks on and views — has been of interest as an indicator of relevance. Trends from the eye movements of subjects as they read a search results page have been applied to the problem of validating the use of click-through data as implicit relevance judgements. Based on the positions of viewed resources in a search results list, Joachims et al. [6] investigated sources of bias in using click-through data
Informational 1 Name the first female member of the Australian Federal Parliament 2 Name a football team/club that plays in the Northern Territory Football League. 3 What is the daily circulation of the Brisbane Courier Mail newspaper? 4 Name two Australian uranium mines. 5 With what percentage was the referendum on an Australian republic defeated in 1999? Navigational 6 Find the home page of CSIRO 7 Find the home page of Lion Nathan Limited 8 Find the home page of University of New England 9 Find the home page of Coles supermarkets 10 Find the home page of Federation Square in Melbourne
as an indicator of relevance. Their analysis indicated that click-through items are subject to trust bias (users tend to trust a search engine, and so are more likely to click on the first item in an answer list, even when it is not relevant), and quality bias (when the overall quality of the answer list decreases, users will view less relevant answers). They therefore conclude that clickthrough information should be used as relative, rather than absolute, evidence for relevance. In recent work on user interaction models, Agichtein et al. [1] incorporate information about which sections of summaries users choose to examine: the title, snippet, or URL. However, instead of using explicit eye-tracking data, Agichtein et al. model this user behaviour by considering the extent of overlap between words that occur in the query and summary (the bold words). We investigate how closely these content-based features approximate actual user behaviours.
3
Table 1: Topics used in this study.
Methods
Nine users (seven male, two female) were asked to find the answer to the ten topics in the order shown in Table 1 using the sensis.com.au search engine. URLs selected by the users (click-through data) were recorded using a proxy between the user and the Sensis search engine. Before each topic, the user was asked to rate their prior knowledge on the six point scale shown in Table 2. All users were experienced with search engine technology — predominately postgraduate students — making use of search engines at least once a day prior to the experiment. The hardware used was a standard PC running Microsoft Windows XP and Internet Explorer, but the monitor was equipped with the Tobii 1750 eye tracker (Tobii Technology, www.tobii.com), which makes use of infra-red reflections from the eye to monitor eye movements. The Tobii software, Clearview 2.0, was used to collect the eye-tracking data which consisted of the x-y co-ordinates of any fixations of gaze; the duration of any gaze in milliseconds; and timestamps for all events, button clicks, and URLs selected. The software also saves viewed pages as images. In order to determine at which part of a web page a fixation took place (title, snippet, or URL), the x-y location data in the Clearview log file must be located on the corresponding web page image. This is nontrivial as the x-y location of a fixation is the average eye position over a short period of time (about 250 ms), and so may not actually appear “on top of” a feature in the image file. Hence we wrote a simple image processing program to perform a radial search, spiraling out from the given x-y location until a non-white pixel is encountered. The same program also segmented the web page image into summaries so that a rank equal to the rank of the summary on the page could be assigned to each gaze fixation. Not only did this software have the effect of assigning a feature and rank to each gaze fixation, it also
1 2 3 4 5 6
I do not understand the question Part or all of the question makes little sense to me The question makes sense, but I could not begin to guess an answer I could make a poor guess at an answer I could make a good guess at an answer I know the answer
Table 2: Scale used to asses user’s confidence in a topic prior to searching. corrected some systematic errors in the gaze tracking due to poor calibration, and some peculiarities related to the web page images. In particular, a line of fixations left-to-right often appeared above a line of text in the image file, but clearly the user was reading that line. Once alignment had occurred, our first analysis task was to attempt to replicate results from the Joachims et al. study [6]. In their study, the number of fixations at each rank, the number of fixations at given ranks relative to the rank of clicks, and the order of fixations on a page were all reported. Our second task was to then examine the correlations between task type (navigational or informational) and the parts of summaries examined. We also investigated the relationship between eye movements over parts of summaries and previously proposed features intended to approximate this behaviour, namely the overlap between query terms and terms in titles, URLs and summary parts of answer items in a search results list.
4
Results
Figure 2 shows the proportion of pages where a summary was viewed at a particular rank, and the proportion of pages where a summary was selected at a par-
80 20
40
60
Viewed Clicked
0
% of results pages seen
100
% of pages where rank was viewed/clicked
1
2
3
4
5
6
7
8
9
10
Rank
Figure 2: Proportion of pages where the summary at the rank indicated on the x-axis was either viewed or clicked.
ticular rank. In this, and all subsequent results on fixations, we only include the fixations on a page up to the first click that leads to another page. We do not include fixations on the page that may be the result of a second visit to the results page, for example via the Back button on the browser. Consistent with previous work [6], there is a strong bias towards reading the highly ranked items, with items ranked further down the list scarcely receiving attention. Figure 3, which shows histograms of the X and Y co-ordinates of fixations further confirms that users spend most of their time looking at the top of the results page. The top histogram (for the X co-ordinates) shows a heavy bias towards fixations on the left of the page, with over 60% of fixations occuring in the left 20% of the screen for all topics. Similarly, the right histogram (for the Y co-ordinates) shows a heavy bias towards the top of the pages, with 54% of fixations in the top 20% of the screen for all topics. Returning to Figure 2, we see a slow decline in the proportion of pages where high ranks are viewed (dark bars), but a much sharper decline in the selection of high ranks (light bars). This indicates that users read further down the list before they make their first selection. Indeed, Figure 4 confirms this observation. In this figure we show a boxplot of the rank of summaries that are viewed (have at least one fixation) as an offset from the rank of the first summary selected. Boxes indicate the quartiles of the number of summaries, whiskers and dots show extreme values, and the solid black line in-
dicates the median. For example, for all the summaries selected when in position 1 (leftmost box in the figure), 50% of the time at least summaries in position 1, 2 and 3 were read before the click. This is indicated because the box extends down to -2 on the y-axis. For summaries selected at rank 4, 50% of the time summaries at ranks 2 and 3 received the user’s gaze. It seems apparent then, that users prefer the top-left corner of the screen when it comes to reading, and that users will read one or two summaries past the summary they eventually click upon. It would seem intuitive that the summaries are read in order from top to bottom, and this is supported by data in Figure 5, which shows the median number of fixations that occur before a fixation on the indicated rank. At the top of the results list, ranks one through seven, the list is being read in order because the number of fixations prior to arriving at a rank is increasing. The results presented so far have all been at the summary level, reporting how users gaze at summaries as a whole. Figure 6 breaks summaries into three components: title, snippet and URL, and reports the number of seconds spent fixating on each component summed over all users. For topics 1-5 (informational) the total time spent is appreciably more than for topics 610 (navigational). Moreover, the relative time spent reading titles and snippets is significantly higher for the informational topics. Generally, the time to read URLs was higher than for the navigational topics.
0.30 0.25 0.20 0.15 0.10 0.00
0.05
Proportion of fixations
Inf. Nav.
0.00
0.05
0.10
0.15
0.20
0.25
Proportion of fixations
Figure 3: Histograms of the X (top) and Y (right) co-ordinates of fixations over all users. Bar heights are normalised by the total number of fixations.
5 0 −5
Clicked rank less viewed rank
1
2
3
4
5
6
7
8
9
10
Rank
50
100
Title Snippet URL
0
Total time fixating (secs)
150
Figure 4: Rank of summaries viewed as an offset from, and grouped by, the rank at which the click took place as indicated on the x-axis.
1
2
3
4
5
6
7
8
9
10
Topic
Figure 6: Number of fixations spent on each element of summaries summed across all nine users. Topics 1-5 are navigational; topics 6-10 informational.
60 40 20 0
Median number of fixations
80
Arrival time of fixation
1
2
3
4
5
6
7
8
9
10
Rank
Figure 5: Median number of fixations before fixating on the summary at the rank indicated on the x-axis. Part of page Whole summary Titles only Snippets only URLs only
r 0.18 0.13 0.17 0.11
p < 0.001 0.015 < 0.001 0.041
Table 3: Spearman’s correlation coefficient between the time spent fixating on summary components, and the number of bold words in the component. To investigate whether a count of the overlap between terms in a query and terms in the title, snippet and URL of summaries is a suitable approximation for actual user behaviour when viewing a results page, we calculate the Spearman rank correlation between these three features and the actual time (in ms) that users fixate on these components of answer items. Table 3 shows that there are statistically significant correlations between the features and the time spent viewing those summaries, but the correlation coefficient, r, is small.
5
Conclusions and Future Work
Major web search engines present their results in a consistent way, displaying a ranked list of answer items, where each item consists of a title, a query-biased summary, and the URL of the underlying answer resource. Understanding how users view such result pages can give valuable insight into how the presentation of search results could be optimised (for example, for ease of use, or for advertising). We have analysed the eye-movements of nine users as they engaged in a series of informational and navigational web search tasks. Our results confirm the findings that Joachims et al. [6] reported when using Google on the whole of the web, but we make use of Sensis on the Australian Web. Users view search results in order, typically reading from the top
to the bottom of an answer list. Attention is mostly confined to the left-hand side of the screen, for both types of search tasks. However, the type of search task does have an effect on which components of individual answer items users focus their attention on: for informational queries, users spend relatively more time reading the query-biased summary sentences of answer items; for navigational searches, snippets are less important, with relatively more attention being given to the URL. We also investigated the effectiveness of using simple content-based features — such as the overlap between terms in a query and in the title of an answer item — to approximate the actual duration of fixations on these answer components. In some recently reported work [1] it was assumed that there is a strong correlation between the number of query terms that appear in a summary and the amount of time a user spends reading that summary. This correlation has not been reported in any study to date. Our results indicate that there is a very weak correlation, but it would be unwise to base further studies on this assumption without further validation. In future work, we intend to investigate techniques for combining evidence from eye-tracking data with click-through data, to examine the effectiveness of implicit indicators of relevance. Acknowledgments This work has been supported by Sensis Pty Ltd and the Australian Research Council (Turpin).
References [1] Eugene Agichtein, Eric Brill, Susan Dumais and Robert Ragno. Learning user interaction models for predicting web search result preferences. In SIGIR ’06: Proceedings of the 29th annual international ACM SIGIR conference on Research and development in information retrieval, pages 3–10, Seattle, WA, 2006. [2] Laura Granka. Eye-tracking analysis of user behaviour in online search. Master’s thesis, Cornell University, 2004. [3] Laura Granka, Helene Hembrooke and Geri Gay. Location location location: viewing patterns on www pages. In ETRA ’06: Proceedings of the 2006 symposium on Eye tracking research & applications, pages 43–43, San Diego, CA, 2006. [4] Laura Granka, Thorsten Joachims and Geri Gay. Eye-tracking analysis of user behavior in www search. In SIGIR ’04: Proceedings of the 27th annual international ACM SIGIR conference on Research and development in information retrieval, pages 478–479, Sheffield, United Kingdom, 2004.
[5] Mary Hayhoe and Dana Ballard. Eye movements in natural behaviour. Trends in Cognitive Sciences, Volume 9, Number 4, 2005. [6] Thorsten Joachims, Laura Granka, Bing Pan, Helene Hembrooke and Geri Gay. Accurately interpreting clickthrough data as implicit feedback. In SIGIR ’05: Proceedings of the 28th annual international ACM SIGIR conference on Research and development in information retrieval, pages 154–161, Salvador, Brazil, 2005. [7] Bing Pan, Helene Hembrooke, Geri Gay, Laura Granka, Matthew Feusner and Jill Newman. The determinants of web page viewing behavior: an eye-tracking study. In ETRA ’04: Proceedings of the 2004 symposium on Eye tracking research & applications, pages 147–154, San Antonio, TX, 2004. [8] Kai Puolam¨aki, Jarkko Saloj¨arvi, Eerika Savia, Jaana Simola and Samuel Kaski. Combining eye movements and collaborative filtering for proactive information retrieval. In SIGIR ’05: Proceedings of the 28th annual international ACM SIGIR conference on Research and development in information retrieval, pages 146–153, Salvador, Brazil, 2005. [9] R. S. Rele and A. T. Duchowski. Using eye tracking to evaluate alternative search results interfaces. In Proceedings of the Human Factors and Ergonomics Society, Orlando, FL, 2005. [10] Jarkko Saloj¨arvi, Kai Puolam¨aki and Samuel Kaski. Implicit relevance feedback from eye movements. In Duch, Kacprzyk, Oja and Zadrozny (editors), Artificial Neural Networks: Biological Inspirations - ICANN 2005, pages 513–518, Warsaw, Poland, 2005.


![Children's use of the Yahooligans[excl] Web search engine - CiteSeerX](https://m.moam.info/img/260x300/childrens-use-of-the-yahooligansexcl-web-search-en_5995720c1723ddce69c60242.jpg)