Cardiovascular disease (CVD) accounts for 37.1 percent of all deaths in the. United States. ... and equipment. I am especially grateful for the council and friendship of my .... inflammation that stimulates the acute phase response ... and its risk factors5-9 and improves health.2 Physical activity is inversely related to both CV ...
EXAMINING THE RELATIONSHIP OF PHYSICAL ACTIVITY WITH INFLAMMATION AND CARDIOVASCULAR DISEASE RISK By Coral Michelle Gubler Bachelor of Science, Stony Brook University, Stony Brook, New York, 1989 Masters of Science, United States Sports Academy, Daphne, Alabama, 1990 Masters of Science, University of Delaware, Newark, Delaware, 1993 Dissertation presented in partial fulfillment of the requirements for the degree of Doctor of Philosophy in Interdisciplinary Studies The University of Montana Missoula, MT Fall 2007 Approved by: David Strobel, Dean Graduate School Steven Fehrer, Chair Physical Therapy and Rehabilitation Science Steven Gaskill Health and Human Performance James Laskin Physical Therapy and Rehabilitation Science Lawrence Dent Pharmacy Practice Daniel Dennis Psychology John Lundt Educational Leadership
UMI Number: 3288864
Copyright 2007 by Gubler, Coral Michelle All rights reserved.
UMI Microform 3288864 Copyright 2008 by ProQuest Information and Learning Company. All rights reserved. This microform edition is protected against unauthorized copying under Title 17, United States Code.
ProQuest Information and Learning Company 300 North Zeeb Road P.O. Box 1346 Ann Arbor, MI 48106-1346
© COPYRIGHT by Coral Michelle Gubler 2007 All Rights Reserved
Gubler, Coral, PhD, Fall 2007
Interdisciplinary Studies
Examining the Relationship of Physical Activity with Inflammation and Cardiovascular Disease Risk Steven Fehrer, Chair Cardiovascular disease (CVD) accounts for 37.1 percent of all deaths in the United States. Physical activity is inversely related to both CV event risk and to many of the individual CVD risk factors. The inverse relationship between physical activity and CVD risk is well established. However, much dispute remains about the optimal physical activity intensity and duration related to health benefits and to lower CVD risk. The ability to objectively measure intensity and duration may clarify the inverse relationship between physical activity and CVD. The purpose of this collection of studies was to explore the association of physical activity with CVD and attempt to identify some specifics of this complex relationship. Results: In healthy sedentary individuals aged 31 to 66, 2 different activity accumulation programs were effective in increasing physical activity and resulted in improved fitness and blood glucose. However, the improvement in activity was not of sufficient intensity to provide changes in multiple heart disease risk factors or inflammation. In a cross-section sample of males and females aged 18 to 65, both active and sedentary, the relationship between physical activity and CVD risk varied by age group. The inverse relationship between physical activity and CVD risk was confirmed. However, reaching higher intensity levels for 1 minute periods at least 5 minutes a day appears to be better related to lower risk of CVD than longer durations of moderate or vigorous activity per day, particularly in younger individuals. In a sample of stroke survivors aged 50 to 72, 3 out of 6 of the modifiable risk factors for CVD were present. In these stroke survivors, physical activity intensity and duration were well below current recommendations and insufficient for CVD risk reduction. Conclusions: Accumulating activity can be effective in meeting physical activity recommendations however both duration and intensity requirements must be achieved. Combinations of higher intensities for shorter durations may also be effective in CVD risk reduction.
iii
ACKNOWLEDGEMENTS
Given this opportunity, there are a number of people I would like to acknowledge. First, thank you to all of my committee members for their support and guidance. In particular, thanks to Drs Steven Gaskill and James Laskin, for their collaboration on many projects as well as the use of their laboratory space and equipment. I am especially grateful for the council and friendship of my advisor Dr Steven Fehrer through this series of projects and the multiple manuscript revisions. I would like to acknowledge Human Kinetics, Community Hospital, the Health and Human Performance Department and New Directions Wellness Center for collaboration on the various research projects. Thank you to all of the people who volunteered to be subjects for all of the research projects. To the physical therapy faculty and staff, thank you for your respect and support as I walked the line between professional and student. I am grateful to all of my friends and family for the encouragement they provided. Most of all, I appreciate the love and encouragement of my mother without whom this journey would not have been possible. Mom, I got with the program!
iv
CONTENTS Figures and Tables
vi
Glossary
vii
Introduction Chapter 1.
1 Review of Literature
4
Cardiovascular Disease
4
Inflammation
10
Inflammation and Cardiovascular Disease
13
Physical Activity
24
Fitness and Cardiovascular Disease
40
Physical Activity and Cardiovascular Disease Risk
43
C-Reactive Protein and Cardiovascular Disease
46
Summary
49
Chapter 2.
Research Questions
53
Chapter 3.
Increasing Physical Activity and Reducing Cardiovascular Risk Using Methods of Accumulating Physical Activity
Chapter 4.
Exploring the Relationship Between Cardiovascular Disease Risk and Physical Activity as Measured by Accelerometers
Chapter 5.
Chapter 6.
54
75
Examining Habitual Physical Activity and Cardiovascular Disease Risk Factors in Stroke Survivors
101
Conclusions
125
References
127 v
FIGURES AND TABLES
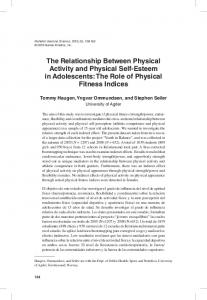
Figures Figure 1: Visual determination of Ventilatory Threshold
38
Figure 2: Changes in the average number of steps per day by group
65
Tables Table 1: Topics Covered in the Active Living, Everyday® Program
62
Table 2: Baseline Descriptive Data for Accumulated Activity Groups
63
Table 3: Dependent Variable Results for All Subjects
67
Table 4: Established Risk Values by Gender
84
Table 5: Calculated CVD Risk Scores
85
Table 6: Descriptive Statistics by Age
89
Table 7: Percent Time in Each Activity Intensity by Day of Week
90
Table 8: Percent Time in Each Activity Intensity by Age and Gender
92
Table 9: Correlations of CV Risk Equations with Activity Intensity
93
Table 10: Correlations of CV risk A with PA by Age & Gender
95
Table 11: Descriptive Statistics and T-test Results
113
Table 12: T-test Results for Blood Sample Variables
114
Table 13: T-test Results for Functional Tests
115
Table 14: T-test Results for Accelerometer Data
116
vi
GLOSSARY
6 minute walk. A submaximal functional exercise test that correlates with maximal oxygen uptake accelerometer. A motion sensor device used to objectively measure physical activity by continuously recording multidirectional movement acidosis. An increased acidity or increased hydrogen ion (H+) concentration in the bloodstream due to increased production of H+ by the body Actical. Brand name of accelerometer made by Mini Mitter and Respironics® Active Living Everyday® (ALED). An educational program designed to promote increasing physical activity through changes in lifestyle activity monitor. A term used to generically describe devices that measure physical activity like an accelerometer acute phase response. A body defense that occurs during acute illnesses involving increased production of blood proteins termed acute phase proteins like C-reactive protein that are produced by cells in the liver that promote inflammation acute phase protein. A cytokine protein whose plasma concentration increases by 25% or more during an acute inflammatory response aerobic fitness. The ability of the circulatory and respiratory systems to supply oxygen to skeletal muscles during sustained physical activity. The quantification of the ability to sustain work for prolonged periods anaerobic metabolism. Energy utilization (catabolism) that is not dependent on oxygen angiography. The radiographic visualization of the blood vessels after injection of a radiopaque substance assay. Analysis of a substance to determine the presence, absence, or quantity of one or more components atherosclerosis. A progressive disease process characterized by an accumulation of abnormal fatty deposits (plaque) in the inner layer of the arteries (endothelium) vii
basal metabolic rate. The minimal level of energy required to sustain vital functions in the waking state body mass index (BMI). A commonly used measure of body fatness calculated by dividing the weight (kilograms) of an individual by their height (meters) squared Borg rating of perceived exertion (RPE). A measurement scale used to obtain quantitative identification of the feeling of fatigue that is highly correlated with heart rate calorimetry. A non-invasive measurement of energy expenditure using oxygen consumption cardioprotective. Anything that reduces risk or problems related to the heart cardiorespiratory fitness. The ability of the circulatory and respiratory systems to supply oxygen to skeletal muscles during sustained physical activity cardiovascular disease (CVD). A class of diseases that involve the heart or blood vessels usually used to refer to those related to atherosclerosis cardiovascular events. An incident related to or caused by cardiovascular disease (atherosclerosis) causing temporary or permanent blockage of an artery and resulting in damage to an organ (heart, brain) supplied by the artery cell adhesion molecules. Molecules that regulate the binding of a cell to another cell or to a surface or matrix cerebrovascular accident (CVA). Also known as stroke. A loss of a portion of brain function due to an interruption in the blood supply to part of the brain coronary heart disease (CHD). The result of the accumulation of atherosclerotic plaques within the walls of the arteries that supply the heart C-reactive protein (CRP). An acute phase protein (cytokine) produced by the liver found in the plasma and used as a marker of systemic inflammation cytokines. Small secreted proteins which mediate and regulate immunity and inflammation cytotoxic. Any agent or process that kills cells viii
diabetes mellitus. A metabolic disorder characterized by hyperglycemia (high blood sugar) resulting from low levels of insulin or resistance to the effects of insulin doubly-labeled water. An isotope-based method of estimating total daily energy expenditure in free-living conditions dyslipidemia. A disorder of lipoprotein metabolism, that may be manifested by elevation of the total cholesterol, low-density lipoprotein cholesterol and the triglyceride concentrations, and a decrease in the high-density lipoprotein (HDL) cholesterol concentration in the blood electrocardiogram. A recording of the electrical activity of the heart endothelium. A layer of flat cells lining the closed internal spaces of the body such as the inside of blood vessels ergometry. The process of measuring work performed during exercise erythrocyte sedimentation rate (ESR). A blood test that is used to monitor inflammation that is measured by recording the rate at which red blood cells sediment in a tube of normal saline over time excess CO2. The carbon dioxide exhaled due to the buffering of hydrogen ions during exercise above the ventilatory or anaerobic threshold fatty streaks. Lesions in the blood vessels caused by an elevated local content of membrane bound cholesterol and fats that represent the earliest visible stage of atherosclerosis fibrinogen. An acute phase protein from which a normal blood clot may eventually be generated foam cells. Particular cells found in the blood vessel endothelium derived from both macrophages (white blood cells) and smooth muscle cells which have accumulated and oxidized low density lipoproteins. Develop after fatty streaks and present in intermediate and advanced stages of atherosclerosis Framingham risk score. A risk calculation based on the Framingham heart study that evaluates a person's risk of developing coronary heart disease in the next 10 years
ix
Friedwald equation. The most common method used for indirectly measuring a cholesterol component such as low density lipoprotein when the other major levels are already known Glycosylated hemoglobin (HbA1c). A blood test that provides an average of blood glucose measurements over a 2-3 month period by measuring the amount of sugar attached or combined with hemoglobin Hepatic. Having to do with the liver high density lipoprotein (HDL). A molecule made up of combinations of lipids and proteins that transports cholesterol to the liver. The higher the HDL cholesterol level, the lower the risk of coronary artery disease hypertension. High blood pressure Ig-G (immunoglobulin-G). The most abundant antibodies circulating in the blood. Involved in inflammation and the immune response IL-1 (interleukin-1). A pro-inflammatory cytokine involved in the immune response that increases the expression of cellular adhesion factors IL-6 (interleukin-6). A pro-inflammatory cytokine secreted by T cells and macrophages to stimulate and mediate the acute phase response inflammatory markers. Proteins found in the blood plasma that can be used to indicate an inflammatory process is taking place (C-reactive protein and fibrinogen) insulin sensitivity. The amount of responsiveness of the cell to insulin when it binds to cell receptors (to facilitate glucose uptake). Sensitivity is decreased when exposed to high insulin levels over long time periods and is the precursor of type 2 diabetes mellitus kilocalorie (kcal). A unit of measurement of the amount of energy expended or consumed lactate. The byproduct of energy expenditure (glycolysis) during intense exercise, when aerobic metabolism cannot produce ATP quickly enough to supply the demands of the muscle lactate threshold. Represents the highest steady-state exercising intensity that can be maintained for prolonged periods of time (anaerobic threshold). Above this point, lactate production exceeds clearance x
low density lipoprotein (LDL). A molecule made up of combinations of lipids and proteins that carries cholesterol from the liver to other cells and tissues lupus erythamatosis. An autoimmune inflammatory disease of the connective tissues macrophages. A type of white blood cell that ingests foreign material and is a key player in the immune response metabolic equivalent (MET). A ratio comparing energy expenditure in the resting state to metabolic rate while performing some task. Commonly used in the context of aerobic exercise to gauge the intensity of the workout metabolic syndrome. A collection of commonly clustered conditions or risk factors that increase your chance of developing heart disease, stroke, and diabetes minute ventilation. The volume of air breathed each minute. A measurement used when measuring oxygen consumption to calculate energy expenditure moderate intensity. A relative measure of difficulty of physical activity, defined as physical activity between 3 and 6 METs modified v-slope. A method of visually determining ventilatory threshold that plots the minute production of carbon dioxide (VCO2) versus the minute utilization of oxygen (VO2) pedometer. A portable device which counts each step a person takes that is often used as a monitor to promote increases in physical activity physical activity (PA). Any bodily movement, planned or unplanned, produced by skeletal muscles that results in energy expenditure physical fitness. A set of attributes that a person has that relate to the ability to perform physical activity. Cardiorespiratory fitness is a type of fitness related to the ability to perform aerobic (endurance) activities plaques. An accumulation and swelling in artery walls that is made up of cells, or cell debris, that contain cholesterol, calcium and other tissue characterizing the atherosclerotic disease process
xi
Reebok 1-mile walk. A validated field test that allows estimation of VO2max using heart rate and one-mile walk time respiratory exchange ratio (RER). The ratio of carbon dioxide produced to oxygen consumed. Used in indirect calorimetry testing of energy expenditure rheumatoid arthritis. A chronic, inflammatory autoimmune disorder that causes the immune system to attack the joints sedentary. Activity level defined as not meeting the guidelines of 30 minutes of moderate level activity most days a week serum. The liquid component of blood, in which the blood cells are suspended stages of change. Also known as the transtheoretical model is a model that describes how changes in behavior proceed. It recognizes that a change in behavior occurs gradually and at an individualized rate stroke. A loss of a portion of brain function due to an interruption in the blood supply to part of the brain thrombosis. The obstruction of an artery or vein by a blood clot timed up and go (TUG). A validated test that combines balance, coordination and function most commonly used to assess fall risk. It includes a number of tasks such as standing from a seating position, walking, turning, stopping, and sitting down TNF-alpha (Tumor necrosis factor-alpha). A cytokine involved in systemic inflammation that stimulates the acute phase response transtheoretical model. A model that describes how changes in behavior proceed. It recognizes that a change in behavior occurs gradually and at an individualized rate type 2 diabetes mellitus. A metabolic disorder characterized by hyperglycemia (high blood sugar) resulting from resistance to the effects of insulin ventilatory equivalent (Ve). Term used to describe minute ventilation during breathing ventilatory equivalent method. A means of visually determining ventilatory threshold by plotting the ratio of Ve to oxygen consumption (Ve/VO2) over the ratio of Ve to carbon dioxide expiration (Ve/VCO2) xii
ventilatory threshold. Represents the highest steady-state exercising intensity that can be maintained for prolonged periods of time. Indicated by the point where ventilation increases disproportionately to oxygen consumption vigorous intensity. A relative measure of difficulty of physical activity, defined as physical activity above 6 METs VO2max. The maximal capacity of the cardiovascular system to provide oxygen to muscle cells during sustained exercise generally measured in a graded exercise test. Reached when oxygen consumption plateaus despite increases in workload VO2peak. The maximum oxygen capacity attained in an incremental exercise test if VO2max was not reached Westergren method. Most common procedure for testing erythrocyte sedimentation rate
xiii
INTRODUCTION
Cardiovascular disease (CVD) is the leading cause of death in the United States.1, 2 Risk factors have been established for CVD, however cardiovascular (CV) events like myocardial infarction and stroke often occur when CVD risk factor levels are within normal limits. Routine physical activity decreases CVD3, 4 and its risk factors5-9 and improves health.2 Physical activity is inversely related to both CV event risk and to many of the individual CVD risk factors (hypertension, dyslipidemia, diabetes mellitus, obesity).2 Despite the overwhelming evidence of the benefits of physical activity, more than 60% of adults in the United States are not regularly physically active and 25% are not active at all.2 Current physical activity recommendations are to accumulate 30 minutes of moderate activity most days of the week. These recommendations may be met through one continuous bout of exercise or through accumulation of several shorter bouts.2 Some programs encourage accumulation of physical activity throughout the day using pedometers to monitor physical activity. It is unclear if the intensity and duration of physical activity attained in these accumulated physical activity programs is sufficient to improve CVD risk factors. The inverse relationship between physical activity and CV risk is well established however much dispute remains about the optimal intensity and duration of physical activity needed to induce health benefits and to lower CV risk. Because it is very difficult to obtain accurate information on habitual daily 1
activity without disrupting free living, physical activity recommendations are broad and the specifics of the relationship between physical activity and CV risk remain uncertain. Physical activity recommendations have evolved from 20 minutes of vigorous activity 3 days per week to at least 30 minutes of moderate activity most days of the week.2 These recommendations are based on epidemiological evidence using self-reported physical activity and cardiorespiratory fitness (VO2max). Self-report is a subjective assessment of physical activity and error rates range from 35 to 50 percent.10, 11 Although findings using cardiorespiratory physical fitness (VO2max) are more consistent than those using self-reported physical activity,2 cardiorespiratory fitness does not provide specific information on physical activity intensity and duration during free living. If the intensity and duration of physical activity best related to CV risk could be identified, perhaps public physical activity recommendations could be improved. In individuals with physical impairments, the relationship between physical activity and CVD risk may differ from the general population. Residual neurological impairments from stroke decrease energy efficiency and increase energy cost of movement. As a result a higher intensity of physical activity is required for mobility and routine daily activities. If stroke survivors work harder than individuals without impairment to perform the same task, then fitness levels should be higher in stroke survivors unless other parameters of physical activity differ. Measurement of habitual physical activity intensity and duration would assist in better defining the relationship between physical activity and CVD risk in these individuals. 2
Cardiovascular events like myocardial infarction and stroke often occur when CVD risk factor levels are within normal limits. Researchers have suggested the use of C-reactive protein (CRP) levels to improve the detection of CV risk and increase the prediction of CV events.12 Physical activity may also be inversely related to baseline levels of CRP.13 The short term effects of exercise on CRP levels have been investigated however the relationship between habitual physical activity and CRP has yet to be explored. By investigating the relationship between physical activity and CVD risk factors including CRP, additional information may be obtained on how to decrease CVD risk prior to a CV event and advise individuals on appropriate activity programs for cardiovascular health. The purpose of this collection of studies is to explore the association between CVD and physical activity and attempt to identify some specifics of this complex relationship.
3
CHAPTER 1 REVIEW OF LITERATURE
Cardiovascular Disease Cardiovascular disease (CVD) is the number one cause of death in the United States and other westernized societies and its incidence continues to rise.1, 2 By the year 2020, cardiovascular disease will be the leading cause of mortality in the world.1 Cardiovascular disease is comprised of several different diseases all caused by atherosclerosis. Atherosclerosis of the heart is coronary heart disease (CHD), of the brain is ischemic cerebrovascular disease (CVA or stroke) and of the extremities is peripheral vascular disease (PVD). Atherosclerosis is a progressive disease that is caused by an accumulation of plaque along the blood vessels walls (endothelium). Risk factors are common in children and persist into adulthood.14 Plaque buildup begins in childhood with fatty streaks characteristic of atherosclerosis detected as early as adolescence.14 Much research has been done into what causes and predisposes individuals to developing cardiovascular disease. The Surgeon General’s report on the importance of physical activity for health and prevention of disease identified 8 risk factors for cardiovascular disease.2 They include age greater than 45 for males and greater than 55 for females, family history of CVD, high blood pressure (hypertension), diabetes mellitus, smoking, dyslipidemia (cholesterol imbalance), obesity and lack of physical activity. Only two of these factors are unchangeable, age and family history. The remaining six are 4
commonly seen together and are modifiable through lifestyle changes. The modifiable risk factors high cholesterol, smoking, high blood pressure, diabetes mellitus, obesity and physical inactivity will be briefly discussed below. Hypertension It is commonly accepted knowledge that high blood pressure is a risk factor for CVD. The Framingham study revealed the importance of systolic blood pressure on the risk of CVD.15 Isolated systolic hypertension ( > 160mmHg) was found to be independently predictive of CVD.16 Lowering diastolic blood pressure by 5 mm/Hg lowers the risk of stroke by 34% and CVD by 21% according to a review of the literature by MacMahon et al.17 Normal levels of blood pressure are systolic less than 120 mmHg and diastolic less than 80 mmHg. Smoking Smoking is a major cause of CVD2 and is included in major risk assessments such as the Framingham for CVD and stroke.18 The relative risk (RR) of CVD for smoking 1 to 5 cigarettes per day was calculated to be 2.47 (95% confidence interval (CI), 1.12 - 5.45) and for smoking 1 to 14 cigarettes per day was 3.12 compared to that of non-smoker (RR = 1.0).19, 20 In the Nurses Health Study, a strong dose response relationship was found between risk of CVD and the number of cigarettes smoked per day.21 The Surgeon General recommends total cessation of smoking for optimal health.20 Dyslipidemia Dyslipidemia is defined as having elevated levels of total cholesterol (TC) and low density lipoprotein cholesterol (LDL) and depressed levels of high 5
density lipoprotein cholesterol (HDL). Normal levels of total cholesterol are less than 200 mg/dl, optimal LDL cholesterol levels are less than 100 mg/dl with less than 130 mg/dl considered normal and for HDL cholesterol levels greater than 40 mg/dl are considered normal.22 Total cholesterol, LDL cholesterol and HDL cholesterol are well established as strong independent predictors of CVD.15, 22 A meta-analysis by the National Heart, Lung and Blood Institute disclosed that there is a 2 to 4 times greater CVD risk in individuals with total cholesterol greater that 240 mg/dl than those with levels less than 200 mg/dl.23 It was ascertained in the Framingham Study,15 and is now well established in the literature, that levels of LDL cholesterol are positively associated with the risk of CVD.24 The Asia Pacific Cohort Studies Collaboration compared quartiles of LDL cholesterol levels and found that the highest LDL cholesterol level had a relative risk for CVD of 1.55 (95% CI, 1.10 - 2.18) versus the lowest LDL cholesterol level.24 Levels of HDL cholesterol are inversely related to CVD incidence. Low concentrations of HDL cholesterol (25 mg/dl) were associated with high risk of CVD regardless of LDL cholesterol levels.25 The Israeli Ischemic Heart Disease Study compared HDL cholesterol levels to risk of ischemic stroke mortality.26 Men in the lowest HDL cholesterol tertile had a 1.32 risk of mortality from stroke than those in the highest tertile of HDL cholesterol (95% CI, 0.95 to 1.83). Increasing HDL cholesterol levels by 1 mg/dl reduces CVD risk by 3% in women and 2% in men.25
6
Diabetes Mellitus Cardiovascular disease is the cause of death in 65% of patients with Type 2 diabetes mellitus.18 Type 2 diabetes is characterized by insulin resistance and as a result, persistently high blood glucose levels (hyperglycemia). People with diabetes have a two to four times greater risk of developing CVD than those with normal fasting glucose levels.27 Preceding the onset of type 2 diabetes by years is a common clustering of risk factors for CVD known as metabolic syndrome. Metabolic syndrome is characterized by hyperglycemia, dyslipidemia, obesity, and hypertension among other conditions.28 The high number of CVD risk factors present in individuals with either metabolic syndrome or type 2 diabetes increases the likelihood of a CVD event. Normal fasting blood sugar values are less than 100 mg/dl or hemoglobin A1C levels of 4 to 6 percent.29 The HbA1c test, which measures the percentage of red blood cells with glucose bound to the hemoglobin, is considered the most objective and reliable measure of long term blood sugar levels.30, 31 Obesity Obesity is related to increased insulin resistance (the precursor of type 2 diabetes mellitus), blood pressure and LDL cholesterol levels.27, 28, 32 A clinical measurement of total obesity is body mass index (BMI) and is calculated by obtaining an individual’s weight in kilograms and dividing it by the square of the height in meters. Normal levels of BMI are considered to be less than 25 kg/m2,
7
obese greater than 30 kg/m2 and between 25 and 30 kg/m2 considered overweight.33 Women with a BMI 23 to 25 kg/m2 had a 50% increase in CVD risk than their lower weight counterparts. Men with BMI of 25 to 29 kg/m2 were 72% more likely to develop CVD than men of normal weight.34, 35 Investigators in the first National Health and Nutrition Examination Survey (NHANES) study observed the relative risk for CVD of the obese group (BMI > 30 kg/m2) to be 1.28 versus normal weight individuals (BMI < 25 kg/m2) risk of 1.00 (95% CI 1.10 - 1.49, p < 0.001).36 In general, as BMI increases, the relative risk of CVD increases. Researchers have found a connection between visceral or central abdominal obesity and risk of diseases such as CVD, the metabolic syndrome and diabetes mellitus. The two most common assessments of abdominal obesity include waist girth and waist to hip ratio. Two studies on Swedish men and women conducted in 1984 established waist to hip ratio as a cardiovascular risk factor.37, 38 Recommended waist to hip ratios are less than 0.88 in women and less than 1.0 in men.33 Waist circumference alone, since it is one measure rather than two, has also been advocated as a simple measure of abdominal obesity and has been associated with CHD and CVD risk.39 In a 2003 study by Welborn et al. waist to hip ratio predicted CVD and CHD mortality better than waist circumference alone and both were better than BMI in both men and women but not all researchers agree.40, 41 It is still a common practice to use BMI as a measure of obesity and health risk. Most recently, Woo et al. found that the relationship of waist 8
circumference measurements with health risk is different in people over 70 years old. The accuracy of prediction of CVD was reported to be similar to BMI.40 To evaluate obesity, the National Cholesterol Education Program (NCEP) advises using a waist circumference greater than 102 cm (40 inches) in men and greater than 88 cm (35 inches) in women however stricter guidelines have been recently recommended.42, 43 Bray proposes stratified risk levels of waist circumference using increments of ten centimeters to differentiate levels of very low, low, high and very high.43 Less than 70 cm for women and less than 80 cm for men is considered very low with 90 cm or more in women and 100 cm or more in men considered high.43 To best assess total and abdominal adiposity as well as risk of disease, researchers have suggested using both BMI and either waist circumference or waist to hip ratio.43, 44 Sedentary Lifestyle Lack of physical activity is an important risk factor in a number of chronic diseases including diabetes mellitus, obesity and cardiovascular disease. Ten years ago it was estimated that over 50% of the population of the United States exercised for less than 20 minutes three times per week.45 From the 1996 Surgeon General’s report it was estimated that in the United States, more than 60% of adults are not regularly physically active, 25% are not active at all and 41% of women and 35% of men engage in no physical activity outside of work.2 In addition, nearly half of America’s youth are not vigorously active on a regular basis with physical activity significantly declining during adolescence.2
9
Routine physical activity decreases atherosclerosis and cardiovascular disease (CVD),4, 45 improves endothelial control,45 lowers blood pressure5-9 lowers body fat and obesity,5, 9 improves insulin sensitivity,5, 34, 46 improves total cholesterol to HDL cholesterol ratios,5 raises HDL cholesterol levels,9 reduces smoking frequency9 and decreases systemic inflammation.47-49 Other benefits include decreased health care costs,2, 50, 51 improved mood, better quality of life and decreased all cause mortality.52, 53 Physical activity is inversely related to CVD mortality risk.2, 54 A decrease in total energy expenditure is associated with increased CVD risk regardless of activity level and even after controlling for age and BMI.55 It is well established in the literature that routine physical activity decreases the risk of atherosclerosis and CVD for both older and younger adults2, 4 and even moderate levels of activity can be cardioprotective.2 Currently, the amount of recommended physical activity is 30 to 60 minutes of moderate level physical activity most if not all days of the week.2, 56 These levels will be described in more detail in a later section. Inflammation Atherosclerosis is a primary cause of CVD. Studies in cell biology, on animals, in clinical research and in epidemiology have suggested that atherosclerotic lesions are caused by an inflammatory response.57 Ford et al states that inflammation is of critical importance in the development of cardiovascular disease and it occurs throughout the process of atherosclerosis.58
10
Dyslipidemia The inflammatory response in the artery wall is initiated and perpetuated by high levels of LDL cholesterol in the bloodstream.1 These LDL cholesterol particles get deposited within the walls of the endothelium and build up over time. As atherosclerotic plaques build, the body attempts to process the deposits of oxidized low density lipoprotein cholesterol within the plaques, causing an inflammatory response by macrophages (a type of white blood cell) and perpetuation of the problem. When the macrophages accumulate too much LDL cholesterol, they burst becoming foam cells that remain within the endothelial wall. This perpetuates the inflammatory response. The continuation of this process results in a chronic, low grade inflammatory state.59, 60 Over the years, these inflamed plaques can become unstable and prone to rupture or can accumulate and narrow the blood vessel to a point that ischemia results in the tissues supplied. Atherosclerosis may be mediated by levels of HDL molecules in the blood.1 The anti-atherogenic effects of HDL come from its reversal of cholesterol deposition, anti-oxidative properties and anti-inflammatory role.1, 61, 62 High density lipoproteins assist in the transport and removal of LDL cholesterol from the bloodstream and the artery walls returning it to the liver for synthesis of other substances.62 The presence of HDL cholesterol affects expression of endothelial cell adhesion molecules,61 decreases the formation of oxidized LDL cholesterol and probably even suppresses cytokine production (e.g. c-reactive protein) in the liver.60 Low HDL cholesterol has been linked to higher risk of carotid artery 11
atherosclerosis, ischemic stroke and atherosclerotic progression.25 LDL cholesterol concentration was positively associated and HDL cholesterol was negatively associated with the extent of fatty streaks and raised lesions.63 Diabetes Mellitus Those with type 2 diabetes and metabolic syndrome have accelerated plaque development and advancement of atherosclerosis. Measurement of atherosclerosis in patients undergoing angiography found that atherosclerosis was significantly higher in subjects with diabetes than in those without diabetes.64 Aronson et al, observed the inflammatory marker C-reactive protein (CRP) to be lowest among those with normal fasting glucose levels [high sensitivity CRP (hsCRP) 0.94 + 0.11, p = 0.018] and highest in individuals diagnosed with diabetes (hs-CRP 1.11 + 0.13, p = 0.004).65 In addition, the investigators found mean levels of CRP to increase with the number of metabolic syndrome components present.65 Cross sectional findings confirm elevated inflammatory marker concentrations among individuals who have diabetes.66 Smoking Smoking is known to accelerate atherosclerotic plaque development from the time of earliest detection to the most advanced stages of atherosclerosis.67 Smoking was associated with more extensive fatty streaks and raised lesions in the abdominal aorta than not smoking.63 Grundy et al suggest that cigarette smoking promotes rupture and thrombosis of atherosclerotic plaques by destabilizing them.67 It is believed that the chemical toxins in cigarette smoke irritate the endothelial lining accelerating the inflammatory response. Smoking 12
cessation lowers the risk of atherosclerotic thrombosis by one half after one year.68 Hypertension Inflammation is also thought to play a role in the development of hypertension or high blood pressure.69 The level of the inflammatory marker CRP was associated with increased risk of hypertension in the Women’s Health Study.69 As atherosclerotic plaques accumulate within the blood vessel walls, the arteries are believed to become less compliant and unable to adjust to differing blood flow pressures and volumes. The presence of atherosclerotic inflammation in the vessels walls may reduce nitric oxide production in the endothelial cells further exacerbating the situation by causing vasoconstriction and increasing blood pressure further.70 Obesity Obesity, blood pressure, diabetes and smoking were all positively associated with levels of inflammation as measured by CRP.57 There is a strong association of the inflammatory marker CRP with components of the metabolic syndrome, particularly obesity (r = 0.36, p < 0.0001).65 Abdominal fat often called central obesity, is suggested as a key regulatory site for the inflammatory process.65, 71 In cross sectional studies, elevation of CRP was found among individuals who are obese.66 A high negative correlation between weight loss and inflammation was observed by Heilbronn et al and by Tchernof et al in two separate studies of healthy obese women.71, 72
13
Inflammation and Cardiovascular Disease Because the development of atherosclerosis is undetectable without invasive procedures, scientists have searched for indicators of impending cardiovascular events. Many measures including LDL cholesterol and the ratio of total cholesterol (TC) to high density lipoprotein (HDL) have been used to monitor the potential for an atherosclerotic ischemic event. However, these measures have not proven predictive. For example, elevated LDL cholesterol levels are present in only 50% of individuals who experience a cardiovascular event.73, 74 Seventy seven percent of first cardiovascular events occurred in women with LDL cholesterol levels below 160 mg/dl and 46% occurred with levels below 130 mg/dl.73 Clearly, another measure is needed to assist in predicting risk of cardiovascular morbidity. Researchers have suggested that low grade inflammation can predict increased risk of cardiovascular events but a causal connection has not been determined. Since atherosclerosis is an inflammatory process, a marker of inflammation is a logical choice to monitor progression. Almost every phase of the atherosclerotic disease process involves acute phase reactants that are characteristic of the inflammatory process.75 Serum markers of inflammation have the potential to directly or indirectly monitor atherosclerosis and perhaps to identify asymptomatic individuals as appropriate candidates for aggressive primary prevention.76, 77 Several acute phase reactants have been studied as potential markers of low grade inflammation including erythrocyte sedimentation rate (ESR), white blood cell count (WBC), fibrinogen, and CRP.78 14
Traditionally, ESR has been the standard used to monitor the inflammatory response. Erythrocyte sedimentation rate is a measure of the rate at which red blood cells (RBC) settle to the bottom of a test tube containing normal saline, leaving the blood serum visible above. The sedimentation rate is a measure of how far the top of the RBC layer has fallen in one hour.79 The sedimentation rate is larger with increasing levels of inflammation. Normal sedimentation rate, using the Westergren method, is 0 - 15 millimeters per hour for males and 0 - 20 millimeters per hour for females.79 There are limitations to the use of ESR in measuring inflammation. It is non-specific, is altered by normal physiological occurrences, has low sensitivity and changes in ESR are slow and occur for variable amounts of time.80, 81 Sedimentation rate is also affected by ambient temperature and is influenced by RBC disorders, pregnancy and smoking.81 For these reasons, ESR is not considered for use in predicting cardiovascular disease. Two other commonly used tests for inflammation are fibrinogen levels and WBC. Fibrinogen is a protein synthesized by the liver which is necessary for normal blood clotting. It has been established as an independent risk factor for cardiovascular disease.82 Normal fibrinogen levels range from 150-400 mg/dl.79 The use of fibrinogen has not gained widespread acceptance and it only enhances the prediction of future events by established risk factors by 8%.83 A WBC count can be an indicator of an infection, inflammation, or allergy. It is a very non-specific marker of inflammation. Normal clinical values for WBC in adults range from 4.5 x 10⁶ to 11 x 106 cells/L.79 Elevations in WBC count have 15
been found to be useful in predicting coronary heart disease (CHD) mortality independent of other CVD risk factors.84 However WBC levels have mainly been studied in those with diagnosed CVD. Few studies have assessed the association of WBC with CVD events in apparently healthy individuals and these results have been mixed.84 C – Reactive Protein Recently, a protein known as CRP has been investigated as a monitor of the acute phase inflammatory response. C-reactive protein is a protein secreted by the liver during a systemic acute phase response of the immune system. The liver produces CRP in response to secretion of tumor necrosis factor (TNF-α), interleukin-1 (IL-1), and interleukin-6 (IL-6) by the adipose, muscle and other tissue when damage is occurring.85, 86 Interleukin-6 is a major hepatic stimulant and levels are directly correlated with CRP levels.87 C - reactive protein is a part of the body’s inflammatory cascade activating neutrophils, inhibiting platelet aggregation and facilitating cytotoxic reactions.88 Its role is to bind with Immunoglobulin G (IgG) to assist in signaling further release of IL-1, neutrophils and macrophages and to bind with neutrophils to prevent their adhesion to endothelial cells.88 Through this process, CRP increases the scavenging and clearing of damaged cell particles. The end result is an increase in phagocytosis of foreign bodies. It has been determined that in apparently healthy individuals, CRP levels can predict the risk of coronary events89, 90 and risk of plaque rupture in the cardiovascular system.80 In several studies, CRP was a better predictor of 16
cardiovascular (CV) events than low-density lipoprotein cholesterol (LDL), fibrinogen or WBC count.76, 77 Plasma levels of CRP may have a higher prognostic value than the severity of coronary stenosis91 or LDL cholesterol level.92 In apparently healthy men and women, elevated levels of CRP are a strong predictor of cardiac events. In a study by Ridker, CRP was the single strongest predictor of risk and only CRP and the ratio of total cholesterol to HDL cholesterol were independently predictive.80 Acute coronary syndromes may be indicated by elevated levels of CRP. Elevated baseline levels of CRP have been associated with sudden cardiac death.89 Prediction of new coronary events is consistent with assays of hs-CRP in patients with unstable angina93 and acute myocardial infarction.77 C-reactive protein is an independent risk factor of acute coronary syndromes even after controlling for other Framingham risk scores.73 Atherosclerotic progression is positively related to CRP levels. Cosin-Sales et al.94 found assays of hs-CRP correlate with symptoms and electrocardiogram (ECG) markers of myocardial ischemia. A correlation was also found between CRP and biochemical markers of endothelial dysfunction95 and growth of new atherosclerotic plaque.96 Elevated levels of CRP in patients with coronary artery disease (CAD) were associated with impairment of the systemic endothelial vascular activity and when CRP levels normalized, there was a corresponding enhancement in endothelial vascular activity as detected by improvements in blood flow.97 Characteristics of C-Reactive Protein: C-reactive protein is detectable in the plasma and has a half life of four to seven hours. During an acute phase 17
inflammatory response, elevations of CRP begin within four to six hours, doubling every eight hours, with peak levels reached within 24 to 48 hours. The levels of CRP remain elevated while the inflammatory response persists, but decline rapidly once the acute response is terminated. Normal levels are restored within two to seven days.80, 81 These characteristics make CRP a sensitive indicator of inflammatory conditions. This was not always the case. Less than ten years ago, the standard assays of CRP were sensitive only in the 3 - 8 mg/L range.98 Normal concentration levels in the plasma are less than 0.5 mg/L with variations from 0.1 to 10 mg/L of blood plasma considered normal.79 The previous measurement method was not sensitive enough to detect small fluctuations in baseline values. The development of a high sensitivity assay of CRP (hs-CRP) has prompted a reexamination of the use of this protein in determining the presence of an inflammatory response. C-reactive protein levels increase slightly with age and are easily measured from the blood with high sensitivity assay. High sensitivity CRP testing allows detection down to 0.1 mg/dl or even less.80 Levels of CRP are unaffected by external conditions and are much less affected by other diagnoses than are ESR and WBC count. The exceptions include local infection and autoimmune diseases. In fact, in diseases such as lupus erythematosus and rheumatoid arthritis, CRP is used to monitor acute exacerbations.79 High individual variations were found in CRP levels.99 This variation can be around 60% and can be caused by minor trauma.100 Levels of CRP vary and 18
can increase to 17mg/L or higher with infection, muscle damage or any stimulus that causes inflammation. Mattusch et al. noted in a study of runners, that CRP levels were elevated in subjects with a knee injury and a systemic infection.48 Within subject variation of CRP is 4 to 6 x greater than that of cholesterol.100 Because of the fluctuation and high variability of CRP, Kushner, et al. suggest obtaining two separate tests to avoid false positives when infection is possible.100 Despite the tremendous acute variations in CRP levels, long term circulating concentrations show consistency and these levels have been related to risk of cardiovascular events.12, 101 Recommendations are to use levels below 5mg/L when using CRP as an indicator of cardiac risk.12 Levels above 5mg/L should be investigated for an infection or other pathology.76 Ridker et al stratified cardiovascular risk levels into low, moderate, and high corresponding to CRP levels of < 1, 1 to 3, and > 3 mg/L.102 Exercise and CRP: The evidence supporting the benefits of physical activity in the prevention of cardiovascular disease is overwhelming.58 Physical activity is inversely linked to blood pressure, body mass index, and glucose intolerance, all risk factors for cardiovascular disease. In previous epidemiological studies, CRP levels follow the same pattern of inverse relation to CVD. The association between physical activity and reduced coronary heart disease risk may be mediated by the anti-inflammatory effects of regular physical activity.13 Investigators in several studies have shown inverse relationships between routine physical activity level and concentration of acute phase 19
inflammatory reactants such as fibrinogen and CRP.47-49, 103 An increase in leisure time physical activity has been positively correlated to lower levels of CRP and fibrinogen.58 Abrahamson and Vaccarino found that regular physical activity is independently associated with lower levels of elevated inflammation markers, particularly CRP.13 Geffken et al found lower levels of CRP, white blood cells and fibrinogen with higher levels of total physical activity.47 Rohde et al observed that men who exercised more than one time per week had lower levels of CRP than those who did not exercise.104 Danesh et al, in 1998, reviewed previous studies of physical activity and CRP finding the relative risk of CVD to be 1.7 in the highest versus the lowest tertiles of CRP concentration (relative risk = 1.0).78 In 2000, Danesh et al performed a meta-analysis of CRP studies and the relative risk for CVD and this relative risk was 1.9 for the highest versus the lowest tertiles of CRP level (relative risk = 1.0).101 The strongest associations of CRP and CVD were found with both smoking and BMI with an odds ratio for CHD of 2.13 after adjustments versus the relative risk of 1.0 in the lowest CRP category.101 C-reactive protein may be a valid way of monitoring tissue inflammation and damage at the systemic level.105 It appears that sporadic exercise temporarily increases the inflammatory response while regular exercise lowers it.106 Acute elevation of inflammatory markers has been observed and associated with vigorous activity, most likely caused by muscle and joint inflammation.48, 107-109 High intensity, short duration exercise may cause more inflammation than lower intensity, longer duration exercise.110 Meyer et al 20
reported that repeated short bouts of cycle ergometry caused a greater acute phase response than a single longer bout of cycling exercise.111 When tissue damage or acute inflammation occurs, regardless of the cause, changes in CRP levels are not immediate. C-reactive protein levels begin rising between 4 and 8 hours after activity initiation and remain above baseline at 24 hours.112 Bench stepping for 40 minutes revealed CRP unchanged immediately post exercise. However, at one-day post exercise, CRP levels were at their highest at 3.9 mg/L returning to basal levels 2-3 days post exercise.113 The effect of exercise on CRP seems to mimic that of an inflammatory response to an infection or injury. CRP response to exercise may be attenuated with daily high intensity exercise. Trained athletes may have a diminished acute phase reaction and a suppressed inflammatory response due to adaptation to a regular exercise routine.48, 106 Regular exercise may also decrease baseline levels of CRP.108 Adaptation of the inflammatory response may occur in trained athletes105 if the athletes train regularly and avoid over-training. High sensitivity assay of CRP under resting conditions taken before and after 9 months of training fell from 1.19 mg/L to 0.82 mg/L as the mean distance run per week increased from 31 + 9 km to 53 +15 km.48 Regular training lowered CRP in both wrestlers and rowers.99 Increases in endurance exercise reduced baseline levels of CRP after 12 weeks in patients enrolled in cardiac rehabilitation.114, 115 No acute phase responses were observed after training in elite female netball and soccer teams.109
21
Intensity, duration and type of exercise affect the degree of the inflammatory response. In contrast to the above investigations, researchers found significant elevations of plasma CRP levels during and after competitive exercise in studies involving marathoners, ultra-triathlon and triathletes. During an ultra-triathlon of 48 hours, CRP levels continually increased throughout the race116 and were elevated after a 56 km footrace.117 Male marathoners had increases in plasma levels of CRP at 16 hours after racing. Levels of IL-6, the stimulator of CRP, were increased immediately post exercise and at 1-hour post exercise.112 In a canoe, cycle and running triathlon, CRP levels increased 300% within 24 hours of the race.118 Return to baseline levels may occur within 2 to 7 days depending on intensity of exercise, health and fitness level.80, 81 The differences in acute phase responses may be due to the excess stress and damage caused by the vastly different levels of intensity and distance between training for races and the actual competition. Eccentric exercise is known to cause more tissue damage than concentric and may therefore cause a greater inflammatory response.108, 119 Among athletes, female and male swimmers and male rowers had lower CRP baselines than control subjects, cyclists, runners and soccer players.108 Swimmers and rowers training at least four days per week had significantly lower baseline CRP values than untrained controls. Both swimming and rowing involve minimal eccentric exercise. Values for the control group were 0.5 mg/ml, compared to the lower values of swimmers at 0.10 mg/ml (p< 0.001) and of rowers at 0.26 mg/ml (p < 0.01).49 In the same study, athletes in sports involving 22
eccentric activities (runners, cyclists and soccer players) had baseline CRP values that did not differ from that of control subjects. When looking at the NHANES study that surveyed activity level of 17 to 65 year olds, regular jogging and aerobic dancing but not cycling, swimming or weight lifting were associated with statistically significantly lower levels of CRP.108 This is similar to the findings of Tanasescu et al. that walking, running and weight training lowered the risk of CV mortality but cycling and swimming did not.120 These results contrast those of King et al.108 It is unclear what intensity levels were performed in the latter 2 studies using physical activity questionnaires. Higher levels of activity and fitness seem to correspond to lower baseline levels of CRP. In general, CRP levels are inversely related to average daily physical activity. Elevated CRP levels were found in 21 sedentary, 17 lightly, 13 moderately and 8 vigorously physically-active study participants.58 Across fitness levels there is an inverse relationship with CRP.121, 122 However, the acute effect of exercise on CRP levels appears to vary with the type of activity, intensity level, individual fitness level and duration of activity bout.76 Summary of CRP: The inflammatory marker known as CRP may be useful in conjunction with other tests such as LDL cholesterol level in detecting risk for cardiovascular disease in at risk patients. Ridker et al recommend the use of CRP in conjunction with LDL cholesterol levels to assist in improving prediction of CVD events such as myocardial infarction and stroke.73 In athletes, the levels of CRP tend to vary with level of tissue damage during exercise but levels attenuate 23
as the body adapts to a training program. Overall, baseline levels of CRP decrease with increasing levels of physical activity indicating a lower risk for CVD. Physical Activity The terms physical activity and physical fitness are often used interchangeably in conversational language. Researchers recognize the two terms separately. Physical activity is defined as “any bodily movement, planned or unplanned, produced by skeletal muscles that results in energy expenditure.”2 Exercise is a subset of physical activity and refers to “planned, structured and repetitive bodily movement done to improve or maintain one or more of the components of physical fitness.”2 Physical fitness is “a set of attributes that a person has that relate to the ability to perform physical activity.”2 It is the ability to perform daily tasks with vigor and alertness, without undue fatigue and with ample energy to enjoy leisure time pursuits. The definition of physical fitness can differ between athletic performance and health fitness. Components of health fitness include cardiorespiratory endurance, muscular strength and endurance, flexibility and body composition.33 The American College of Sports Medicine (ACSM) reports that “cardiorespiratory physical fitness is strongly associated with health benefits in the general population”56 and is directly related to habitual physical activity.2, 122
Findings relating cardiovascular disease and health benefits of activity are
more consistent for studies using cardiorespiratory fitness than using reported physical activity.2 Cardiorespiratory or aerobic fitness will henceforth be referred 24
to in this paper as physical fitness. Both physical activity or the accumulation of movement over a specific time period, and physical fitness or the average of the daily activity intensity accumulated, have been used to quantify amount and intensity of habitual physical activity or energy expenditure. Quantification Issues Understanding the basic characteristics of habitual activity is important to understanding the relationship of physical activity (PA) to chronic diseases such as cardiovascular disease.123 Yet there is no standardization of measurement methods of physical activity in the literature.124 This is because the quantification of energy expenditure and habitual physical activity is complex. It is difficult to accurately and objectively measure the total amount of physical activity over the course of the day without disrupting the normal course of activities known as “free living.”2 Direct measurement of physical activity is possible using techniques such as direct calorimetry, expired gas analysis or doubly labeled water but these techniques are difficult and often expensive.125 Therefore, direct measurement of physical activity is primarily used in smaller scale studies. Indirect measures are more practical in larger studies and many indirect measurement techniques have been correlated to daily physical activity. There are two predominantly used methods to quantify amount of regular activity when studying all-cause mortality and cardiovascular disease mortality. They are cardiovascular physical fitness (fitness level) and self-reported physical activity. Self-reported physical activity is measured using a leisure time physical activity (LTPA) questionnaire.124 The main differences are that physical fitness is 25
an objective measure of habitual physical activity and the LTPA questionnaire is a subjective estimation of physical activity over time. Physical Activity Recommendations In 1996, the Centers for Disease Control published the Surgeon General’s report2 on the importance of physical activity for health and for the prevention of disease. This report identified risk factors for cardiovascular disease. They include age greater than 45 for males and greater than 55 for females, family history of CVD, high blood pressure (hypertension), diabetes mellitus or insulin resistance, smoking, high cholesterol (dyslipidemia), obesity and lack of physical activity. Prior to 1996, recommendations of the American College of Sports Medicine (ASCM)33, 56 and Centers for Disease Control (CDC)2, 56 suggested that vigorous activity levels of 15 to 60 minutes duration, 3 to 5 days per week were necessary for health benefits.2, 56 These recommendations were based on analysis of the lifestyles of young, healthy individuals. In the early 1990’s, the Centers for Disease Control examined the evidence collected on physical activity in middle aged and older adults and the results were incorporated into the 1996 report, “Physical Activity and Health; A Report of the Surgeon General.”2 The 1996 Surgeon General’s report established new guidelines for physical activity. To decrease risk of both CVD and all-cause mortality, “at least thirty minutes of moderate level physical activity on most, preferably all, days of the week” is recommended. Moderate activity is defined as 3 to 6 metabolic equivalents (METs), with 3 METs being similar to the level of a brisk walk.2 The 26
1996 Surgeon General’s report was based on the results of several large cohort studies including the Framingham Heart,126 the Harvard Health127 and the Aerobic Center studies.124, 128-130 These studies either used self-reported physical activity or physical fitness levels as measures of physical activity. Self-reported Physical Activity: There were seven major studies that examined the relationship of self-reported physical activity and CVD mortality.2 The Framingham study related self-reported activity levels to cardiovascular disease mortality in 4000 men and women.126 This study identified and established many of the current risk factors for heart disease including physical inactivity, smoking, hypertension, hyperlipidemia, insulin resistance and age. In the Harvard health study, Paffenbarger et al. observed self-reported activity of Harvard alumni and found that smoking, and physical inactivity were related to higher mortality rates from CVD.127 A trend of decreased death with increased self-reported activity level was also observed for both cardiovascular and allcause mortality. Cardiorespiratory Physical Fitness: Findings relating physical activity to CVD are even more consistent for studies using physical fitness than using selfreported physical activity.2 Five cohort studies related physical fitness to CVD mortality.2 Blair et al confirmed that there is an inverse relationship between cardiorespiratory fitness level and both CVD and all-cause mortality.124, 128-130 From the collected evidence, a dose-response relationship is suggested between physical activity and risk of both CVD and all-cause mortality.124 There were greater benefits for those that were the most active however, it was concluded 27
that even moderate intensity physical activity can significantly effect cardiorespiratory performance and provide health-related benefits.2 Despite these landmark studies, there are many questions that remain unanswered. Exercising at or above the Surgeon General’s recommendation is likely to decrease all cause mortality but the best method of acquiring this activity is not yet clear.124, 131 The optimal type, intensity, frequency, duration or bouts by which this activity should be accumulated has not yet been established.124 One of the difficulties encountered in establishing optimal activity for prevention of cardiovascular disease is in the measurement of physical activity during free living or unrestricted movement during daily life. Measurement of Physical Activity Self-Report: Physical activity is the total amount of movement performed by an individual above the basal metabolic rate (BMR) which is the minimal energy expenditure necessary to survive. Physical activity is most often assessed in epidemiological studies through self-report activity surveys. These are questionnaires that rely on recall of LTPA for various time periods ranging from one day to six months. These assessments are easily administered and user-friendly however questionnaires are subjective and depend on an individual’s recall and perception of activities.124 Analyses of self-reported activity reveal considerable variability and only moderate external validity.2 Estimated error associated with LTPA questionnaires ranges from 35 to 50 percent depending on the populations studied.10, 11
28
Other indirect and objective methods of measuring physical activity use heart rate monitors or motion detectors such as pedometers and accelerometers. These devices allow estimation of physical activity levels that are less accurate than direct methods while still providing an objective measurement of physical activity for longer periods at reasonable cost. Pedometer Studies: Pedometers are devices that measure vertical excursion at the hip during walking giving raw data in total number of steps. Because many daily activities incorporate walking, this information can also be used to monitor free living. Data provided by the pedometer not only consists of total steps, but calculations of distance traveled and estimates of energy expenditure can also be obtained.132 During controlled walking and running, correlations of r = 0.84 to r = 0.93 of pedometers with accelerometers have been observed.133 Some health promotion programs, such as 10,000 steps and Active Living, Everyday®, promote the use of pedometers to monitor daily activity levels and to provide both feedback and goal-oriented motivation to increase physical activity levels. Benefits of using these devices include their low cost, unobtrusiveness and ease of both use and output interpretation.132, 134 Pedometers range in cost from 10 to 50 US dollars.135 Sensitivity of pedometers can differ by brand so some care must be taken if using for research purposes.136 Particularly at slow walking speeds (less than 2.4 miles per hour), many of the pedometers underestimated actual steps and distance.136 In distance calculation, some of the error can be attributed to stride
29
length as well as step count. Stride length tends to vary with walking speed however only one stride length setting is permitted in the pedometer memory. Pedometers are designed to capture ambulatory activities and because of this, one of the major limitations of the device is the inability to capture common physical activities such as bicycling, swimming and weight lifting.132 During uphill and downhill walking, pedometers may not measure number of steps with accuracy.136 Pedometers will tend to underestimate the energy cost of most lifestyle activities including stair climbing, and those involving upper extremity activity.136 Pedometers are best at capturing steps, less accurate in calculating distance and least accurate at determining energy expenditure.134 Despite the limitations mentioned, pedometers are useful in capturing ambulatory activity throughout the day and can provide an extremely useful and objective gauge of an individual’s overall ambulatory activity levels at low cost with little inconvenience.136 With researchers finding recall of non-structured moderate level activities to be less accurate than more structured or vigorous exercise, pedometers can be beneficial to objectively measure activity whether incidental or intentional and to provide feedback to improve motivation.134 Accelerometers: Activity monitors or accelerometers are a commonly used method of assessing physical activity during free-living. Accelerometers are recognized as valid tools for assessing free living and have gained acceptance as, “Possibly the most effective method of obtaining objective information about physical activity level.”137 These monitors allow for free-living without the constraints induced by direct calorimetry methods. Though the monitors are less 30
accurate than doubly labeled water procedures or direct calorimetry methods, activity monitors provide a convenient, simple and efficient method of objectively quantifying physical activity over long periods of time at much lower cost.11, 137 Accelerometers eliminate some of the inherent limitations of self-report questionnaires including subjectivity of frequency, intensity and duration while still allowing for estimation of total energy expenditure.138, 139 They are more objective and precise than pedometers or LPTA questionnaires, and unlike LPTA questionnaires are free from random or systematic error due to recall or self report.10, 140, 141 Accelerometers measure motion in three orthogonal planes of movement and are therefore sensitive to non-ambulatory movements.133 They provide a standardized description of free-living physical activity in real time including intensity, duration and frequency.138 They can record and store activity data for extended periods and have adjustable epochs (time periods for which activity is averaged).123, 142 A reliability study of four different accelerometers to actual energy expenditure revealed interclass correlation coefficients ranging from 0.62 to 0.80.137 Comparisons of other studies showed prediction equations with correlations up to 0.89 when looking at only walking and running activities138 and up to 0.99 with level walking alone regardless of walking speed.133, 143 The device discriminated among subjects in three categories, sedentary, moderately active and active and between specific activities (such as walking, cycling and jogging) and those with varying intensities light, moderate, and intense.144 The devices tend to overestimate activity associated with excessive vibration such as riding in 31
a motor vehicle or operating machinery133 and are somewhat limited in accurate assessment of activities such as cycling and swimming due to the minimal acceleration of the center of gravity when monitoring at the hip or low back.123, 138, 142
Accelerometers costs range from 50 up to 400 US dollars.135 Accelerometers and pedometers are objective measures of physical
activity that can assist with determining which individuals are meeting or exceeding the recommended minimal levels of physical activity. Each device has its limitations and advantages. The high correlations seen between the accelerometer and pedometer by Tudor-Locke et al.145 and Schneider et al.134 (r = 0.80 - 0.86) would allow either device to be utilized particularly if only relative values are required for analysis. Physical Fitness: Another method used for measuring physical activity is fitness level. Cardiorespiratory physical fitness is directly related to habitual physical activity 2, 122 and is the type of fitness most strongly associated with health benefits in the general population.56 The benefit of using fitness as a measure of physical activity is that through objective measurement, there is a reduction of the bias that results from self-reported activity levels such as LTPA questionnaires.122 In fact, findings are more consistent for studies using fitness than using physical activity.2 The standard for fitness measurement has traditionally been VO2max. This is defined as, “The maximal capacity of the cardiovascular system to provide oxygen to muscle cells during sustained exercise.”146 It is usually determined using an incremental exercise protocol on a motorized treadmill or bicycle 32
ergometer.147 Large cohort studies have examined VO2max, relating it inversely with all-cause and CVD mortality.128, 130 The assessment of VO2max requires exercise to a maximal volitional exertion level and a high level of motivation by the subject.148 This intensity of exercise can be sustained for less than one minute.147 Specialized equipment is necessary to measure expiratory gases and it is difficult even for the best athletes to perform well because it requires exercising to exhaustion.147 Athletes and trained subjects may be able to tolerate this maximum intensity effort however for sedentary individuals, those with health problems and those at risk for cardiovascular disease, this measure is potentially dangerous and generally not well tolerated.148 Because people spend the majority of their time in submaximal levels of activity, a method that quantifies the capacity of an individual to exercise for longer periods of time is more appropriate for the general population.147 There are two such measurements that exist, lactate threshold (LT) and ventilatory threshold (VT). Chemistry of exercise: During exercise, lactate (La-) and hydrogen ions (H+) are produced by the muscle. These products are often utilized within the muscle as energy sources for the Krebs cycle and glycolysis. Excess La- and H+ ions are released from the muscle into the bloodstream. Sodium bicarbonate (Na HCO3) is present in the bloodstream. Sodium bicarbonate dissociates into Na++ HCO3-. The Na+ ions buffer La- and the HCO3buffers the H+. In this form, both the H+ and the La- can be transported through the bloodstream. The excess La- is used by the heart, the brain, and muscles in
33
other parts of the body as an energy source. The liver also takes up La- using it to produce glucose through the process of gluconeogenesis.149 The H+ ions are buffered by the bicarbonate HCO3- demonstrated by the equation: H2O +CO2 = H2CO3 = H+ + HCO3-. The direction of this equation is driven by the acidity or the amount of H+ ions present. If there are more H+ ions being produced, the equation is driven to the left, with more H2O +CO2 the result. The extra CO2 causes an increase in the partial pressure of CO2 in the blood. This excess is eliminated through formation of additional HCO3- and through gas exchange in the lungs via lung ventilation. The respiratory exchange ratio (RER) is the ratio of the volume of carbon dioxide (VCO2) expired to the volume of oxygen (VO2) consumed. Normal values during steady state exercise vary between 0.7 and 1.0.147, 150 While in steady state exercise, the production rates of La-, H+ and CO2 are equal to their elimination rates. Throughout steady state exercise, ventilation increases linearly with both oxygen consumption and carbon dioxide production. The term ventilatory equivalent (Ve) is used to describe minute ventilation and is generally used in a ratio of Ve to oxygen consumption (Ve/VO2) or to carbon dioxide expiration (Ve/VCO2).150 During steady state, Ve/VO2 averages between 20 and 25 liters of air per liter of O2 consumed.147, 150 When the body exceeds its aerobic capacity, both La- and H+ accumulate in the bloodstream and surpass the system’s utilization of La- and buffering capacity of H+ ions. The buffered H+ is combined with bicarbonate and expired into the air as excess CO2. When the production of La- exceeds the buffering capability and uptake/utilization, the LT is reached.151 The LT can also be defined 34
as the maximum intensity at which a steady state of exercise can be maintained.33, 147 Above LT, acidosis develops accompanied by increases in the partial pressure of CO2. The increase in acidosis causes ventilation to increase to facilitate O2 and CO2 exchange helping rid the body of the excess CO2. As the intensity of exercise continues to increase, the production of H+ ions exceeds the body’s ability to buffer the ions and ventilation starts to increase in a non-linear fashion. This point where ventilation deviates from the progressive linear increase of steady state is called the ventilatory threshold (VT).152 When below VT, an individual can achieve a steady state of activity where not only heart rate but VO2 and VCO2 expiratory gases remain constant. When above VT, the kinetics of CO2 change because CO2 is not being produced solely as a consequence of aerobic metabolism. Additional carbon dioxide is produced and expired when the acid buffered by the bicarbonate system exceeds the capacity of the system.153 The excess CO2 causes the respiratory exchange ratio (RER) to increase above 1.0.147, 150 As a result, there is an increase in CO2 without an increase in O2 at VT. The accumulation of H+ ions lowers the blood pH altering energy production and muscle contraction.151 The accurate measurement of LT requires an invasive procedure to obtain samples of blood to measure levels of lactate. These measures must be repeated at least once every minute. Because of frequent sampling and the variation of blood lactate concentrations depending on sample site, the standard procedure is to use either central venous or arterial samples through the use of a 35
catheter line. Medical supervision is necessary and there is a potential risk for complications particularly with sampling centrally.147 Ventilatory threshold is considered an indirect measure of LT.154, 155 It is a noninvasive method of determining the LT by plotting ventilation and respiratory data. The LT and the ventilatory threshold are known to occur at similar time periods however they are not directly linked.151 When the metabolic needs for oxygen in the muscle exceed the capacity of the cardiopulmonary system to supply them, there is a sudden increase in anaerobic metabolism and lactate is formed.151 The level of activity at VT corresponds with intensity that causes the first rise in blood lactate levels.152 Strong relationships have been established between VT and LT with high correlations between LT and VT found in studies by Davis in 1976 and Caiozzo in 1982 (r = 0.88 to 0.95).154, 155 High correlations with LT have been found for V-slope, Excess CO2 (Ex CO2) and ventilatory equivalent, (all measures of ventilatory threshold) with correlation coefficients at 0.81, 0.94 and 0.87 respectively.156 Using a combination of the above methods to determine VT, Gaskill et al. (2001) found high correlations with LT (r2 = 0.9850).156 It has become more common to use VT as a basis for determining fitness level and exercise intensity.156 Researchers have demonstrated that VT is an accurate method of determining fitness level and have shown a positive correlation between daily physical activity intensity and VT.156 Scientists from the HERITAGE Family study suggest, “VT is more related to self-reported activity levels, activity level during activities of daily living, intensity of prescribed physical 36
work and maximal sustainable work than is VO2max.”156 There are several different methods of determining VT including ventilatory equivalents (VE), excess CO2 (Ex CO2), and modified V-slope (V-slope). All three methods use graphing techniques and require determination of the first non-linear change or breakpoint in the slope. These methods are described below. The ventilatory equivalent method plots Ve/VCO2 and Ve/VO2 previously defined as the volume of air ventilated divided by the volume of CO2 expired (Ve/VCO2) and O2 consumed (Ve/VO2) (see figure 1). This method requires locating the intensity of activity that causes the first rise in the ventilatory equivalent of oxygen (Ve/VO2) without a concurrent rise in the ventilatory equivalent of carbon dioxide (Ve/VCO2). This method is dependent on the ventilatory response to exercise.157 Caiozzo et al. recommended VE/ VO2 as the method of determining VT that was best correlated with La- (r = 0.93, r2 = 0.77 to 0.92).155, 156 The excess carbon dioxide method determines the intensity of activity that causes an increase from steady state production of CO2 to an excess of CO2 (see figure 1). Excess CO2 is calculated as ((VCO2/VO2 ) - VCO2).158 This method relies on the detection of excess CO2 expired when threshold is reached and has correlational values that explain 82 to 94 percent of the variance (r2 = 0.82 to 0.94).156
37
Figure 1
Visual Determination of Ventilatory Threshold
38
Figure 1: Visual determination of ventilatory threshold (VT) using three methods. The arrows designate the choice of VT in these sample graphs from one subject. A. Ventilatory equivalence method: VT is chosen at the time corresponding to the first sustained rise in the ventilatory equivalent of O2 (VE/VO2) without a concurrent rise in the ventilatory equivalent of CO2 (VE/VC O2). B. Excess CO2 method: VT is chosen at the time corresponding to the first sustained rise in excess CO2. C. Modified V-slope method: VT is chosen at the VO2 value corresponding with the increase in slope of VO2 -VCO2 plot. From: Gaskill SE, Ruby BC, Walker A, Sanchez O, Serfass R, Leon A. Medicine and Science in Sports and Exercise, 2001;33(11):1841-1848.
39
The V-slope method plots the minute production of carbon dioxide (VCO2) versus the minute utilization of oxygen (VO2). The V-slope method is dependent on proton buffering capability of the bicarbonate system. There is a breakpoint or change in slope that occurs on the graph of VCO2 versus the VO2 that corresponds with the time at which VCO2 rate surpasses VO2 rate157 or when the slope increases from less than one to greater than one (see figure 1).159 Again, a change in CO2 expiration is being detected. This method was determined to be a sensitive index and was the most reliable detector of LT with r2 values ranging from 0.81 to 0.95.156, 160, 161 Though the separate analysis of each method reports good correlations with LT, the combination of the three methods appears to have even greater accuracy. The combining of the three methods (V-slope, Ex CO2 and Ve/VCO2) to determine VT was examined by Gaskill et al. The combination of the three methods was shown to have high correlation with LT across fitness levels in adults (r = 0.95 to 0.98).156 Correlations of RER to VT have been moderate (r = 0.73 to 0.86) however monitoring changes in RER in real time can assist with approximating VT during exercise testing and can be used as a confirmation of VT attainment.157 Fitness Level and Cardiovascular Disease Fitness levels have been shown to be a strong predictor of CVD mortality.129, 162 When fitness levels were divided into quintiles, being in the lowest fifth of fitness was an important precursor of CVD mortality.52 Being the least fit is one of the stronger predictors of all cause mortality in both men and 40
women comparable to smoking, and stronger than blood pressure or cholesterol.129 Even in those who have other risk factors for cardiovascular disease, higher levels of fitness provide protection from CVD mortality.52, 163 There is evidence that the relationship between fitness and both all-cause and CVD mortality is one of dose-response.124 There is a strong inverse relationship present for both men and women between fitness level and CVD mortality.129, 164 Inverse dose-response relationships are strongest for all-cause and cardiovascular mortality; however, lower incidence rates for hypertension (high blood pressure), obesity, and type 2 diabetes mellitus have also been consistently reported in the literature.56 In general there is a stratification of mortality from unfit to fit.165, 166 Those who were sedentary and became fit improved their cardiac risk profile, and had decreased mortality rates. Their risk was significantly reduced approaching that of a moderately fit individual.165, 167 Beginning and maintaining an exercise program later in life was more beneficial than starting as an athlete and becoming sedentary.167 This held true in the Nurses Health study34 and in the Aerobics Center Longitudinal study.168 Unfit men who became fit had an estimated relative risk (rr) for CVD mortality of 0.52 compared with those who remained unfit (rr = 1.0).168 There is an association between usual habitual physical activity and aerobic fitness and risk for chronic disease.45 It would be useful to have a method of measuring an individual’s activity level without disrupting free living. Ventilatory threshold is a better marker of habitual physical activity than VO2max.152 41
Ventilatory threshold has been shown to be related to daily activity levels and an accurate measure of chronic activity levels by both Tamai169 and the HERITAGE Family study.156 Tamai et al reported that VT was correlated with discretionary physical activity (r = 0.80), work hours per month (r = 0.71) and exercise hours per month (r = 0.67).169 Participants in the HERITAGE family study who were sedentary had a mean baseline oxygen consumption at VT (VO2vt) of 17.7 + 4.1 ml/kg/min.152 These outcomes are consistent with previous researcher’s results that activities of daily living require a VO2 of 14 to 21 ml/kg/min (4 and 6 METS).169 Values for VT in athletes were maintained between 42 and 47 ml/kg/min over 15 years of training.169 The relationship between habitual physical activity and fitness is further substantiated when looking at training studies. Ventilatory threshold is a better predictor of performance in endurance events than VO2max.170 Greater improvements in VO2vt are seen when training levels are set relative to VT. Participants in the HERITAGE family study who exercised at levels above VT had greater improvements in submaximal fitness than those who exercised at levels at or below VT.156 Training at levels just above threshold increased VO2vt by 48 percent in study by Henritze et al.171 Elite athletes routinely use VO2 as an assessment of training intensity and effectiveness152 but may be better served using VT as an indicator particularly for endurance activities. Subjective Measurement of Ventilatory Threshold: The Borg scale rating of perceived exertion (RPE) was developed to subjectively assess intensity of exercise or physical activity.172 This method can also be used to determine 42
ventilatory threshold (VT) and the rate of lactate accumulation.56 The RPE scale can be useful in rapidly determining VT without expensive equipment such as a metabolic cart. Researchers have established that RPE is of practical value to prescribe exercise training intensities in sedentary adults, recreational athletes and elite athletes.
173
Swaine et al observed that regardless of habitual exercise
level and training mode, subjects selected a common intensity of effort that was compatible with the described RPE.
174
Feriche et al found no significant
differences between mean values of VT and RPE at threshold and recommend a fixed value (12 - 13) of the RPE scale to detect the exercise intensity corresponding to VT.175 Physical Activity and Cardiovascular Risk Analysis of the risk of cardiovascular disease suggests that physical activity, most commonly assessed using a LTPA questionnaire, is inversely related to mortality and morbidity in both men and women.176 Based on leisure time physical activity, median relative risk for mortality was 0.66 (95% CI) for the most active, fit women versus their sedentary counterparts who had a relative risk of 1.0. This is similar to the 0.70 (95% CI) median relative risk found for men in the same fitness levels.177 Researchers found that women also had stratification of mortality risk, from lowest to highest: active, inactive to active, sedentary.165 Haapanen et al observed that total amount of activity was related to lower CVD risk in men, but not in women.46 An inverse linear relationship was found between running amount and CVD risk. 178
43
In a meta-analysis of physical activity and CVD disease, Lee noted that 33 out of 44 studies showed an inverse relationship between amount of physical activity and all cause mortality.179 Five out of ten studies had a minimal threshold of physical activity that decreased mortality.179 These numbers are explained in the following section. It is important to note that physical activity must be current and persistent to produce the desired health benefits including cardiovascular protection.5, 14 Only ongoing or current exercise, protected against CVD.167 Increasing activity from sedentary to high levels in mid to advanced age was better than being an athlete and becoming sedentary with no vigorous activity later in life. These physically active people had a 62% lower risk than those who became sedentary.167 Physical Activity Parameters The Surgeon General’s report recommends at least 30 minutes of moderate level physical activity, most if not all days per week. This is the equivalent of 2 to 2.5 hours per week, or if walking, approximately 9 miles per week when exercise is accumulated. Does activity have to be spread throughout the week? “Weekend warriors” are described as those individuals who are sedentary during the week obtaining the majority of their physical activity during a two or three day period (Friday, Saturday, Sunday). Weekend warriors who expended great amounts of energy in only two days had a similar reduction in risk of CVD mortality as those who were active on a daily basis.176 However, those weekend warriors with CVD risk factors such as high blood pressure, 44
obesity or smoking needed higher overall activity levels than their healthy counterparts to provide protection against CVD mortality.176 Researchers in several studies found that there was a threshold of minimal fitness or physical activity necessary for protection from CVD mortality.179 For maintenance of CVD health, expenditure of at least 1000 additional kilocalories per week is necessary and seemed to be sufficient to avert premature mortality.176 Expending greater than 2000 additional kilocalories per week was the most beneficial for reducing risk factors of heart disease.167, 177, 180
In intervention studies, investigators have found that there was a thirty to forty percent decrease in CVD mortality in those who began brisk walking 2.5 to 3 hours/week34, 181 or who accumulated 1.5 hours of vigorous activity per week.34 In the Honolulu heart study, those who walked 1.5 miles per day had 50% lower risk of CVD than those who walked less than 0.25 mile/day.182 A meta-analysis of physical activity and relative risk revealed that women who walked more than one hour per week had a relative risk of 0.80 (95% CI = 0.74 -0.87) compared to those who were sedentary (RR = 1.0).183 In general, those who met or exceeded the Surgeon General’s recommendations had the greatest reduction in CVD risk however effects were seen in those with lesser amounts of daily and accumulated exercise. Intensity: Based on previous research, investigators suggest that moderate levels of physical activity are sufficient to provide protective effects against CVD mortality with more intense levels providing greater protection.167, 45
184-186
Brisk walking and vigorous exercise had similar effects on reduction of
incidence of coronary events in women in the prospective Nurses Health Study.34 In general the inverse relationship with CVD held for all activity levels. However, all the evidence does not agree. Recently, Yu et al recommended at least eight minutes of daily, high intensity activity for protection from CVD mortality. Acquiring only moderate levels of activity did not appear to provide protection.187 Determination of intensity level is generally based on an absolute scale of metabolic equivalents. These metabolic equivalents for specific activities are based on energy requirements for a healthy, fit individual and vary greatly in those with lower fitness level. Lee et al examined rate of perceived exertion as a measure of relative intensity and found an inverse association of relative intensity of physical activity to risk of CHD.188 The highest intensity category had a 0.72 relative risk (CI = 0.52 to 1.0) while the moderate category was 0.69 (CI = 0.51 to 0.94). Assessing relative intensity using RPE allows scientists to generalize intensity from the most fit to those with physical impairments that may necessitate much higher energy expenditure for the same activity.183 C-Reactive Protein and Cardiovascular Risk Factors There is limited contemporary information on the distribution of CRP and the factors associated with levels of CRP in men and women. Limited data is available on the characteristics of those individuals with elevated CRP. Further studies are necessary to identify the predictors of elevated levels of CRP.189 It is imperative to further understand the interrelationship between CVD risk factors and how to reduce the risk of CV events. 46
There are six modifiable risk factors of CVD. Inflammation has been linked to all of them. The best prediction of CVD comes from LDL cholesterol levels however 50 to 73 percent of CV events occur in the presence of normal LDL cholesterol levels.73 Can CRP levels be measured and used in combination with other cardiovascular risk factors to better determine risk of heart disease in a healthy population? There is still no good marker that exists to independently predict the risk of CV events but CRP has been suggested to be used in combination with LDL cholesterol levels. Researchers in several large scale epidemiological studies have shown that CRP is an independent predictor of cardiovascular events however relationships between CRP and CVD risk factors have not been fully elucidated.190 If CRP is a marker of CVD risk, how does it relate to CVD risk factors? In a study by Godefroi et al., CRP was divided into tertiles (less than 1 mg, 1 - 2.9 mg, and 3 mg or greater). It was observed those with elevated CRP were slightly older, more likely female, tending to be obese, less active and have been previously diagnosed with either high cholesterol or hypertension.189 In studies in which regression analyses were used, investigators found that measures of obesity were most often related to CRP levels. Ryu et al.191 related CRP to risk factors of heart disease in subjects greater than 50 years old and Raitakari et al. observed that waist circumference, smoking and HDL cholesterol accounted for 21.9% of the variance in CRP levels in participants aged 21 to 39 years old.192 Kondo et al. examined CRP in middle aged healthy Japanese workers and found body fat, BMI and HDL cholesterol to be correlated 47
with CRP (r = 0.6, r = 0.43, and r = -0.63 respectively).193 Saito et al. evaluated the relationships between CRP and CVD risk factors in 566 Japanese men and women enrolled in a health check program. Univariate regression analysis revealed a statistically significant relationship between CRP and BMI (r = 0.28), smoking (r = 0.23), and HDL cholesterol (r = -0.22).190 Recent intervention studies looked at the effects of weight loss or a physical activity program on CRP levels. In general, endurance training induces changes in CRP that seem to be related to weight loss.194 Post-menopausal women,195 obese children, and middle aged women196 had significantly decreased CRP levels after completing an exercise program. In a 12 week aerobic training study of obese girls by Nassis et al., improvements in insulin sensitivity occurred without significant changes in CRP or weight loss.197 Not all investigators agree with these findings. Okita et al. did not observe changes in CRP and weight, however decreases in CRP were not proportional to amount of weight loss.196 As physical activity (measured by either PA or physical fitness) increases the level and amount of CVD risk factors decrease. Physical activity and CRP have been linked primarily in the athlete and in those with previous CV events. There is limited information on the amount of PA or fitness necessary to control levels of CRP. If physical activity does reduce the risk of CVD through attenuation of the inflammatory response, what type of relationship exists between amount of physical activity and CRP levels? Can CRP be used as an
48
overall indicator of cardiovascular health? How does the relationship between CRP and the CV risk factors change when activity level is changed? Several recent studies illustrate that CRP levels correspond to levels of fitness122, 198 and self-reported physical activity.199, 200 Borodulin examined a cross-section of Finns between 25 and 74 years old separating males and females into four levels of self-reported conditioning and non-conditioning physical activity. It was determined that in women, the highest and lowest quartiles of conditioning differed in CRP levels by 27%. Pitsavos et al. looked at four levels of self reported activity in Greeks over 18 years old finding the two most active groups to have CRP values significantly less than the sedentary group.200 When looking at specific at risk CVD populations, exercise training reduced CRP levels significantly more than in the control populations.195, 201 Goldhammer observed 28 patients with CHD who participated in a 12 week aerobic exercise program and found that those with diabetes mellitus, decreased CRP levels by 47% and those without DM lowered CRP by 19%.201 Those with CHD or high risk of CHD and children who are obese, had greater reductions of CRP levels than controls.194, 195, 201 Summary It is still unclear how much physical activity is necessary to avoid the risk factors of CVD. Is there a minimal threshold of accumulated activity at which risk factors significantly decrease? How much exercise is cardioprotective? The Nurses Health study and the Hawaiian Heart Study in measuring physical activity 49
have determined that those with additional energy expenditures of 2000 kilocalories per week had fewer risk factors than the control subjects. This physical activity was gained primarily through brisk walking 2.5 to 3 hours per week or 1.5 miles per day. Even walking 1 hour per week lowered relative risk to 0.80.183 These energy expenditures were estimated using prediction equations based on a healthy able-bodied population and during planned periods of exercise. Can similar changes be induced in people who are physically disabled? Is there an accurate method of quantifying activity not just during planned exercise bouts but during free living? The measurement of physical activity during free-living is difficult and researchers continue to be plagued by imprecision of measurement techniques available that avoid disruption of routine activities.124 Both physical fitness and physical activity measurements can be used to define the health benefits of exercise, but is there a better measurement available than VO2max or leisure time physical activity that helps enhance the quantification of total energy expenditure and/or physical activity?202 Is there a measure that better estimates physical activity in relation to cardiovascular risk and markers of inflammation? Uncertainty remains about the optimal patterns, duration and intensity of physical activity necessary to minimize risk of CVD. When observing the relationship between physical fitness and CVD, measurements of VO2max or estimates of VO2max have been used. The assessment of VO2max requires exercise to a maximal volitional exertion level and a high level of motivation by 50
the subject.148 This measure is potentially dangerous often requiring an automated external defibrillator and the presence of medical personnel. Additionally, it is generally not well tolerated by sedentary individuals, those with health problems and those at risk for cardiovascular disease.148 A method that quantifies the capacity of an individual to exercise for longer periods of time is more appropriate for the general population because people spend the majority of their time in submaximal levels of activity.147 Currently there exists limited information on ventilatory threshold and the risk factors of CVD.203 To date there are no articles published on the relationship of ventilatory threshold to CRP and CVD risk. The question still remains as to the optimal intensity level necessary for reduction of CVD risk. Measures of fitness can provide information on average levels of activity but is the relationship of physical activity and CVD related more to intensity of activity? Do periods of maximal activity have to be performed on a regular basis or can moderate levels of exercise suffice? Accelerometry assists with the measurement of physical activity during “free living” with recordings of total activity, intensity and duration of bouts available for extended time periods. Not much research exists on the use of accelerometry to determine CV risk. Would it be possible to use CRP and accelerometry to determine amount and intensity of PA to provide protection from CV events? Both accelerometers and VT measurements can provide assessment of overall activity regardless of method of accumulation. Can these methods be 51
used in combination to better quantify total daily physical activity or energy expenditure? Can these measurements be utilized in populations with physical disability?
52
CHAPTER 2 RESEARCH QUESTIONS
Main Question How is physical activity related to systemic inflammation and the risk factors of CVD? Study I: Intervention study of healthy, sedentary adults By changing the activity levels of a sample of sedentary individuals, can systemic inflammation and the risk factors of CVD be lowered? Is one method of promoting walking for health better than another and can physical activity be increased in the sedentary? Study II: Observation of a population cross section of healthy adults What is the relationship of systemic inflammation and the CVD risk factors to physical activity as measured by activity counts in a cross section of the population? Study III: Special Populations - survivors of stroke How does a sample of the population three months or more after stroke compare to age and gender matched sedentary controls in the risk factors of heart disease? How do daily activity levels of the above populations differ?
53
CHAPTER 3 INCREASING PHYSICAL ACTIVITY AND REDUCING CARDIOVASCULAR RISK USING METHODS OF ACCUMULATING PHYSICAL ACTIVITY
Abstract Purposes: To determine effects of two activity accumulation methods on increasing physical activity. To determine the effect of resultant physical activity increases on expression of CVD risk factors and inflammation. Methods: Fourteen volunteers ages 31-66 participated in a 10-week intervention. Participants were assigned to group by availability. Groups were randomized to 10,000 steps or Active Living, Everyday.® Pre/post-intervention testing included BMI, waist girth, blood pressure, C-reactive protein (CRP), fitness, cholesterol, and blood glucose. Results: Both activity accumulation groups significantly increased number of steps (p < 0.05) during the intervention period. No between group differences were found in step count, CRP or CVD risk factors. Within groups, significant changes in number of steps (95% CI: 4,126 to 1,179 steps per day), estimated VO2max (95% CI: 5.22 to 1.18 ml/kg/min), waist circumference (95% CI: 6.71 to 0.60 cm) and hemoglobin A1c (95% CI: -0.01 to -0.09 percent) were observed. No significant changes were noted in CRP, blood pressure or cholesterol. Conclusions: Both programs were equally effective in increasing physical activity over 10 weeks. Increases in physical activity resulted in improved fitness and blood glucose but were not sufficient to provide changes in multiple heart disease risk factors or inflammation. 54
Introduction Cardiovascular disease (CVD) is the number one cause of death in the United States and its incidence continues to rise.2, 204 Inflammation is related to CVD and inflammatory markers have been suggested as indicators of cardiovascular events such as stroke or heart attack.80 Physical inactivity has been determined to be one of the primary risk factors for cardiovascular disease. It is well known that there is an inverse relationship between physical activity and cardiovascular disease. Routine physical activity decreases CVD4, 45 and its risk factors5-9 and improves health.2 From the 1996 Surgeon General’s report it was estimated that in the United States, more than 60% of adults are not regularly physically active and 25% are not active at all.2 Current physical activity recommendations from the Centers for Disease Control (CDC) and the American College of Sports Medicine (ACSM) are to accumulate 30 minutes of moderate level activity most if not all days of the week with moderate level activity defined as the equivalent of a brisk walk.56 Although it is clear that increased physical activity is associated with improved health, the debate continues about the specifics of optimal physical activity recommendations.205 There are many methods for an individual to increase their physical activity from participation in competitive sports to a basic walking program. Planned, structured physical activity (exercise) has been proven effective at improving physical activity, fitness and health, unfortunately only small numbers of Americans routinely engage in this type of physical activity and dropout rates 55
are high.206 Because scheduling physical activity into a busy day is often difficult, there is a need for alternatives to structured exercise to increase physical activity.207 Rather than performing one 30 minute bout of continuous structured physical activity, an alternative method of attaining the CDC/ACSM guidelines is through the accumulation of physical activity. It has been suggested that the accumulation of physical activity in multiple shorter bouts can provide comparable increases in fitness as one continuous bout of similar total duration.208 There are also programs that may allow the accumulation of physical activity without any structured bouts of exercise. By incorporating physical activity into one’s normal daily activities, one may eliminate the need for scheduling physical activity sessions to achieve activity goals. This approach may increase program participation and lower dropout rates. Active Living Everyday® (ALED) and 10,000 steps are two examples of programs that encourage activity accumulation. In these programs, physical activity accumulation is promoted primarily through walking activities. Walking is a viable option for most individuals and can be performed at minimal to no cost. Several studies have examined the 10,000 steps per day target as a method of meeting the current national physical activity guidelines.209-212 Other studies have investigated the effect of lifestyle behavior change interventions similar to ALED on increasing activity.213-215 Participants who exceed 10,000 steps are more likely to meet the current physical activity guidelines,216 but more 56
research is necessary to examine the effectiveness of these programs on increasing physical activity. There have been many studies that have examined the relationship between individual CVD risk factors and physical activity however, most have used physical activity questionnaires to gauge physical activity accumulation. Physical activity questionnaires are subjective and can have errors up to 50 percent.10, 11 The pedometer is a low cost, unobtrusive and easy to use alternative to the questionnaire that provides objective monitoring of daily activity levels.132, 134 Some health promotion programs, such as 10,000 steps and ALED, encourage the use of pedometers to provide both feedback and goal-oriented motivation to increase physical activity. There have been some studies on the associations of pedometer-measured physical activity with some of the established CVD risk factors,205, 206, 217-220 however, there are few studies on the relationship between accumulated physical activity and multiple modifiable CVD risk factors.206, 218 Furthermore, although inflammatory markers such as C-reactive protein have been examined in epidemiological studies and in studies of athletes,112, 116118
no studies are known to these authors that have examined the effects of
accumulated moderate level physical activity on C-reactive protein levels. It is unclear if the intensity and duration of physical activity recommended in these programs is sufficient to lower markers of systemic inflammation and the risk factors of heart disease. If activity accumulation programs do result in increased
57
activity levels, how is this increase in physical activity related to measures of CVD risk? The purpose of this study was twofold. 1. To determine the effects of two methods of activity accumulation on increasing physical activity levels in those not currently meeting physical activity guidelines. 2. To determine the effect of the resultant increase in physical activity on the expression of CVD risk factors and inflammatory markers. We hypothesize that both intervention methods will be equally as effective in initiation of physical activity and that the resultant increase in physical activity will have an effect on some, but not all, of the CVD risk factors. Methods Informed written consent was obtained from all participants. All procedures were approved by The University of Montana Institutional Review Board for Use of Human Participants and conformed to the Declaration of Helsinki. Eighteen subjects were initially recruited. Fourteen volunteers, 2 males and 12 females, ages 31 - 66 completed the study. The sample of convenience was obtained through flyers posted on a university campus and through the employee well-check flyer. All participants were tested on the same day and fasted for 12 hours before scheduled testing time. As participants arrived, they were asked to complete a consent form and a medical history questionnaire as well as a PAR-Q 221 to determine if participation criteria were met. The criterion for physical activity was not meeting the daily recommendation of 30 minutes of moderate activity. Exclusion criteria included 58
individuals taking medications that would influence heart rate, blood pressure, blood glucose or cholesterol, recent infection or surgery within the previous 3 months, previous heart disease or myocardial infarction. Using standard techniques, resting blood pressure was taken in the seated position with a mercury sphygmomanometer.222 Waist girth,223 resting heart rate, weight and height were also measured. Blood samples were collected in the morning after fasting for at least 12 hours before scheduled testing time. Two 12 ml vials of venous blood were analyzed at a hospital laboratory for total cholesterol (TC), low density lipoprotein cholesterol (LDL), high density lipoprotein cholesterol (HDL), blood glucose (HbA1c) and the inflammatory marker C-reactive protein (hs-CRP). Samples were analyzed for HbA1c, hs-CRP and lipids enzymatically using an automated clinical chemistry analyzer (RocheHitachi P-module, Indianapolis, IN) with estimation calculation of LDL cholesterol using the Friedewald equation.79 Fitness level was measured by the Reebok 1-mile walk test.223 The participants were instructed to walk one mile as fast as possible around a premeasured 1/3 mile oval track. The elapsed time for the test was recorded and heart rate was measured immediately after completing the 1 mile walk. Estimated VO2max was calculated using the Reebok walk test prediction equation.223 At the completion of the testing, participants were issued a digital pedometer (Walk for Life, Plainfield, IL) and instructed to wear it on the waistband of their clothes every day whenever out of bed except when bathing.
59
Participants wore the pedometer for 5 to 7 days prior to the first intervention meeting to determine baseline physical activity. Although intervention type was randomly assigned to the 2 groups, participants were placed into groups of convenience according to group meeting time. Equal numbers of males and females were assigned to each group. Group 1 participated in an educational lifestyle behavior change program, ALED,224 in which physical activity was encouraged throughout the day. Group 2, 10,000 steps, was a goal-oriented walking group encouraged to attain 10,000 steps daily. Both groups met weekly for one hour to standardize contact time. Intervention The intervention phase consisted of each group meeting one hour per week for a total of 10 weeks. All participants were asked not to change their dietary behaviors during the study period. Each week, attendance was taken and the investigators recorded the pedometer data for each participant in both groups. During these meetings, group 1 attended an ALED class promoting lifestyle behavioral change. Active Living Everyday® is an educational program that uses social cognitive theory and the transtheoretical model (stages of change) to encourage behavior change towards an active lifestyle.225 This class is offered through Human Kinetics (Champaign, IL) and each of the participants in the group received a workbook and a log to record daily physical activity.224 This program encourages an increase in walking whenever possible throughout the day to accumulate a total of at least 30 minutes of moderate intensity activity. 60
Each module provides education on topics related to increasing activity and readiness for change is assessed periodically throughout the program. See table 1 for examples of topics covered in the ALED course. A group facilitator trained by Human Kinetics worked with participants following the modules in the workbook. These interactive lessons encourage problem solving to introduce techniques and strategies that can be individualized to assist in achieving a more active lifestyle. Some modules were accelerated or combined to tailor the program to the group and because some of the topics such as pedometer use, the one-mile walk and self-monitoring of heart rate were covered during the pretest session. No structured exercise was performed during these group meetings although physical activity was occasionally incorporated to emphasize major points such as learning how to perform a walking test. Group 2 followed the traditional 10,000 steps walking program. The 10,000 steps program is a widely advocated method of increasing physical activity originally created by Yoshiro Hatano (1993) in Japan.209 The goal of this program is to gradually increase the total number of steps taken in one day to 10,000 and to maintain or exceed this level of accumulating 10,000 steps everyday. The only instructions to participants were to increase their walking opportunities whenever possible throughout the day and to gradually increase number of steps until 10,000 steps was reached or exceeded. This group participated in a weekly meeting lasting one hour. During this meeting, attendance was taken, pedometer readings were recorded and a group walking session was offered. No formal instruction occurred during these sessions. The 61
Table 1 Topics Covered in the Active Living, Everyday® Program Intensity and Increasing activity
Goal setting
Stress duration
Time
Balancing
Using
management
calories
pedometers
Previous success
Benefits of
Measuring heart Positive changes
Avoiding pitfalls
activity
rate Stretching
Barriers
Walking test
Problem solving
exercises Support New activities
Lasting changes
Self reward enlistment
Table 1: Topics covered in the educational program that uses social cognitive theory and the transtheoretical model to encourage changes in behavior and an active lifestyle.
62
Table 2 Baseline Descriptive Data ALED
10,000 steps
Age (yrs)
45.71 + 8.65
51.29 + 7.74
Height (m)
65.14 + 2.13
66.25 + 3.76
Weight (kg)
76.10 + 17.88
79.89 + 8.95
Daily Step Count
6,788 + 2,492
6,591 + 1,884
BMI (kg/m2)
27.54 + 5.34
28.22 + 3.81
Waist girth (cm)
82.86 + 13.87
84.31 + 9.95
SBP (mmHg)
111.14 + 18.07
114.67 + 12.37
DBP (mmHg)
76.00 + 8.08
78.50 + 9.46
Baseline descriptive data for accumulated activity groups Active Living, Everyday® and 10,000 steps groups. Yrs = years, m= meters, kg = kilograms. BMI = body mass index, cm = centimeters, SBP = systolic blood pressure, mmHg = millimeters of mercury, DBP = diastolic blood pressure
63
primary purpose of this meeting was to record pedometer readings and to standardize contact time with participants between the 2 groups. After ten group sessions were completed, all participants were retested in the same manner as the pretesting. Data Analysis T-tests were performed to analyze differences between groups in age and attendance. Repeated measures analysis of variance was used to assess differences over time between the ALED and 10,000 steps intervention groups for the following dependent variables: cholesterol (TC, HDL, LDL), HbA1c, blood pressure, CRP, BMI, waist girth, steps per day, and estimated VO2max. Significance levels were set at p < 0.05. Results Initial enrollment in the study was 18 however one participant underwent shoulder surgery, two were unable to attend the post testing and one withdrew due to personal issues. Two males and 12 females, 1 male and 6 females in each group, completed the 10-week intervention. Descriptive variables are listed in table 2. There were no significant differences between the groups. Average age of subjects was 48.5 + 9.2 years. Baseline step counts were 6,591 + 1,884 steps for the 10,000 steps group and 6,788 + 2,492 steps for the ALED group. Average weekly step counts for each group are depicted in figure 2. Both groups significantly increased their step count with 10,000 steps increasing to as high as 10,334 + 2,037 steps per day and ALED increasing to as high as 9,943 + 2,308 steps per day during the intervention period. The mean step count at the end of 64
Figure 2
Average Steps per Week by Group
Average Step Count
10000
8000
6000 Baseline
Week 2
Week 4
Week 6
10,000 Steps
Week 8
Week 10
ALED
Figure 2: Changes in the average number of steps per day by group as measured by pedometer over the ten week intervention period. ALED = Active Living, Everyday.®
65
the 10 weeks was 9,892 + 3,690 for 10,000 steps and 9,056 + 2,348 for the ALED group. Weekly meeting attendance was significantly less in the walking group than the ALED group (p < 0.05 level) with attendance averaging 54.3% for 10,000 steps and 72.5% for ALED. There were no differences between groups found for any of the dependent variables of interest (step count, CVD risk factors or CRP). Because none of these dependent variables significantly differed between the ALED and 10,000 steps treatment groups, the results for all participants were combined and analyzed together as one group. Results for all subjects are listed in table 3. There were significant changes in number of steps (95% confidence interval: 4,126 to 1,179 steps per day). Significant changes were also observed in estimated VO2max (95% confidence interval: 5.22 to 1.18 ml/kg/min), waist circumference (95% confidence interval: 6.71 to 0.60 cm) and hemoglobin A1c (95% confidence interval: -0.01 to -0.09 percent). Physical activity increased by 2,704 steps or 43%, from a baseline of 6,690 + 2,125 to an average of 9,542 + 2,922 steps per day. By the end of the 10 weeks, 4 participants (29%) exceeded 10,000 steps and 83% of participants increased physical activity levels. Increases in VO2max were 3.2 ml/kg/min or 11% and decreases in HbA1c was from 5.19 to 5.14 or 1% over the 10 week period. There were no significant changes in BMI, CRP, blood pressure or cholesterol levels.
66
Table 3
Results: All Subjects Baseline
10 weeks
Daily Step Count
6,690.00 + 2,125
9,541.99 + 2,922*
BMI (kg/m2)
28.58 + 4.97
28.42 + 4.57
Waist girth (cm)
85.17 + 13.29
88.82 + 10.66*
SBP (mmHg)
116.29 + 19.64
117.14 + 16.78
DBP (mmHg)
77.36 + 8.167
77.57 + 9.52
est VO2max (ml/kg/min)
29.00 + 9.61
32.20 + 10.01*
HbA1c (%)
5.19 + 0.15
5.14 + 0.15*
Total Cholesterol (mg/dl)
206.50 + 33.80
205.21 + 36.59
Triglycerides (mg/dl)
144.50 + 108.20
137.43 + 76.21
HDL (mg/dl)
61.71 + 16.14
62.71 + 14.90
LDL (mg/dl)
118.29 + 29.12
115.00 + 28.40
CRP (mg/dl)
0.21+ 0.18
0.20 + 0.15
Table 3: Dependent variable results of pre- and post-testing for all subjects. * indicates statistically significant differences at p = 0.05. BMI = body mass index, kg = kilograms m2 = meters squared. cm = centimeters, SBP = systolic blood pressure, DBP = diastolic blood pressure, mmHg = millimeters of mercury, est VO2max = estimated maximum volume of oxygen consumed, HbA1c = glycosylated hemoglobin, mg = milligrams, dl = deciliter, HDL = high density lipoprotein cholesterol, LDL = low density lipoprotein cholesterol, CRP = Creactive protein.
67
Discussion Because of the low adherence levels to structured exercise programs,207 it is important to find alternate means of increasing physical activity in the general population. When activity can be incorporated into daily routine, it becomes more appealing and less intimidating.226 Adherence to activity programs has improved when activity accumulation methods have been utilized.227, 228 Both the ALED and 10,000 steps programs promote the integration of activity into daily living and in this study resulted in similar outcomes after 10 weeks of intervention. Our results support the findings of previous research. Both the ALED and 10,000 steps groups were effective in increasing physical activity, as measured by average daily step count, with neither method more effective than the other. By incorporating a gradual, moderate approach to increasing physical activity into daily routine, daily energy expenditure215 and fitness227, 228 have been increased. In the current study, attained increases in physical activity, as measured by step count, resulted in increased physical fitness as measured by estimated VO2max. In addition, 29% of our subjects, two from each group, exceeded 10,000 steps by the end of the 10 weeks. These results are similar to previous research. In a study of Japanese workers, 42% of participants exceeded the 10,000 steps for 4 weeks but only 11% exceeded for 12 weeks.219 When the participants were grouped together in the current study, baseline step counts were 6,690 + 2,125. In a study of people with type 2 diabetes mellitus by Ariaza et al., baseline data was similar to the current study 68
with the control group baseline at 6,239 ± 2,985 and the active group baseline at 7,220 ± 2,792 steps per day. Baseline counts in other pedometer studies ranged from a low of 4,491 up to a high of 5,753 steps per day.205, 206, 217, 219 With the exception of the Ariaza study, other activity accumulation studies began with participants who were less active than those in the current study.218 Resultant physical activity after 10 weeks was similar to 2 other participant groups. The final step count of 9,542 steps attained in the current study were comparable to the steps attained in a 12 week study by Tudor-Locke et al.217 of 9,123 steps and in an 8 week study by Swartz et al.206 of 9,213 steps. Changes in activity in these studies were 3,737 steps or 37% and 4,722 steps or 51% respectively. Physical activity increased by 43% in the current study. Other studies using 10,000 steps as a goal resulted in higher daily step counts. Hultquist et al. recorded step counts of 10,410 and Ariaza et al. observed increases to 10,159 steps. Hultquist et al. recorded an increase of 4,807 or 46% in a 4 week observation,205 and Ariaza et al. observed an increase of 2,939 steps or 29% in 6 weeks.218 The studies by Swartz et al. and Hulquist et al. resulted in the greatest increases in physical activity. In the current study, significant changes in CVD risk factors were observed in glycosylated hemoglobin as measured by HbA1c and fitness level as measured by estimated VO2max. No significant changes in blood cholesterol levels or blood pressure were observed. A reduction in average blood glucose levels occurred in the current study by increasing step counts by as little as 2,704 steps per day over 10 weeks. However, significant decreases in other CVD risk 69
factors such as blood pressure or cholesterol did not occur (see table 3). Other studies that have assessed the effect of the 10,000 steps program on CVD risk factors have had both similar and conflicting results.205, 206, 219 In studies of activity accumulation, the most commonly utilized blood glucose measurements have been fasting blood glucose and HbA1c. Glucose tolerance tests also provide valuable information on impaired glucose metabolism. Levels of HbA1c dropped 1%, from 5.19 to 5.14 in our study. This is a clinically significant change and comparable to other intervention studies of sedentary participants where education on physical activity was provided and activity increases were voluntary. In these studies, levels of HbA1c decreased by 0.8, and 0.6%.229-231 When examining other studies that used the 10,000 steps intervention, no change in HbA1c was observed after interventions of 6 and 12 weeks in length.218, 219 In a 10,000 steps study, Swartz et al. monitored blood sugar levels with fasting blood glucose and 2-hour glucose tolerance rather than HbA1c. In this 8 week study of people with type 2 diabetes, statistically significant improvements were found in 2-hour glucose tolerance but not in fasting blood glucose.206 Other activity accumulation studies did not assess blood glucose.205, 225
The 1% decrease in average blood glucose levels we observed is a positive
change towards lowering CVD risk. In the current study, increases in VO2max and waist circumference were observed however no significant changes were found in BMI. Increases in VO2max were 3.2 ml/kg/min in the current study. This finding is consistent with a meta-analysis of walking interventions in which significant increases in VO2max 70
of 3.6 + 0.5 ml/kg/min were obtained without statistically significant changes occurring in either BMI or percent body fat.232 Our findings are in agreement with previous studies using activity accumulation where despite improvements in physical activity and/or fitness, no improvements in obesity measures were observed.205, 206, 218, 219 Accumulation of activity over time may be sufficient to produce changes in fitness but not decreases in BMI or other CVD risk factors. As in our study, no improvements in LDL cholesterol or HDL cholesterol, BMI or weight were seen in the previously mentioned activity accumulation studies. As stated in our hypothesis, we did not expect changes in all of the CVD risk factors. To obtain greater improvements in CVD risk factors, higher intensity activity may be necessary than that needed for improvement in fitness.223 Higher intensity aerobic dance, compared with low-intensity walking was more effective in improving CVD risk factors.233 In general, stronger associations of CVD risk factors have been found with higher intensity activities.234 One of the factors that may result in the greatest changes in CVD risk factors is weight loss because obesity is linked to many of the CVD risk factors.235 Even modest weight loss has resulted in decreased fat mass, blood pressure, blood glucose, low-density lipoprotein, and triglyceride levels.236 Weight loss can be achieved by increasing physical activity or decreasing dietary intake. Improving both physical activity and diet may provide the greatest weight loss. Despite the benefit of changing both diet and physical activity, we wanted to focus on the effects of physical activity on CVD risk factors. Therefore, we 71
controlled for dietary influences by asking participants to maintain their dietary habits. The activity accumulation programs used in the current study did not result in weight loss. It is likely that either dietary changes or a greater physical activity intensity level is necessary for weight decreases to occur. The effects of activity accumulation on changes in blood pressure have also been varied. Our study is consistent with 2 other studies in that blood pressures did not significantly change from initial measurements.218, 219 The mean systolic blood pressure in our study was 116.3 + 19.6 mmHg and the mean diastolic blood pressure was 77.4 + 8.2 mmHg. Two other studies using 10,000 steps interventions, Hulquist et al. and Swartz et al., observed significant decreases in blood pressure.205, 206 Changes in physical activity (as measured by change in step counts of 4,722 and 4,807 steps) were greater in these 2 studies than the other activity accumulation studies. In comparison, the increase in step count in the current study was 2,704 and in the Ariaza et al. study was 2,939 steps. It may be that greater changes in physical activity may be necessary to affect changes in blood pressure. The systemic inflammatory marker C-reactive protein (CRP) has been suggested as an indicator of CVD risk. In general, there appears to be an inverse relationship between physical activity and CRP levels.47, 104, 107 However, CRP has not yet been established as a predictor of CVD events in the general population. Some researchers have noted decreases in levels of CRP in athletes with regular training48, 99 but the results have not been consistent across sports.108, 120 We did not observe any significant changes in CRP levels after the 72
10-week intervention in our sample of the population. The baseline values we observed were similar to that of other research,48, 99, 108, 120 however, we observed a high variation within and among participants. Within subject variation of CRP is 4 to 6 x greater than that of cholesterol.100 Baseline levels of CRP are known to fluctuate up to 60% and this variation of CRP makes it difficult to use in all but epidemiological studies with large numbers.100 Accumulated physical activity can provide increases in fitness and physical activity. Programs such as 10,000 steps and ALED provide alternatives that are less intimidating to those who have not previously exercised. This approach to physical activity may allow for improvement in success rates and decreases in drop-out rates that are so apparent in structured activity programs. Because physical activity can be incorporated into a busy day, accumulation programs may increase adherence and provide opportunities for successfully increasing physical activity. The focus of these activity accumulation programs is to increase opportunities for physical activity and provide a vehicle for participants to increase total activity. This is an important step, to promote lifestyle changes and begin the journey towards being physically active. However, it may be necessary to provide additional guidance on activity parameters, particularly intensity. Positive changes in some CVD risk factors occurred with accumulated walking programs after 10 weeks in the current study and after 4 – 12 weeks in other similar studies.205, 206, 219 Effecting decreases in other CVD risk factors may require a minimal intensity or higher activity accumulation. Researchers suggest 73
that the total amount of moderate level physical activity accumulated, regardless of accumulation method, is important for health benefits.237 Participants who accumulated 10,000 steps per day were more likely to meet the current physical activity guidelines but accumulation of 10,000 steps did not guarantee success.216 The challenge of using activity accumulation programs to increase physical activity is that activity intensity is generally not emphasized. Hatano (1993) stressed the importance of walking intensity at a “fairly fast pace” in his 10,000 steps program.209 However, emphasis on intensity of physical activity has been lost in the public promotion of this program within the United States. Intensity is an important component for reduction of CVD risk. To more effectively reduce multiple CVD risk factors, accumulated activity programs may need to incorporate a focus on incremental increases in activity intensity as well as activity accumulation.
74
CHAPTER 4 EXPLORING THE RELATIONSHIP BETWEEN CARDIOVASCULAR DISEASE RISK AND PHYSICAL ACTIVITY AS MEASURED BY ACCELEROMETERS
Abstract Purpose: The purpose of this study was to explore the inverse relationship between global CV risk scores and PA. A secondary purpose was to determine the PA intensity and duration best associated with reduced CV risk. Cardiovascular disease (CVD) accounts for 37.1 percent of all deaths in the United States.238 Many of these deaths are preventable with reduction in sedentary behaviors. Using individual independent risk factors for CVD, global CV risk scores like the Framingham have been developed to predict individual CVD risk. Although sedentary lifestyle has been identified as 1 of the 8 known risk factors for CVD, no known global risk scores include measures of physical inactivity. The exclusion of physical inactivity in CV risk scores is attributed to the difficulty in reliably quantifying physical activity (PA) levels of individuals. There is a need to better quantify habitual PA and to include PA in global risk assessment. Methods: Forty five males and 65 females completed this study. Weight, height, resting blood pressure, waist girth and skinfold measurements were taken. Body mass index (BMI) was calculated. An accelerometer was worn on the right hip for 7 full days including a weekend period. A blood sample was analyzed for total cholesterol (TC), low density lipoprotein cholesterol (LDL), high density lipoprotein cholesterol (HDL), triglycerides, and glycosylated hemoglobin 75
(HbA1c). Based on established values for each gender, absolute risk ranks were developed for systolic and diastolic blood pressure, total cholesterol, HDL cholesterol and LDL cholesterol, percent body fat and waist girth, and glycosylated hemoglobin (HbA1c). To obtain global CV risk ranks, absolute risk ranks were summated for each individual. Habitual PA was examined using multiple methods. Activity was divided into sedentary, light, moderate and vigorous levels to examine intensity. To consider duration, time spent in each category was examined. To further explore intensity, individual minutes of highest intensity achieved for each day were examined for durations of 5 minutes (hct5) up to 120 minutes (hct120) in 5 to 15 minute increments. Total activity and average counts per minute per day were also determined. T-tests analyses were used to determine differences between genders and one-way ANOVAs were used to evaluate age group differences for minutes of activity at various intensity levels. Pearson correlations between CV risk scores and PA patterns were calculated. The 2 PA methods with highest correlations to CV risk scores were then used in a multiple regression analysis with age and by gender to develop prediction scores for CV risk. Statistical significance was set at p < 0.05. Results: Of the participants in our study, 67% met or exceeded the recommended minimal PA guidelines of 30 minutes of moderate PA 5 of 7 days per week and 45% met these guidelines 6 of 7 days per week. Overall, participants spent 73% of time in sedentary activities, 19.6% in light activity, 5.5% in moderate activity and 1.8% in vigorous activity. The best fit regression line of CV risk score for men was with total daily activity and age (r = - 0.53, standard error of the estimate (SEE) = 76
0.58). For women, hct30 and age had the best fit (r = -0.44, SEE = 0.50). When analyzed by age group, the best fit line for group 1 (ages 18-24) was with hct5, r = -0.45, SEE = 0.40 and the best fit line for group 2 (ages 25-44) was with total counts, r = - 0.41 and the SEE = 0.71. No significant regression line was found for Group 3 (ages 45-65) but total counts provided the best fit line at r = -0.33, SEE =0.53, p = 0.06. Conclusion: Total daily activity and total time in moderate activity were inversely related to CVD risk. However, reaching higher intensity levels for 1 minute periods accumulated for at least 5 minutes a day appears to be better related to lower risk of CVD than longer durations of moderate or vigorous activity per day, particularly at younger ages.
77
Introduction Physical activity (PA) has long been associated with health benefits.2 As early as 1979, the Framingham study identified physical inactivity to be related to cardiovascular disease (CVD) mortality and morbidity.239 In 1992, physical inactivity was recognized as a fourth major risk factor for coronary heart disease by the American Heart Association.240 There are currently a total of 8 risk factors for CVD. They include age, family history, smoking, hypertension, dyslipidemia, physical inactivity, diabetes and obesity.2 From these individual independent risk factors, equations have been developed to determine overall or global CV risk scores (eg. Framingham, Modified Sheffield, New Zealand, Joint British Recommendations). The Framingham risk equation is the “gold standard” and includes gender, total cholesterol, high density lipoprotein cholesterol (HDL), blood pressure, age, and smoking in the calculations.241 The original Framingham equation also included left ventricular hypertrophy.242 Other risk estimates such as the modified Sheffield, the Joint British and New Zealand add diabetes to improve on sensitivity and specificity. Unfortunately, none of these global risk equations include physical inactivity. The exclusion of physical inactivity in CV risk scores is attributed to the difficulty in reliably quantifying PA levels of individuals. Habitual PA has been difficult to measure without high cost or imposition upon free living. The two standards for PA measurement that have been most practical for large scale studies have been self-report and cardiorespiratory fitness (fitness).124, 243 Discrepancies regarding intensity level are common when 78
using self reported activities, with estimated error ranging from 35 to 50 percent depending on individual recall and perception of activities.10, 11 Large cohort studies have found fitness, as measured by VO2max, to be inversely related to all-cause and CVD mortality.128, 130 However, fitness testing provides information about maximal exercise capacity without details regarding habitual activity patterns. There is a need to better quantify habitual PA and to improve our understanding of the relationship between PA and CVD. Technological advances have allowed for objective measurement of habitual PA through the use of accelerometers. Accelerometers are motion sensors that provide a description of free-living PA in real time including intensity, duration and frequency. These devices can record and store data for extended periods of time. There have been several studies using accelerometers individually relating the single risk factors of obesity,244-246 cholesterol140 and blood pressure247 to habitual PA. The majority of this bivariate research has analyzed PA using total activity counts. There exist no studies known to this author that relate a global CV risk score to PA. The purpose of this study was to explore the inverse relationship between global CV risk scores and PA. A secondary purpose was to determine the PA intensity and duration best associated with reduced CV risk. Methods Eligible participants were apparently healthy males and females between 18 and 65 years old. Individuals taking medications that would influence heart rate, blood pressure, blood sugar or cholesterol, with recent infection or surgery 79
within the previous 3 months, or those with previous heart disease or myocardial infarction were excluded from the study. Informed written consent was obtained from all subjects with all procedures approved by the Institutional Review Board at The University of Montana. A sample of convenience was obtained primarily through word of mouth from the local area population. An attempt was made to obtain a fair representation of young (18-24), middle (25-44) and older (45-65) age ranges, both male and female genders and both active (fit) and sedentary (unfit) individuals. One hundred forty subjects (65 males, 75 females) volunteered for this study, completed a fasted blood draw, performed exercise testing and wore an accelerometer for a week. Complete data were present for 110 subjects (45 males, 65 females) who were used for this analysis. When participants arrived for their testing session, they were asked to complete a consent form, a medical history questionnaire and a PAR-Q221 to determine if participation criteria were met. After sitting quietly for 5 minutes, resting heart rate was observed and resting blood pressures were taken using the procedures recommended by the American Heart Association.222 Weight and height were measured and recorded and from these measurements body mass index (BMI) was calculated.223 Waist girth and skinfold measurements were taken per American College of Sports Medicine (ACSM) recommended protocols.223 Using the gender specific three-site protocol, skinfold measures were converted into percent body fat using the ACSM recommended JacksonPollock equations.223 80
At the completion of the above testing, participants were fitted with an Actical accelerometer (Minimiter, Bend, Oregon). The Actical activity monitors are small (2.8 x 2.7 x 1.0 cm3), lightweight (17g) units that have a primary plane of detection but are sensitive to all three planes of motion. The Actical is a piezoelectric accelerometer with a range of 0.5 to 2G and frequency of 0.35 to 3.5 Hz. The Actical samples acceleration at a rate of 32 Hz and integrates this over the user-defined epoch.248 In this study, the epoch was set at 1 minute, comprising a total of 1440 measurements for each day. The accelerometer was worn on the right hip for 7 full days including a weekend period. Participants were asked to wear it every day whenever out of bed except when bathing. Log sheets were provided to record any activities such as motorcycle riding or snowmobiling that might overestimate activity and any times where they neglected to wear the device. Previous research has shown that in adults, a minimum of 3 to 5 days of monitoring is optimal to determine activity patterns.140, 142 Monitoring for 7 days was chosen to ensure inclusion of both weekday and weekend as conflicting evidence exists regarding differences between weekday and weekend habitual activity patterns.140, 249 Placing a single device on the hip or lower back is recommended by Trost et al. in a review of accelerometer studies.142 A blood sample was collected from the participants within 2 weeks of the testing session detailed above. Participants were asked to fast for 12 hours prior to blood sample collection. Two 12ml vials of venous blood were drawn and analyzed at a hospital laboratory for lipids [total cholesterol (TC), low density lipoprotein cholesterol (LDL), high density lipoprotein cholesterol (HDL), 81
triglycerides], and glycosylated hemoglobin (HbA1c) to measure average blood glucose. Samples were analyzed for HbA1c and lipids enzymatically using an automated clinical chemistry analyzer (Roche-Hitachi P-module, Indianapolis, IN) with estimation calculation of LDL cholesterol using the Friedewald equation.79 Data Analysis When activity monitors were returned, the data were downloaded into a computer data file. Using the activity log sheets completed by the participant, data for time periods that might overestimate activity such as snowmobile riding or driving a truck on a dirt or bumpy road were eliminated. Also, all Actical files were screened for periods of zero activity. If the Actical was not worn, per report on the activity log sheet, this data was removed from the analysis. Cardiovascular Disease Risk Calculation Our primary objective was to investigate whether the clustering of risk factors was related to habitual PA in a population sample of adults aged 18-65. To compute CV risk ranks, an absolute rank was developed based on established values for each gender for systolic and diastolic blood pressure,250 total cholesterol, HDL cholesterol and LDL cholesterol,251 percent body fat252 and waist girth,253, 254 and glycosylated hemoglobin (HbA1c).254 The values used are listed in table 4. For risk factors directly related to CVD such as systolic blood pressure, ranks were calculated as the recorded value divided by 130, the established cutoff value for hypertension. A person with systolic blood pressure of 120 would receive a rank of 120/130 or 0.92 while someone at 140 would receive a score of 140/130 or 1.08. For risk factors indirectly related to CVD such 82
as HDL, for a male with an HDL score of 50, absolute risk was calculated as 1(50/40) or -0.25. Once ranks were calculated for all individual risk factors, these ranks were summated to obtain an absolute global risk rank for each individual. Several different global risk equations were explored based on the measured CV risk factors and are listed in table 5. For the purpose of this study, global risk equations were selected that incorporated a majority of the modifiable risk factors. Smoking was not included in the CV risk score calculations because so few smokers volunteered for the study. Absolute risk A was calculated by summation of the absolute ranks of 7 factors: average blood glucose (HbA1c), systolic and diastolic blood pressure, LDL cholesterol, HDL cholesterol, waist girth, and body fat. Absolute risk B substitutes total cholesterol for LDL cholesterol and Absolute risk C, a non-obesity CV risk score, omits the waist girth and body fat absolute risk scores from the calculations. Patterns of Activity A purpose of this study was to examine various parameters of PA which might be best related to global risk for CVD. To evaluate this question, multiple methods of looking at daily PA were produced from the raw accelerometer data. Prior accelerometer studies have used total activity counts and duration of moderate and vigorous activity to investigate PA patterns.140, 249 Since previous studies suggest a minimum of 3-5 days to provide an accurate representation of habitual physical activity,140, 142 at least 5 days of accelerometer data were 83
Table 4 Established Risk Values By Gender Males
Females
Percent Fat
25%
30%
Systolic Blood Pressure
130 mmHg
130 mmHg
Diastolic Blood Pressure
85 mmHg
85 mmHg
LDL
130 mg/dl
130 mg/dl
HDL
40 mg/dl
50 mg/dl
Total Cholesterol
200 mg/dl
200 mg/dl
Waist girth
101.6 cm
88.9 cm
HbA1c
7%
7%
Table 4: Established values indicating increased risk for each of the measured parameters separated by gender. % = percent, mmHg= pressure in millimeters of mercury, LDL = Low density lipoprotein, HDL = high density lipoprotein, mg = milligrams, dL= deciliter, cm = centimeter.
84
Table 5
85
required to qualify for analysis in the current study. In order to examine PA parameters, total counts per day (TAC) and average counts per minute per day were determined first. Next, to examine intensity, activity was divided into sedentary, light, moderate and vigorous. To examine duration, time spent in each category was considered. Minute-by-minute PA counts were separated into these categories according to their estimated PA energy expenditure expressed in metabolic equivalents or METs and were defined from previous research of Heil.255 Sedentary was considered activities of less than 1 MET (0-99 cts/min). Light activities included activities of 1.1-2.9 METs (100-1500 cts/min). Moderate activities required activities of 3-6 METs (1500-6500 cts/min) and activities that were greater than 6 METs were considered vigorous (greater than 6500 cts/min).56 Once the intensity levels were calculated, multiple methods of viewing activity were developed including average non sedentary counts, total counts in each category, counts per minute in each category, and duration in single minutes per day at various intensity levels. Since the current PA recommendations are for accumulation of activity in bouts of 5 minutes or more,2 analysis included average counts and total time in moderate (Tmod) and vigorous (Tvig) activity accumulated in 5 minute bouts or greater. To further explore the effect of intensity, the individual minutes of highest intensity achieved for each day were located. Then the highest counts per minute achieved for durations of 5 minutes (hct5) up to 120 minutes (hct 120) in 5 to 15 minute increments were observed. Again, these were the single minutes of highest 86
intensity or the minutes which had the highest number of counts per minute. Activity was analyzed as an average for all days and then further analyzed as average weekends and weekdays separately because previous research had suggested that there may be differences in activity patterns during the week and on weekends.140, 249 Statistics Means and standard deviations of descriptive variable and each risk factor were calculated within each age group. T-tests analyses were used to determine gender differences and one-way ANOVAs were used to evaluate age group differences for minutes of activity at various intensity levels. T-tests were also performed to examine differences in activity patterns between weekend and weekday activity. Variables used for the weekend – weekday analysis were time spent in each intensity level (sedentary, light, moderate and vigorous) overall and by age group. A p value of less than 0.05 was considered to be statistically significant. Pearson correlations between the global CV risk scores and PA patterns were calculated to determine which CV risk score had the highest correlations to PA. The 2 PA methods with highest correlations to CV risk scores were then used in a multiple regression analysis with age and by gender to develop prediction scores for CV risk. Correlations of PA methods with CV risk were also performed by gender for each of the three age categories. SPSS 12.0 (SPSS, Inc., Chicago, Illinois) was used for all data analyses. To adjust for multiple 87
comparisons in the correlational analyses, a p value of less than 0.001 was considered statistically significant. Results Forty five males and 65 females had complete data sets and were used in the data analysis. Age of subjects ranged from 18 to 64 with mean age of 34.6 + 13.8 years. The body mass index (BMI) of subjects ranged from 18.2 to 44.2 kg/m2. Minimum, maximum and means + standard deviations of descriptive variables and individual CV risk factors for each age group are displayed in table 6. Of the participants in our study, 67% met or exceeded 30 minutes of moderate PA 5 of 7 days per week and 45% met these guidelines 6 of the 7 days per week. Sample averages were 73% of time in sedentary activities, 19.6% in light activity, 5.5% in moderate activity and 1.8% in vigorous activity. There was no statistical difference found between weekdays and weekend days in time spent in each intensity category. Time spent in sedentary, light, moderate and vigorous activity for weekends, weekdays and all days are displayed in table 7. When PA was analyzed by gender (table 8), men and women did not significantly differ in amount of sedentary (1061.6 minutes + 90.8 versus 1066.3 + 95.9 minutes), light activity (285.2 + 74.1 minutes versus 294.1 + 76.4 minutes), moderate activity (85.7 minutes + 44.2 men and 70.4 + 41.7 women) and vigorous activity (7.5 minutes + 6.6 men and 9.2 minutes + 10.0 women). Subjects were also analyzed by age category (table 8). Moderate and vigorous activity time was highest in the youngest age group and decreased with 88
Table 6
Height (m)
Weight (kg)
Percent body fat (%)
Systolic BP(mmHg)
Diastolic BP (mmHg) LDL (mg/dl)
HDL (mg/dl)
HbA1c (%)
Waist girth (cm)
Descriptive Statistics By Age Mean
Standard Deviation
Minimum
Maximum
Younger
1.70
0.10
1.48
1.91
Middle
1.70
0.08
1.57
1.90
Older
1.71
0.08
1.58
1.98
Younger
67.83
11.51
48.75
95.20
Middle
77.90
20.52
54.15
140.30
Older
77.78
15.47
45.70
106.80
Younger
19.23
8.17
5.14
40.21
Middle
24.82
9.78
9.44
44.34
Older
29.98
7.70
15.10
41.90
Younger
118.20
7.81
102.00
134.00
Middle
123.12
16.16
91.00
168.00
Older
122.09
12.49
94.00
150.00
Younger
73.59
6.55
58.00
88.00
Middle
79.55
11.84
49.00
118.00
Older
79.73
10.56
59.00
108.00
Younger
88.64
22.57
43.00
154.00
Middle
83.48
28.43
20.00
135.00
Older
103.52
25.11
44.00
161.00
Younger
63.64
17.33
36.00
127.00
Middle
62.39
18.06
33.00
95.00
Older
67.79
16.93
41.00
111.00
Younger
5.04
0.23
4.60
5.50
Middle
5.16
0.24
4.80
5.90
Older
5.14
0.23
4.50
5.60
Younger
81.92
7.80
67.80
112.40
Middle
92.09
17.23
65.25
138.75
Older
94.32
13.11
67.58
112.00
89
Table 6: Descriptive statistics separated into 3 age categories. Younger = 18-24 years old, Middle = 25 – 44, Older = 45 – 65, m = meters, kg = kilograms, % = percent, BP = blood pressure, mmHg = pressure in millimeters of mercury, LDL = low density lipoprotein, mg = milligrams, dL = deciliter, HDL = high density lipoprotein, HbA1c = glycosylated hemoglobin, cm = centimeter.
Table 7 Percent Time in Each Activity Intensity By Day of Week Activity Level
All days
Vigorous
Moderate
Light
Sedentary
Time (min)
8.6
76.7
290.2
1064.3
std dev
9.9
38.1
74.0
93.9
% of day
1%
5%
20%
74%
1%
3%
5%
7%
9.7
80.5
286.3
1063.3
std dev
11.9
42.4
82.4
106.2
% of day
1%
6%
20%
74%
1%
3%
6%
7%
7.9
69.9
299.0
1063.0
std dev
13.2
42.5
96.7
114.9
% of day
1%
5%
21%
74%
std dev %
1%
3%
7%
8%
std dev % Time (min) Weekdays
std dev % Time (min) Weekend days
Table 7: Comparison weekday versus weekend of time and percentage of day spent in each level of activity intensity. min = minutes, std dev = standard deviation, % = percentage.
90
increasing age. Sedentary and light activities were lowest in the youngest age group and increased with increasing age (table 8). Absolute risk A had the highest correlations with total activity counts (TAC) (r =-0.40), time in 5 minute bouts of moderate activity (Tmod) (r = -0.34) and time in 5 minute bouts of vigorous activity (Tvig) (r = -0.35). When observing intensity of PA in individual minutes accumulated for totals of 5 minutes up to 90 minutes (hct5 to hct 90), the highest correlations were found with Absolute risk A at r values ranging from r = -0.40 to r = -0.41 (table 9). Once it was established that absolute risk A had the highest correlations with activity counts, a stepwise regression revealed that hct30 provided the best fit regression line with r = -0.41 and the standard error of the estimate (SEE) at 0.55. When multiple regression analysis of CV risk was performed with both duration component and an intensity component, hct30 and Tmod provided the best fit line with r = - 0.422 and SEE = 0.55. The regression of hct5 and Tmod with CV risk resulted in r = 0.404 and SEE = 0.55. The multiple regression equation that provides a best fit line for CV risk for all subjects is CV risk = 4.298 + 0.006 (age) - 0.00009 (hct30), r = -0.434. When each gender was analyzed separately, the best fit regression line of absolute risk A for men was with total daily activity and age (r = - 0.53, SEE =0.58), [CV risk = 4.84 + 0.0026 (age) – 0.000002 (TDC)]. For women, hct30 and age had the best fit (r = -0.44, SEE = 0.50), [CV risk = 4.115 + 0.0079 (age) 0.000068 (hct30)]. When analyzed by age group, the best fit line for group 1 (ages 18-24) was with hct5, r = -0.45, SEE = 0.40 and the best fit line for group 2 91
Table 8 Percent Time in Each Activity Intensity By Age and Gender Vigorous
Moderate
Light
Sedentary
Sedentary and Light
All
0.6%
5.3%
20.2%
73.9%
94.1%
Younger
0.9%
6.1%
19.3%
73.7%
93.0%
Middle
0.5%
4.7%
20.3%
74.6%
94.9%
Older
0.3%
5.0%
21.3%
73.5%
94.7%
Males
0.5%
6.0%
19.8%
73.7%
93.5%
Females
0.6%
4.9%
20.4%
74.0%
94.5%
Table 8: Comparison by age category and gender of percentage of day spent in each level of activity intensity. % = percentage.
92
Table 9 Correlations of CV Risk Equations with Minutes of Activity Intensity average average average average average average average 5 10 20 30 45 60 90 CV risk minutes minutes minutes minutes minutes minutes minutes equation highest highest highest highest highest highest highest activity activity activity activity activity activity activity A
-0.40
-0.41
-0.41
-0.41
-0.41
-0.41
-0.41
B
-0.33
-0.35
-0.35
-0.35
-0.35
-0.35
-0.35
C
-0.33
-0.35
-0.36
-0.36
-0.36
-0.35
-0.36
Table 9: Correlations of each of the cardiovascular risk equations with multiple levels of physical activity intensity. CV = cardiovascular. All values listed in the table were significant at p < 0.05 level.
93
(ages 25-44) was with total counts, r = - 0.41 and the SEE = 0.71. A significant regression line was not found for Group 3 (ages 45-65) but total counts provided the best fit line at r = -0.33, SEE =0.53, p = 0.06. If the subjects were further divided into age categories by gender, the type of PA best correlated with CV risk in younger males was with the highest intensity 5 minutes (r = -0.49, SEE = 0.41) and in younger females was with the highest intensity 30 minutes (r = -0.50, SEE = 0.38). In both males and females aged 25 to 45 as well as males from 45 to 65, the best correlations were found with total counts per day (r = -0.63, r = -0.37 and r = -0.56 respectively). For females aged 45 to 65, there were no significant correlations found between any PA and CV risk. Discussion The results of this study affirm the relationship between PA and CV risk factors. Unique to this study is the characterization of the intensity and duration of PA in a way that was not previously possible. The introduction of accelerometers into PA measurement has enabled further exploration of activity intensity and duration specifics. It is now possible to examine and evaluate differences in activity patterns and assess the patterns of PA that best relate to the prevention of chronic diseases. Previous to the use of accelerometers, the standards for measurement of daily PA included self-report observations and cardiorespiratory fitness.256 The current recommendations are based primarily on research that used either fitness level or self-report to measure PA.2 It is well established that self-reported 94
Table 10 Correlations of CV risk A with PA by age & gender Males
Females
18 to 25
25 to 45
45 to 65
18 to 25
25 to 45
45 to 65
Total counts per day
0.395
0.631*
0.560*
0.343
0.369*
0.183
hct 5
0.488*
0.491
0.379
0.463
0.359
0.167
hct 30
0.418
0.517
0.513
0.500*
0.343
0.189*
Table 10: Highest correlations between cardiovascular risk A and accelerometer activity counts by gender and age category. CV = cardiovascular, PA = physical activity, hct 5 = highest intensity 5 minutes, hct 30 = highest intensity 30 minutes. * indicates highest r values for each group.
95
PA has an inverse relationship with CVD risk and that the relationship between fitness and CVD health is even stronger than that of self-reported PA.2, 256 However, the measurement of fitness (VO2max) has a large genetic component 257, 258 and does not include the specifics of habitual activity such as total daily activity or time spent in moderate and vigorous activity. Because these measurement methods do not directly measure PA, doubt has remained as to the optimal parameters (frequency, intensity and duration) of exercise.256 Using accelerometers, it is possible to objectively assess the quality and quantity of PA as it is accumulated throughout the day. Previous findings have been confirmed and further information has been obtained regarding intensity and duration. A cross-section of an apparently healthy population (table 6) was sampled. Of the participants in our study, 67% met or exceeded 30 minutes of moderate (or higher) daily PA 5 of 7 days per week and 45% met these guidelines 6 of the 7 days per week. Depending on the definition of “most days of the week” these numbers are different than the survey data previously reported by the Centers for Disease Control (CDC) in which 60 % of the adult population was not regularly active 5 or more days per week.2 If regularly active is defined as 6 or more days a week, our numbers are closer to those reported by the CDC. Additionally, since subjects were recruited by students enrolled in a college upper division exercise physiology class, our sample may be more active than the general population. The PA patterns of our sample are comparable to that of other studies using accelerometers. In this investigation, 76.5 minutes per day were spent in 96
moderate activity while only 8.5 minutes per day were spent in vigorous activities. These results are similar to those observed by Buchowski et al. in a study of healthy adults’ in a southern US city. Approximately 1 hour per day was spent in moderate activities and less than 10 minutes was accumulated in vigorous activity.249 Non-sedentary minutes totaled 985 per day for men and 935 per day for women. Matthews et al. in a study of daily PA variance of healthy adults, observed time in non-sedentary activity was similar to the current study with 912 minutes for men and 896 for women.140 PA and CVD risk Correlational values for physical activity and CVD in the current study ranged from r = - 0.398 to -0.422 for all subjects. This is a clinically important finding. Previous researchers report correlations between physical activity and heart disease to be r = – 0.258239 and between physical activity and individual risk factors of blood pressure, BMI and HDL to range from r = 0.09 to 0.14.259 Several quantification methods for PA intensity and duration were modeled. Total activity counts supplies information on the total amount of daily activity regardless of intensity. The time in moderate and vigorous categories allow assessment of duration at particular intensity levels. Evaluation of individual minutes of highest intensity, accumulated for periods of 5 to 90 minutes, allows assessment of short-term, high-intensity activity. Most previously reported data demonstrate that duration of moderate or above PA intensities is inversely related to CVD.56 Additionally, higher fitness levels (VO2max) are related to decreased CV risk.2, 124 In the current study, the 97
30 individual minutes of highest intensity accumulated (hct30) provided the best relationship with CVD risk (r = -0.41) for all subjects. Time spent in moderate and vigorous activity was significantly and inversely related to CV risk (Tmod: r = 0.34, Tvig: r = -0.35) however, both total activity counts (TAC) and the 5 individual minutes of highest intensity accumulated (hct5) were better associated with decreased CV risk (r = - 0.40). In addition, using both duration (Tmod) and intensity (hct 30) components in the prediction equations did not significantly improve the r values over using an intensity component alone. Intensity levels of activity were converted into MET levels using established prediction equations.255 The levels of intensity achieved in the hct5 minutes ranged between 7 and 10 METs. This intensity corresponds to activities such as jogging, jumping rope, playing basketball, racquetball, soccer or singles tennis, backpacking or walking upstairs, walking 5 mph on a level surface, lap swimming, cross country skiing, and snowshoeing. The levels of intensity achieved in hct30 were between 5 and 9 METs. Activities in this range include cycling >10mph, low impact aerobics, dancing (such as square, line country, swing, polka), walking greater than 4.0 mph (15 min/mile), swimming, and walking upstairs. At higher intensities, duration may not be as important as originally thought. Instead, as Yu et al. suggest, attaining higher intensity levels for shorter time periods may be more beneficial for health benefits, particularly at younger ages.187 As noted in our study, reaching higher intensity levels for 1 minute periods accumulated for at least 5 minutes a day appears to be better related to 98
lower risk of CVD than longer durations of moderate or vigorous activity per day (table 10). This would be consistent with studies using fitness as a measure of PA124, 129 if VO2max is better related to the highest habitual intensity levels obtained than accumulated time in moderate activity. The results of the current study suggest that to reduce risk for CVD in apparently healthy individuals, longer durations of moderate or vigorous activity are important, but that 5 minutes of high intensity activity is better related to lower levels of CVD risk factors. This relationship is maintained up to the 90 individual minutes of highest intensity (table 8). The results of this study lend support to the need to incorporate PA throughout the day and the importance of including short periods of higher intensity activity. Furthermore, our data give further guidance about the required intensity and duration necessary to promote reduction of CV risk. As little as 5 individual minutes of higher intensity activity along with accumulation of moderate activity throughout the day may provide the best combination of PA related to inverse CV risk. Accelerometers have been proven valid and reliable instruments to determine habitual PA and to measure energy expenditure in ambulatory individuals. The accelerometer appears to overcome the subjective limitations of PA recall and additionally provides information on duration and intensity of PA that cannot be provided by other instruments such as pedometers or fitness testing. Using accelerometry to understand the relationship between both intensity and duration of PA with CV risk, it may become possible to improve both general and individual PA recommendations. 99
Limitations of the study Accelerometers are highly correlated to walking and jogging activities (r = 0.89-0.99) 133, 138, 143 however there are limitations regarding type of activity being performed. Accelerometers placed at the hip are unable to detect increases in energy costs associated with upper body movement, changes in surface or terrain (walking, running or hiking uphill), or activities involving external work.260262
In these activities, activity would be underestimated. Also, an attempt was
made to obtain a cross section of the local population however, because it was a sample of convenience, it may not be representative of the general population. Conclusions From these results, we conclude that the greater the volume of activity accumulated, the lower the CVD risk. However, the highest PA intensity levels achieved for durations as short as 1 minute, 5 times per day were more strongly associated with lower risk, particularly in younger individuals. These are clinically important findings because the correlational values obtained in this study are higher than those from previous studies and because additional information on the relationship between physical activity and CV risk has been uncovered.
100
CHAPTER 5 EXAMINING HABITUAL PHYSICAL ACTIVITY AND CARDIOVASCULAR DISEASE RISK FACTORS IN STROKE SURVIVORS
Abstract Purpose: The purposes of this study are to: 1. Compare the measurable risk factors for CVD and physical activity level between individuals after stroke and age-gender matched able-bodied controls. 2. Establish the relative intensity and duration of physical activity in a sample of stroke survivors. Managing cardiovascular disease (CVD) risk factors and increasing habitual physical activity (PA) have been shown to decrease risk of cardiovascular (CV) events in healthy individuals and those with coronary heart disease. Controlling CVD risk factors may also lower risk of CV events in stroke survivors. Because no studies have examined CVD risk factor levels in stroke survivors, it is uncertain how effectively CVD risk factors are managed in this population. Intensity and duration of PA are the basis of the current habitual PA recommendations from the American College of Sports Medicine. Neurological impairments from stroke decrease energy efficiency of movements thereby increasing energy costs of movement. As a result, a higher intensity of PA is required for mobility and routine daily activities. If stroke survivors work harder than individuals without impairment to perform the same task, then fitness levels should be higher in stroke survivors unless other parameters of physical activity differ. Most of the data available on habitual PA in stroke survivors are collected through 101
cardiorespiratory fitness testing. Cardiorespiratory fitness is strongly associated with health benefits and directly related to habitual physical activity but does not provide the specifics of habitual PA such as intensity and duration. Observation of the intensity and duration of habitual activity would allow comparison of the relative intensities of physical activity in stroke survivors to the apparently healthy population. Methods: Complete data sets were collected on 16 subjects, 7 men and 1 woman each in the experimental and age-matched control groups. Experimental group participants had to be status post ischemic stroke for at least 3 months, independent ambulators, with or without an assistive device and in good general health (medically stable). Resting blood pressure, height, weight and waist girth were measured. Fasting blood samples was analyzed for total cholesterol (TC), low density lipoprotein cholesterol (LDL), high density lipoprotein cholesterol (HDL), triglycerides, C-reactive protein and glycosylated hemoglobin (HbA1c). Habitual PA was assessed for 7 days with an accelerometer. Oxygen consumption and accelerometer data were recorded during a 6 minute walk test. From the 6 minute walk data, step counts were calculated for PA intensities of 3 and 6 METs. Means and standard deviations of descriptive variables and dependent variables were calculated within each group. T-tests analyses determined group differences comparing scores of stroke survivors to age matched controls. All significance levels were set at p < 0.05. Results: Elevated levels of systolic blood pressure (136.6 + 11.3 mmHg) and BMI (30.6 + 3.1 kg/m2) were observed in the stroke group. Significant differences between the stroke and control groups were found in body mass index (CI: 1.05 102
to 7.82 kg/m2) and systolic blood pressure (CI: 0.76 to 26.79 mmHg). No significant differences were found in diastolic blood pressure, waist girth, HDL, total cholesterol and HbA1c. During the 6 min walk, PA intensity was significantly lower in the stroke group (4.48 + 1.08 METs) than the control group (7.00 + 2.23 METs, CI: -4.28 to -0.77 ml/kg/min). Total activity of the stroke group was 34% lower than the control group (CI: -222,283 to -25,198 counts). Daily time in moderate activity and above was 15.26 minutes for the stroke group and 32.36 minutes for the control group. Physical activity of the stroke group was only 51% of the current national physical activity recommendations of 30 minutes of moderate activity most days of the week. Conclusions: Risk of CV events was elevated in this sample of stroke survivors. Three out of 6 of the modifiable risk factors for CVD were present, blood pressure, obesity and sedentary lifestyle. Physical activity in this group of stroke survivors was well below the recommended intensity and duration for risk reduction of chronic disease, premature mortality and CV events. Neurological limitations of stroke promote a sedentary lifestyle. Cardiorespiratory fitness may need to be addressed separately from functional assessments of activities of daily living in the rehabilitation of stroke survivors. Physical limitations must be overcome to provide the best outcome for these individuals and improve quality of life.
103
Introduction Cardiovascular (CV) events such as recurrent stroke and myocardial infarction are the leading causes of death in stroke survivors.263, 264 Up to 75% of stroke survivors have cardiovascular disease (CVD).263, 265, 266 Managing CVD risk factors such as hypertension, dyslipidemia, diabetes mellitus, and obesity along with increasing habitual physical activity have been shown to decrease risk of CV events in healthy individuals and those with coronary heart disease CAD.59
Controlling CVD risk factors may also lower risk of CV events in stroke
survivors. Yet CVD and its risk factors remain understudied in this population.267 Although data exist on levels of individual CVD risk factors in stroke survivors, no studies are known to this author that compare CVD risk factor levels in stroke survivors to healthy age-matched individuals. Therefore, it is uncertain how effectively CVD risk factors are managed in stroke survivors. In the able-bodied, physical activity has been shown to be effective in controlling many individual CVD risk factors such as blood pressure, cholesterol, body mass index (BMI), and blood sugar.5, 9, 52, 164 It is likely that the health benefits of habitual physical activity in stroke survivors are similar to that of apparently healthy individuals.4 Until recently, little attention has been paid to habitual activity in stroke rehabilitation. Information provided by self-report questionnaires indicate that stroke survivors spend the majority of their day in sedentary activities.268 Other available information on physical activity in stroke survivors has been obtained through peak fitness testing (VO2max or VO2peak). Two separate studies published in 2005 reported peak fitness to be significantly 104
lower in a sample of subjects one year after a stroke event than in age matched controls.269, 270 Although peak fitness testing provides information on habitual daily activity, it is generally not recommended in this population due to the increased risk of CV events when exercising at near maximal levels.223 Submaximal fitness testing is often used as an alternative to provide estimates of VO2max using prediction equations. An example of a submaximal test commonly used in stroke survivors is the 6 minute walk.223 Most individuals regain independence in household ambulation after experiencing a stroke, however the majority do not regain sufficient aerobic capacity to function in the community and work outside the home.263, 271 Residual neurological impairments often affect mobility and the ability to perform routine daily activities. These neurological impairments can decrease energy efficiency of movements thereby increasing energy costs of movement. As a result, a higher relative intensity is generally required for mobility and routine daily activities. If stroke survivors work harder than individuals without impairment to perform the same task then fitness levels should be higher in stroke survivors unless other parameters of physical activity differ. Whether submaximal or maximal, fitness testing represents the potential for physical activity and does not provide specifics of daily physical activity such as intensity and duration. Using a device like an accelerometer to monitor physical activity can provide objective information on intensity and duration of habitual physical activity with minimal lifestyle intrusion. Observation of the 105
intensity and duration of habitual activity would allow comparison of the relative intensities of physical activity in stroke survivors to the apparently healthy population. Using the information on habitual activity provided by accelerometers will also allow closer examination of the relationship between habitual physical activity and other CVD risk factors in this population. If the energy cost of physical activity is higher, does the relationship between physical activity and CVD risk factors also change? The purposes of this study are to: 1. Establish the relative intensity and duration of physical activity in a sample of stroke survivors. 2. Compare the measurable risk factors for CVD and physical activity level between individuals after stroke and age-gender matched able-bodied controls. Methods Informed written consent was obtained from all subjects and all procedures were approved by The University of Montana Institutional Review Board for Use of Human Subjects and conformed to the Declaration of Helsinki. Participants were recruited by convenience sampling through word of mouth and informational flyers. To be eligible for this study, experimental group participants had to be independent ambulators, with or without an assistive device, in good general health (medically stable) and status post ischemic stroke for at least 3 months. Members of the control group were recruited to match age and gender of those in experimental group. Exclusion criteria for both groups included: recent infection or surgery within the past 3 months, uncontrolled or poorly controlled hypertension, and previous myocardial infarction, hemorrhagic stroke or 106
diagnosed cardiomyopathy. Complete data sets were collected on 16 subjects, with 7 men and 1 woman each in the control and experimental groups. Once recruited, the participants were asked to read and sign the consent form. Participants then completed the physical activity readiness questionnaire (PAR-Q) form272 and a medical history form to determine if they met the criteria of the study and to provide a list of medications. Once these forms were completed, a heart rate monitor was placed around the torso and participants completed the Physical Activity Scale for Individuals with Disabilities (PASIPD).273 Resting blood pressure was taken by a trained technician using a sphygnomometer and standard protocol.222 Pulse was monitored throughout the remainder of the seated period and the lowest observed number recorded. Then height, weight and waist girth were measured and recorded per protocol.223 Activity Monitors Habitual PA was assessed with the Actical accelerometer (Mini Mitter, Bend, Oregon). After obtaining height and weight measurements, participants were fitted with accelerometers on the non-paretic (or dominant) hip and worn for a total of 7 days including a weekend period. Placing a single device on the hip or lower back is recommended.142 The monitors were secured at the hip with TegadermTM (3MTM, St. Paul, Minnesota) to ensure proper placement of the monitors. The participants wore the devices for 7 days and were able to shower and swim without restriction. Previous research has shown that in adults, a minimum of 3 to 5 days of monitoring is optimal to determine activity patterns.140, 142
The period of 7 days was chosen to ensure inclusion of both weekend days 107
and weekdays. Log sheets were provided to record any activities such as riding or driving on a bumpy road that might overestimate activity and any times where they neglected to wear the device. The Actical activity monitors are small (2.8 x 2.7x1.0 cm3), lightweight (17g) units that have a primary plane of detection but are sensitive to all three planes of motion.248 The Actical is a piezo-electric accelerometer with a range of 0.5 to 2G and frequency of 0.35 to 3.5 Hz. The Actical samples acceleration at a rate of 32 Hz and integrates this over the user-defined epoch.248 In this study, the epoch was set at 15 seconds, comprising an integral of 5760 measurements for each day. The 6-minute walk The 6-minute walk took place using an accelerometer and the portable metabolic system on a 200 ft rectangular loop. The participants were familiarized with the Borg 6-20 Rate of Perceived Exertion (RPE) scale, portable metabolic cart (VO 2000, Medgraphics, Minneapolis, Minnesota) and the Actical™ accelerometer. Heart rate was monitored via a polar heart rate monitor and activity was monitored by accelerometers on the non-paretic (or dominant) hip. Energy expenditure was assessed using the VO2000 portable metabolic system, a 1.5 lb device worn in a small back pack. The VO 2000 was calibrated before each test. The participant was asked to walk for 6 minutes around the designated loop and to cover as much distance as they comfortably could in that time period. During the testing, the participant used any assistive device normally used for walking and continuous monitoring of oxygen consumption and CO2 production 108
was performed. Heart rate was recorded every lap. Distance was measured to the nearest meter at the completion of the test. Timed up and go testing Participants were asked to stand up from a chair, walk 3 meters, turn around, return to the chair, and sit down. Time taken to complete this task was measured by a stopwatch and this task was repeated 3 times with the shortest recorded time used for data analysis. During the test, accelerometers on the nonparetic (or dominant) hip monitored movement and participants were permitted to use any assistive device normally used for walking. A blood sample was collected from the participants within 2 weeks of the testing session detailed above. Participants were asked to fast for 12 hours prior to blood sample collection. Two 12ml vials of venous blood were drawn and analyzed at a hospital laboratory for lipids [total cholesterol (TC), low density lipoprotein cholesterol (LDL), high density lipoprotein (HDL), triglycerides], high sensitivity C-reactive protein (CRP) and glycosylated hemoglobin (HbA1c) to measure average blood glucose. Samples were analyzed for CRP, HbA1c and lipids enzymatically using an automated clinical chemistry analyzer (RocheHitachi P-module, Indianapolis, IN) with estimation calculation of LDL cholesterol using the Friedewald equation.79 Data analysis As the activity monitors were collected, the data was downloaded into a computer file using the Minimiter software. Using the activity log sheets completed by the participant, data for time periods that might overestimate 109
activity such as riding or driving on a bumpy road were eliminated. Also, all Actical files were screened for periods of zero activity. If the Actical was not worn, per report on the activity log sheet, this data was removed from the analysis. Because there are no published data available that relate oxygen consumption with activity counts in stroke survivors, analysis of this relationship was individualized for each subject. Ventilation and activity counts were concurrently recorded during the 6 minute walk. Using data from the last 3 to 4 minutes of the 6 minute walk when oxygen consumption was steady, the counts per minute were averaged. Average metabolic equivalent (MET) level during this time period was also calculated. From this information, the numbers of counts per minute corresponding to 3 and 6 METs were calculated for each individual assuming a linear relationship between oxygen consumption and step count. These MET levels were selected because they are the established cutoffs between light, moderate and vigorous activity.252 From these data, time in 3 activity intensity levels (< moderate, moderate, and vigorous) was determined for each individual during the 7 days of activity monitoring. Because only moderate intensity and above activity is considered cardioprotective, no attempt was made to differentiate between sedentary and light activity in this study. Average counts per day, average counts per minute, time in sedentary and light activity and time in moderate and above activity were used for statistical analysis. Using average counts per day quantifies total daily activity while utilizing average counts per minute allows for determination of activity intensity.
110
Statistics Means and standard deviations of descriptive variables and dependent variables were calculated within each group. Data analysis was performed both with all subjects and then with males only. T-tests analyses were used to determine group differences comparing scores of stroke survivors to age matched controls. When equal variances could not be assumed (Levine’s test for equality of variances) the more stringent values were reported. A p value of less than 0.05 was considered to be statistically significant. SPSS 12.0 (SPSS, Inc., Chicago, Illinois) was used for all data analysis. Results Complete data sets were obtained for eight subjects, 7 men and 1 woman in each group, stroke survivors and the control group. Means and standard deviations of descriptive variables appear in tables 11 through 14. Dependent variables included body mass index (BMI), waist girth, systolic and diastolic blood pressure (table 11), total cholesterol, LDL cholesterol, HDL cholesterol, CRP, blood glucose (HbA1c) (table 12), timed up and go (TUG), the 6 minute walk test (table 13) and accelerometer data (table 14). Analyzed accelerometer data included total activity, average intensity, and time in 3 intensities of activity (sedentary & light, moderate and vigorous). All subjects T-test results indicated significant differences between groups in BMI (CI: 1.05 to 7.82 kg/m2), systolic blood pressure (CI: 0.76 to 26.79 mmHg), LDL cholesterol (CI: -73.68 to -16.46 mg/dl), TUG (CI: 1.06 to 23.07 seconds), 6 111
Table 11 Descriptive Statistics and T-test Results 95% Confidence Interval
Stroke Group
Control Group
Mean
SD
Mean
SD
Lower
Upper
Age (yrs)
63.67
9.03
61.33
8.00
-6.19
10.86
Height (cm)
176.25
9.37
175.97
9.69
-9.24
9.81
Weight (kg)
94.66*
11.24
80.46*
10.93
3.12
25.28
Waist (cm)
105.80
11.61
96.67
9.97
-1.68
19.95
SBP (mmHg)
138.56*
11.26
124.78*
14.58
0.76
26.79
DBP (mmHg)
74.00
8.26
81.33
7.55
-15.24
0.57
BMI (kg/m2)
30.50*
3.08
26.07*
3.66
1.05
7.82
Table 11: T-test results for descriptive variables between experimental (stroke) group and control group displaying means, standard deviations and confidence intervals. SD = standard deviation, yrs = years, cm = centimeters, kg = kilograms, SBP = systolic blood pressure, mmHg = pressure in millimeters of mercury, DBP = diastolic blood pressure, BMI = body mass index, m = meters, * indicates statistical significance at p < 0.05.
112
Table 12 T-test Results for Blood Sample Variables 95% Confidence Interval
Stroke Group
Control Group
Mean
SD
Mean
SD
Lower
Upper
TG (mg/dL)
208.25
137.10
112.11
69.17
-23.34
215.62
TC (mg/dL)
175.38
20.36
205.11
46.55
-67.29
7.82
HDL (mg/dL)
55.13
11.12
54.22
14.51
-12.60
14.40
LDL (mg/dL)
83.38*
16.86
128.44*
34.38
-73.68
-16.46
HbA1c (%)
5.64
0.44
5.42
0.20
-0.13
0.56
CRP (mg/dL)
0.33
0.36
0.09
0.07
-0.02
0.50
Table 12: T-test results for blood sample variables between experimental (stroke) group and control group displaying means, standard deviations and confidence intervals. SD = standard deviation, TG = triglyceride, mg = milligrams, dL= deciliter, TC = total cholesterol, HDL = high density lipoprotein, LDL = low density lipoprotein, HbA1c = glycosylated hemoglobin, % = percentage, CRP = Creactive protein, * indicates statistical significance at p < 0.05.
113
minute walk distance (CI: -1,552 to -597.12 feet) and MET level during 6 min walk (CI: -4.28 to -0.77 ml/kg/min). With the accelerometer data, significant differences were found in average counts per day (CI: -222,283 to -25,198 counts), average counts per minute (CI: -156.77 to -18.11 counts) and minutes per day spent in sedentary and light activity (CI: 11.65 to 77.25 minutes). Of note, differences in the time spent in moderate and above activity approached significance at p = 0.06. No significant differences were found in diastolic blood pressure, waist girth, HDL, total cholesterol and HbA1c. Males only Significant differences between the group with stroke and control group were found in BMI (CI: 0.20 to 7.50 kg/m2), systolic blood pressure (CI: 0.05 to 27.95 mmHg), LDL cholesterol (CI: -64.47 to -19.70 mg/dl), TUG (CI: 0.03 to 25.39 seconds), 6 minute walk distance (CI: -1601.34 to -500.54 feet) and MET level (CI: -4.11 to -0.28 ml/kg/min). Additional significant differences were found in C-reactive protein levels (CI: 0.01 to 0.27 mg/dl) and time in moderate and above activity (CI: -47.46 to -1.68). With the accelerometer data, significant differences were found in average counts per day (CI: -224,388 to -23,093 counts), average counts per minute (CI: -158.17 to -16.71 counts) and minutes per day spent in sedentary and light activity (CI: 11.65 to 77.25 minutes). Also of note, differences in waist circumference approached significance at p = 0.06 and, because equal variance could not be assumed, triglycerides levels were not significantly different between groups (p = 0.051). No significant differences were found in diastolic blood pressure, waist girth, HDL, total cholesterol and HbA1c. 114
Table 13 T-test Results for Functional Tests 95% Confidence Interval
Stroke Group
Control Group
Mean
SD
Mean
SD
Lower
Upper
Best TUG (seconds)
17.47*
14.32
5.41*
0.46
1.06
23.07
6 min distance
1091.28*
606.64
2165.67*
208.07
-1,552
-597.12
6 min METs
4.47*
1.08
7.00*
2.23
-4.28
-0.77
Table 13: T-test results for functional tests between experimental (stroke) group and control group displaying means, standard deviations and confidence intervals. SD = standard deviation, TUG = timed up and go, 6 min distance = distance achieved in 6 minute walk test, 6 min METs = average energy expenditure during last half of 6 minute walk test, * indicates statistical significance at p < 0.05.
115
Table 14 T-test Results for Accelerometer Data 95% Confidence Interval
Stroke Group
Control Group
Mean
SD
Mean
SD
Lower
Upper
65,057*
69,191
188,798*
121,077
-222,283
-25,198
46.16*
49.34
133.59*
84.80
-156.77
-18.11
Min/day Sed & Light
1,429*
14.58
1,385*
41.64
11.65
77.25
Min/day Moderate
14.27
13.08
30.35
28.47
-38.21
6.07
Min/day Vigorous
0.99
1.57
2.02
2.31
-3.00
0.95
Min/day in Moderate & above
15.27
13.45
36.43
28.31
-43.62
1.3
Total Activity (cts/day) Average Intensity (cts per min)
Table 14: T-test results for accelerometer data between experimental (stroke) group and control group displaying means, standard deviations and confidence intervals. SD = standard deviation, Total activity = average number of counts per day for the 7 days, Average intensity = average daily counts per minute, cts = counts, min = minute, Min/day Sed & Light = total minutes per day spent in sedentary and light intensity activities, Min/day Moderate = total minutes per day spent in moderate intensity activities, Min/day Vigorous = total minutes per day spent in vigorous intensity activities. Min/day in moderate and above = total minutes per day spent in both moderate and vigorous intensity activities, * indicates statistical significance at p < 0.05.
116
Discussion Cardiovascular Disease Risk Factors: Although the risk of CV events such as myocardial infarction (MI) or recurrent stroke is elevated in stroke survivors, there are few data on CVD risk factors levels in this population. It is important to determine baseline levels of CVD risk factors in stroke survivors in order to effect changes in risk of CV events. Systolic blood pressure was significantly higher in the stroke group than in the control group. The mean systolic blood pressure for the stroke group was 136.6 mmHg which is classified as pre-hypertension. By comparison, those in the control group had a mean systolic pressure of 124.8 mmHg, in the high normal range. Seventy five percent of the stroke group and 50% of the control group were taking anti-hypertensive medication. Researchers have observed blood pressure control to be worse in stroke survivors than those suffering a myocardial infarction274 even though blood pressure control is essential for prevention of CV events.275 It is essential to maintain stringent control of blood pressure, particularly systolic. The risk of stroke and CVD associated with increasing systolic blood pressure is evident across the entire range of systolic blood pressure, independent of the level of diastolic blood pressure.276-279 Even small reductions in blood pressure decrease risk of stroke. Differences in blood pressure of 5, 7.5, and 10 mm Hg were associated with reductions in stroke incidence of 34%, 46%, and 56% respectively.17 The 11.8 mmHg difference in systolic blood pressure between the stroke and control groups in the current study is clinically important and indicates that these individuals continue to be at greater CVD risk. 117
Body mass index was also significantly higher in the stroke group than in the control group. The mean BMI was 30.6 kg/m2 in the stroke group with all subjects in either the overweight or obese range. Mean BMI in the control group was 26.07 kg/m2. Long term risk of CVD increases significantly with increasing levels of overweight and obesity.280 The higher the BMI, the greater the prevalence of myocardial infarction and stroke.281-283 Excess weight is associated with an increased risk of ischemic stroke independent of diabetes and other metabolic syndrome components.284 Each 2 kg/m2 increase in baseline BMI is associated with a 15.4% increase in relative risk of CHD and an 18.8% increase in relative risk of ischemic stroke. Conversely, reduction of BMI to under 24 might prevent the incidence of CHD by 11% and that of stroke by 15% for men, and 22% of both diseases for women.282 In the current study, the higher BMI values found in the stroke group indicate increased CVD risk. In males, CRP values were higher in the stroke group than the control group (0.21 mg/dL versus 0.07 mg/dL). Normal concentration levels in the plasma are less than 0.5 mg/L or 0.05 mg/dL.79 Cardiovascular risk levels are stratified into low, moderate, and high corresponding to CRP levels of 0.3 mg/dL.102 Levels of CRP can assist with risk prediction of cardiac events in healthy individuals77, 89, 90, 93 and after an ischemic event.285 In previous studies, CRP was the single strongest predictor of CV event risk80 even after controlling for other Framingham risk scores.73 C-reactive protein level is also a risk predictor for stroke73, 286-288 and recurrent ischemic stroke.289-291 By controlling CVD risk factors, CRP levels may also be lowered. Obesity, blood 118
pressure, diabetes and smoking were all positively associated with levels of inflammation as measured by CRP.57 Increases in physical activity and decreases in blood pressure have been inversely related to CRP levels.292 Values below 0.3 mg/dL are considered to be useful in prediction of CV risk. The findings of the current study are clinically important and consistent with the literature on CRP indicating the individuals in the stroke group may be at higher risk for CV events. Differences in LDL cholesterol levels were also observed. Although LDL cholesterol levels were significantly higher in the control subjects, the levels were less than what is considered elevated (> 130 mg/dl).293 Seventy five percent of the participants in the stroke group (6 of 8) were on medications for lipid lowering. This may indicate that cholesterol is being managed effectively in the stroke survivors. Only 1 of 8 participants in the control group was being managed with medications for dyslipidemia. Medical management of cholesterol levels less than 130 mg/dL is not recommended for those not at high CVD risk. 223, 293 Blood sugar, diastolic blood pressure and lipid levels were within normal limits for the stroke group however, elevated levels of systolic blood pressure and BMI were observed in all subjects and CRP levels were significantly higher than the control group in males. Hypertension, obesity and low grade inflammation have been related to increased risk for CV events. From these observations, this sample of stroke survivors presents with a higher CVD risk than the control group even without considering the additional risk from having a history of a CV event.
119
Daily Physical Activity The American College of Sports Medicine and Center for Disease Control recommend at least 30 minutes of accumulated moderate activity most days of the week for reducing CVD risk.56 Habitual physical activity is important in moderating CVD risk factors. In apparently healthy individuals, routine physical activity decreases cardiovascular disease (CVD),4, 45 lowers blood pressure5-9 lowers body fat,5, 9 and decreases systemic inflammation.47-49 Although physical activity assessments have previously been made in stroke survivors, until recently it was difficult to objectively measure intensity and duration of physical activity. Habitual activity levels were significantly less in the stroke group than in the age matched control group. Total activity of the stroke group was 34% lower than the control group as measured by counts per day of 65,057 versus 188,798 respectively. Intensity of physical activity was also lower in the stroke group. Average counts per minute differed by 87 counts/min with the stroke group averaging 46.16 counts per minute and the control group averaging 133.59 counts per minute. Time in moderate activity and above was 15.26 minutes for the stroke group versus 32.36 minutes for the control group. The time stroke survivors spent in moderate and above activity was only 42% of the control group. Michael and Macko recently observed steps per day in stroke survivors to be approximately 35% of sedentary adults.294 The PA in the stroke group was
120
only 51% of the current national physical activity recommendations of 30 minutes moderate activity most days of the week.56 Following completion of rehabilitation, stroke survivors often adopt a sedentary lifestyle.295, 296 Average time in sedentary activities or sleeping was 17 hours per day with 1 of every 6 individuals sedentary or sleeping for all 24 hours.268 From these data, it is clear that stroke survivors are habitually less active than their age-matched counterparts. By remaining sedentary, cardiovascular fitness declines, eventually causing further loss of functional abilities. Without ample daily activity, risk of CVD is increased. Emphasis on the importance of increasing physical activity is vital to assist in controlling future risk of CV events. The sample of stroke survivors in the current study exhibited habitual activity consistent with findings of previous studies and well below the amount considered to be cardioprotective in healthy adults. Both duration and intensity of physical activity was far less in the stroke group than that of the control group and well below the physical activity recommended by the ACSM for reduction of health risks.223, 297, 298 Functional Assessments The results of both the TUG and 6 minute walk are consistent with other studies of stroke survivors. Mean TUG times were 17.5 + 14.3 seconds for the stroke survivors. This is 3.2 times slower than the age matched group. Other researchers have reported average TUG times of 13.7 to 25.2 seconds for those with stroke.299-304 Mean 6 minute walk distance was 332 meters for stroke survivors, 50% lower than the control group. Six minute walk distances observed 121
in previous studies of stroke survivors ranged from 202 to 491 meters.299, 305-311 In 2 separate studies, distances achieved in the 6 minute walk were 40 to 50% less than expected.308, 312 In the current study, this sample of stroke survivors appears to be representative of the population because values observed for the TUG and 6 minute walk are within the observed ranges of previous studies. Stroke survivors exhibited significantly lower oxygen consumption (VO2) during the 6 minute walk test than age matched controls. The mean oxygen consumption observed in the current research was 15.67 ml/kg/min or 4.48 METs, 58.6% of the age and gender matched controls. Oxygen consumption of stroke survivors ranged from 8.3 to 16.1 ml/kg/min in previous research313-315 with peak oxygen consumption observed to be significantly lower in participants who had a stroke than in age and gender matched controls.269, 270 Fitness in those with stroke has been observed to be 40 to 60% of healthy age-matched population.311, 315-317 Current ACSM recommendations for minimal physical activity call for 30 minutes of moderate activity most days per week with moderate activity defined as activity requiring 3 to 6 METs or 10.5 to 21ml/kg/min of oxygen consumption. The stroke survivors in this study were able to achieve moderate level activity averaging 4.48 METs in the 6 minute walk test. Therefore it is possible for stroke survivors to meet current guidelines for physical activity. At 60 years old, a peak VO2 above 25 ml/kg/min is considered normal for women and a peak VO2 above 32 ml/kg/min is considered normal for men.252 Although normal peak VO2 values are different in men and women and decrease with age, the observed VO2 values of stroke survivors are well below the energy 122
cost for most ADLs.269 This is an important observation, that many stroke survivors do not have the fitness required for independent living, even if their functional ability is present. Furthermore, an exercise capacity of below 21 ml/kg/min or 6 METs is associated with an increase in mortality.269 Performance in the 6 min walk test can be more strongly influenced by limits to walking speed such as balance.305, 309, 318 Variances in long distance walking were largely explained by balance for those who walked more slowly and fitness for those who walk more quickly.319 The neurological impairments caused by stroke can limit walking speed or distance preventing the cardiovascular system stress that improves fitness.320 It is likely that in stroke survivors, the walking speed observed in the 6 minute walk is the maximum speed that the individual can achieve in that task. In the majority of stroke survivors, walking is probably the most demanding daily living activity they perform. As a result the aerobic capacity of stroke survivors is likely similar to the oxygen consumption at their highest walking speed. For this sample of stroke survivors, oxygen consumption averaged 15.67 ml/kg/min, well below the 21 ml/kg/min exercise capacity associated with increased mortality. 269 If the walking speed is limited by balance, fitness may need to be separately addressed using activities other than independent walking to reach a sufficient intensity to challenge the cardiorespiratory system. It is possible to increase cardiovascular capacity of individuals after stroke. Treadmill walking with body weight support, stationary cycling and stepping exercises have been successfully utilized to increase endurance and walking efficiency.269, 270, 321 123
Conclusions It is important to uncover the particulars of physical activity to understand its relationship to CVD risk. Once the relationship is established, it may be possible to study the effects of increasing activity on CVD risk factors in this population. With the increased risk of CV events in survivors of stroke or heart attack, secondary prevention is essential. This is the first study relating multiple CVD risk factors to physical activity levels in stroke survivors. Three out of 6 of the modifiable risk factors for CVD were present in this sample of stroke survivors. Stroke survivors presented with elevated blood pressure, increased body mass, and a sedentary lifestyle and are already at increased risk due to history of CVD and age. That means that 5 of 8 risk factors of CVD are present in these individuals. Higher CRP levels may indicate risk of stroke or myocardial infarction is further amplified. It is imperative to control CVD risk factors in stroke survivors. Besides pharmacological management, increasing habitual activity should be encouraged whenever possible. The major challenge is that neurological limitations of stroke and extra effort required for even the most common activities such as walking, promotes a sedentary lifestyle. Cardiorespiratory fitness may need to be addressed separately from functional activities of daily living in the rehabilitation of stroke survivors. Physical limitations must be overcome to provide the best outcome for these individuals and improve quality of life. 124
125
CHAPTER 6 CONCLUSIONS
The purpose of this collection of studies was to explore the association of physical activity with CVD and attempt to identify some specifics of this complex relationship. Current physical activity recommendations call for 30 minutes of moderate activity most days of the week or 20 minutes of vigorous activity 3 days per week. From these recommendations it appears as intensity increases, duration decreases. The activity accumulation intervention provided in the first study fits within this continuum. Simply by increasing volume of physical activity through increases in step counts some of the modifiable CVD risk factors were improved. However, if the intensity or duration were further increased, additional improvements in CVD risk factors may occur. The activity accumulation programs were successful in initiating increases in physical activity and positive changes in CVD risk factors. To successfully provide additional improvements in risk factors, adding an intensity component may be optimal. The optimal intensity and duration of physical activity may change as one ages. In younger adults, total activity amount was inversely related to CVD risk, however, higher intensity activities accumulated for periods as short as 5 minutes provided the best correlations with CVD risk scores. As age increases, this relationship may diminish and total volume of accumulated activity may be more important. The highest correlations were observed for total activity in adults ages 25 to 45 and it appeared that with a larger sample size, the relationship may 126
continue in the 45 to 65 age range. Further investigation into this relationship in these age ranges may clarify these observations. In the study of apparently healthy individuals and stroke survivors, the inverse relationship between CVD risk factors and physical activity appears to be maintained. Physical activity in the control group was almost double that of the stroke survivors. Of the modifiable CVD risk factors measured, 3 were present in stroke survivors while none were observed in the control group. Although the relative intensity of daily activities in stroke survivors may be much higher than age matched controls for walking and other activities of daily living, it appears that this sample did not sustain these intensities for adequate durations to attain the cardioprotective effects of physical activity. A larger sample size would be recommended to make further conclusions about these groups. In this series of studies, the inverse relationship between CVD and physical activity has been confirmed. Through the use of activity monitors, additional insight into intensity and duration specifics has been accomplished. Much has been learned about the relationship between CVD risk and physical activity. In general, greater volumes of physical activity provide decreased risk however intensity and duration play important roles in this complex relationship. There is much more to be revealed about this association through further studies of specific age groups and of special populations as well as through various methods of increasing physical activity.
127
REFERENCES
1. 2. 3. 4.
5.
6.
7.
8.
9.
10.
11. 12. 13.
14.
15.
Sullivan D. Screening for cardiovascular disease with cholesterol. Clinica Chimica Acta. 2001;315:49-60. United States Department of Health and Human Services. Physical activity and health: A report of the surgeon general. 1996. Morris C, Froelicher V. Cardiovascular benefits of improved exercise capacity. Sports Medicine. 1993;16(4):225-236. Thompson P, Buchner D, Pina I. Exercise and physical activity in the prevention and treatment of atherosclerotic cardiovascular disease. Circulation. 2003;107:3109-3116. Bassuk S, Manson J. Physical activity and cardiovascular disease prevention in women. Exercise and Sports Science Reviews. 2003;31(4):176-181. Shephard R. Absolute versus relative intensity of physical activity in a dose-response context. Medicine and Science in Sports and Exercise. 2001;33(6s):S400-S418. Murphy M, Neville A, Neville C, Biddle S, Hardman A. Accumulating brisk walking for fitness, cardiovascular risk, and psychological health. Medicine and Science in Sports and Exercise. 2002;34(9):1468-1474. Thompson P, Crouse S, Goodpaster B, Kelley D, Moy N, Pescatello L. The acute versus the chronic response to exercise. Medicine and Science in Sports and Exercise. 2001;33(6 Supplement):S438-S445. Drygas W, Kostka T, Jegier A, Kunski H. Long-term effects of different physical activity levels on coronary heart disease risk factors on middleaged men. International Journal of Sports Medicine. 2000;21(4):235-241. Ward D, Evenson K, Vaughn A, Rodgers A, Troiano R. Accelerometry use in physical activity: Best practices and research recommendations. Medicine & Science in Sports & Exercise. 2005;37(11S):S582-S588. Welk G. Physical Activity Assessments for Health-Related Research. Champaign: Human Kinetics; 2002. Ridker P. Clinical application of C-reactive protein for cardiovascular disease detection and prevention. Circulation. 2003;107:363-369. Abramson JL, Vaccarino V. Relationship between physical activity and inflammation among apparently healthy middle-aged and older US adults. Archives of Internal Medicine. 2002;162:1286-1292. Rowland T. The role of physical activity and fitness in children in the prevention of adult cardiovascular disease. Progress in Pediatric Cardiology. 2001;12:199-203. Kannel W. The Framingham Study: Its 50-year legacy and future promise. Journal of Atherosclerosis and Thrombosis. 2000;6(2):60-66.
128
16.
17.
18.
19.
20.
21.
22.
23. 24.
25.
26. 27. 28. 29.
30.
O'Donnell C, Ridker P, Glynn R, et al. Hypertension and borderline isolated systolic hypertension increases risks of cardiovascular disease mortality in male physicians. Circulation. 1997;95:1132-1137. MacMahon S, Peto R, Cutler J, et al. Blood pressure, stroke, and coronary heart disease. Part 1. Prolonged differences in blood pressure: prospective observational studies corrected for the regression dilution bias. Lancet. 1990;335(8692):765-774. Grundy S, Pasternak R, Greenland P, Smith S, Fuster V. Assessment of cardiovascular risk by use of multiple risk-factor assessment equations. Journal of American College of Cardiology. 1999;34:1348-1359. Dunn A, Marcus B, Kampert J, Garcia M, Kohl H, Blair S. Comparison of lifestyle and structured interventions to increase physical activity and cardiorespiratory fitness: a randomized trial. Journal of the American Medical Association. 1999;281(4):327-334. United States Department of Health and Human Services. Reducing tobacco use: A report of the surgeon general. Atlanta: U.S. Department of Health and Human Services, Centers for Disease Control and Prevention; 2000. Stampfer M, Hu F, Manson J, Rimm E, Willett W. Primary prevention of coronary heart disease in women through diet and lifestyle. New England Journal of Medicine. 2000;343(1):16-22. Expert Panel on Detection Evaluation and Treatment of High Blood Cholesterol in Adults. Executive summary of the third report of the National Cholesterol Education Program (Adult Treatment Panel III). Journal of the American Medical Association. 2001;285(19):2486-2497. Garber A, Browner W, Hulley S. Cholesterol screening in asymptomatic adults, revisited. Annals of Internal Medicine. 1996;124(5):518-531. Barzi F, Patel A, Woodward M, et al. Comparison of lipid variables as predictors of cardiovascular disease in the Asia Pacific region. Annals of Epidemiology. 2005;15:405-413. Maron D. The epidemiology of low levels of high-density lipoprotein cholesterol in patients with and without coronary artery disease. The American Journal of Cardiology. 2000;86(12A):11L-14L. Tanne D, Yaari S, Goldbourt U. High-density lipoprotein cholesterol and risk of ischemic stroke mortality. Stroke. 1997;28(1):83-87. Raza J, Movahed, A. Current concepts of cardiovascular disease in diabetes mellitus. International Journal of Cardiology. 2003;89:123-134. Haffner S. Metabolic syndrome, diabetes and coronary heart disease. International Journal of Clinical Practice. 2002(132):31-37. Blanc M, Barnett D, Gleason R, Dunn P, Soeldner J. Hemoglobin A1c compared with three conventional measures of diabetes control. Diabetes Care. 1981;4(3):349-353. Delamater A. Clinical use of hemoglobin A1c to improve diabetes management. Clinical Diabetes. 2006;24:6-8. 129
31.
32.
33. 34.
35.
36.
37.
38.
39.
40.
41.
42.
43. 44.
Nathan D, Singer D, Hurxthal K, Goodson J. The clinical information value of the glycosylated hemoglobin assay. New England Journal of Medicine. 1984;310(6):341-346. Davy K, Hall J. Obesity and hypertension: two epidemics or just one? American Journal of Physiology Regulatory Integrative and Comparative Physiology. 2004;286:R803-R813. American College of Sports Medicine. Guidelines for Exercise Testing and Prescription (5th ed, 1995). Baltimore: Williams and Wilkins; 1995. Manson J, Hu F, Rich-Edwards J, et al. A prospective study of walking as compared with vigorous exercise in the prevention of coronary heart disease in women. New England Journal of Medicine. 1999;341(9):650658. Rimm E, Stampfer M, Giovannucci E, et al. Body size and fat distribution as predictors of coronary heart disease among middle-aged and older US men. American Journal of Epidemiology. 1995;141(12):1117-1127. Fang J, Wiley-Rosett J, Cohen H, Kaplan R, Alderman M. Exercise, body mass index, caloric intake and cardiovascular mortality. American Journal of Preventative Medicine. 2003;25(4):283-289. Lapidus L, Bengtsson C, Larsson B. Distribution of adipose tissue and risk of cardiovascular disease and death: A 12 year follow up of participants in the population study of women in Gothenburg, Sweden. British Medical Journal. 1984;289:1257-1261. Larsson B, Svardsudd K, Welin L. Abdominal adipose tissue distribution, obesity and risk of cardiovascular disease and death: 13 year follow up of participants in the study of men born in 1913. British Medical Journal. 1984;288:1401-1404. Rexrode K, Carey V, Hennekens C, et al. Abdominal adiposity and coronary heart disease in women. Journal of the American Medical Association. 1998;280(21):1843-1848. Woo J, Ho S, Yu A, Sham A. Is waist circumference a useful measure in predicting health outcomes in the elderly? International Journal of Obesity Related Metabolic Disorders. 2002;26(10):1349-1355. Welborn T, Dhaliwal S, Bennett S. Waist-hip ratio is the dominant risk factor in predicting cardiovascular death in Australia. Medical Journal of Australia. 2003;179:580-585. Janssen I, Katzmarzyk P, Ross R. Waist circumference and not body mass index explains obesity-related health risk. The American Journal of Clinical Nutrition. 2004;79:379-384. Bray G. Don't throw the baby out with the bath water. The American Journal of Clinical Nutrition. 2004;79:347-349. Janssen I, Heymsfield S, Allison D, Kotler D, Ross R. Body mass index and waist circumference independently contribute to the prediction of nonabdominal, abdominal subcutaneous, visceral fat. Journal of Clinical Nutrition. 2002;75:683-688. 130
45. 46.
47.
48.
49.
50.
51.
52.
53.
54.
55.
56.
57. 58.
Morris CK, Froelicher VF. Cardiovascular benefits of improved exercise capacity. Sports Medicine. 1993;16(4):225-236. Haapanen N, Miilunpalo S, Vuori I, Oja P, Pasanen M. Association of leisure time physical activity with the risk of coronary heart disease, hypertension and diabetes in middle-aged men and women. International Journal of Epidemiology. 1997;26(4):739-747. Geffken D. Association between physical activity and markers of inflammation in a healthy elderly population. American Journal of Epidemiology. 2001;153(3):242-250. Mattusch F, Dufaux B, Heine O, Mertens I, Rost R. Reduction of the plasma concentration of C-reactive protein following nine months of endurance training. International Journal of Sports Medicine. 2000;21:2124. Dufaux B, Order U, Geyer H, Hollmann W. C-reactive protein serum concentrations in well-trained athletes. International Journal of Sports Medicine. 1984;5(2):102-106. Pronk N, Tan A, O'Connor P. Obesity, fitness, willingness to communicate and health care costs. Medicine and Science in Sports and Exercise. 1999;31(11):1535-1543. Martinson B, Crane A, Pronk N, O'Connor P, Maciosek M. Changes in physical activity and short-term changes in health care charges: A prospective cohort study of older adults. Preventive Medicine. 2003;37(4):319-326. Blair S, Kampert J, Kohl H, et al. Influences of cardiorespiratory fitness and other precursors on cardiovascular disease and all-cause mortality in men and women. Journal of the American Medical Association. 1996;276(3):205-210. Kampert J, Blair S, Barlow C, Kohl H. Physical activity, physical fitness, and all-cause and cancer mortality: A prospective study of men and women. Annals of Epidemiology. 1996;6(5):452-457. Hu F, Sigal R, Rich-Edwards J. Walking compared with vigorous physical activity and risk of type II diabetes mellitus in women: A prospective study. Journal of the American Medical Association. 1999;282:1433-1439. Paffenbarger R, Blair S, Lee I, Hyde R. Measurement of physical activity to assess health effects in free-living populations. Medicine and Science in Sports and Exercise. 1993;25(1):60-70. Pate R, Pratt M, Blair S, et al. Physical activity and public health. A recommendation from the Centers for Disease Control and Prevention and the American College of Sports Medicine. Journal of the American Medical Association. 1995;273(5):402-407. Tracy R. Is visceral adiposity the enemy within? Arteriosclerosis Thrombosis and Vascular Biology. 2001;21(6):881-883. Ford E. Does exercise reduce inflammation? Physical activity and Creactive protein among U.S. adults. Diabetes Care. 2002;15(12):561-568. 131
59.
60. 61.
62.
63.
64.
65.
66. 67.
68.
69.
70.
71.
72.
73.
Pirro M, Mauriege P, Tchernof A, et al. Plasma free fatty acid levels and the risk of ischemic heart disease in men: Prospective results from the Quebec Cardiovascular Study. Atherosclerosis. 2002;160(2):377-384. Pirro M, Siepi D, Lupattelli G. Plasma C-reactive protein in subjects with hypo/hyperalphalipoproteinemias. Metabolism. 2003;52:432-436. Cockerill G, Rye K, Gamble J. High-density lipoproteins inhibit cytokineinduced expression of the endothelial cell adhesion molecules. Arteriosclerosis Thrombosis and Vascular Biology. 1995;15:1987-1994. von Eckardstein A, Nofer J, Assmann G. Role of cholesterol efflux and reverse cholesterol transport. Arteriosclerosis Thrombosis and Vascular Biology. 2001;21:13-27. McGill H, McMahan C, Malcom G, Oalmann M, Strong J. Effects of serum lipoproteins and smoking on atherosclerosis in young men and women. Arteriosclerosis, Thrombosis and Vascular Biology. 1997;17(1):95-106. Natali A, Vichi S, Landi P, Severi S, L'Abbate A, Ferrannini E. Coronary atherosclerosis in Type II diabetes: Angiographic findings and clinical outcome. Diabetologia. 2000;43:632-641. Aronson D, Bartha P, Zinder O, et al. Association between fasting glucose and C-reactive protein in middle-aged subjects. Diabetic Medicine. 2004;21(1):39-44. Ford E. Body mass index, diabetes, and C-reactive protein among U.S. adults. Diabetes Care. 1999;22(12):1971. Grundy S, Balady G, Criqui M, et al. Primary prevention of coronary heart disease: Guidance from Framingham: A statement for healthcare professionals from the AHA task force on risk reduction. Circulation. 1998;97(18):1876-1887. Ockene J, Kuller L, Svendsen K, Meilahn E. The relationship of smoking cessation to coronary heart disease and lung cancer in the multiple risk factor intervention trial (MRFIT). American Journal of Public Health. 1990;80(8):954-958. Sesso H, Buring J, Rifai N, Blake G, Gaziano J, Ridker P. C-reactive protein and the risk of developing hypertension. Journal of the American Medical Association. 2003;290:2945-2951. Verma S, Wang C, Li S, et al. A self fulfilling prophecy: C-reactive protein attenuates nitric oxide production and inhibits angiogenesis. Circulation. 2002;106(8):913-919. Heilbronn L, Noakes M, Clifton P. Energy restriction and weight loss on very low-fat diets reduce C-reactive protein concentrations in obese, healthy women. Arteriosclerosis Thrombosis and Vascular Biology. 2001;21:968-970. Tchernof A, Nolan A, Sites C, Ades P, Poehlman E. Weight loss reduces C-reactive protein levels in obese postmenopausal women. Circulation. 2002;105:564-569. Ridker P, Rifai N, Rose L, Buring J, Cook N. Comparison of C-reactive protein and low-density lipoprotein cholesterol levels in the prediction of 132
74. 75.
76. 77. 78.
79. 80.
81. 82.
83.
84.
85.
86. 87. 88. 89.
90.
first cardiovascular events. New England Journal of Medicine. 2002;347(20):1557-1565. Libby P, Ridker P, Maseri A. Inflammation and atherosclerosis. Circulation. 2002;105:1135-1143. Pearson T, Mensah G, Alexander R, et al. Markers of inflammation and cardiovascular disease. Application to clinical and public health practice. A statement for healthcare professionals from the Centers for Disease Control and Prevention and the American Heart Association. Circulation. 2003;107:499-511. Genest J, Pedersen T. Prevention of cardiovascular ischemic events. Circulation. 2003;107(15):2059-2065. Pearson T. New tools for coronary risk assessment. What are their advantages and limitations? Circulation. 2002;105:886-892. Danesh J, Muir J, Wong Y-K, Ward M, Gallimore J, Pepys M. Risk factors for coronary heart disease and acute-phase proteins: A population based study. European Heart Journal. 1999;20:954-959. Jacobs D, Oxley D, eds. Laboratory Test Handbook. 3rd ed. Cleveland: Lexi-Comp Inc; 2004. Ridker P. High-sensitivity C-reactive protein. Potential adjunct for global risk assessment in the primary prevention of cardiovascular disease. Circulation. 2001;103:1813-1818. Hilliard N, Waites K. C-reactive protein and ESR: What can one tell you that the other can't? Contemporary Pediatrics. 2002;19(6):64-75. Stec J, Silbershatz H, Tofler G, et al. Association of fibrinogen with cardiovascular risk factors and cardiovascular disease in the Framingham Offspring population. Circulation. 2000;102:1634-1638. Maresca G, Di Blasio A, Marchioli R, Di Minno G. Measuring plasma fibrinogen to predict stroke and myocardial infarction. Arteriosclerosis, Thrombosis, and Vascular Biology. 1999;19:1368-1377. Brown D, Giles W, Croft J. White blood cell count: An independent predictor of coronary heart disease mortality among a national cohort. Journal of Clinical Epidemiology. 2001;54(3):316-322. Febbraio M, Pedersen B. Muscle derived interleukin-6:mechanisms for activation and possible biological effects. The Federation of American Societies for Experimental Biology journal. 2002;16:1335-1347. Pedersen B, Steensberg A, Schjerling P. Muscle-derived interleukin 6: possible biological effects. Journal of Physiology. 2001;536(2):329-337. Pedersen B, Bruunsgaard H, Ostrowski K, et al. Cytokines in aging and exercise. International Journal of Sports Medicine. 2000;21(S1):S4-S9. Das U. Is Obesity an inflammatory condition? Nutrition. 2001;17:953-966. Albert C, Ma J, Rifai N, Stampher M, Ridker P. Prospective study of Creactive protein, homocysteine, and plasma lipid levels as predictors of sudden cardiac death. Circulation. 2002;105:2595-2599. Tracy R, Lemaitre R, Psaty B, et al. Relationship of C-reactive protein to risk of cardiovascular disease in the elderly: Results from the 133
91.
92.
93.
94.
95.
96. 97.
98.
99.
100.
101.
102. 103.
Cardiovascular Health Study and the Rural Health Promotion Project. Arteriosclerosis Thrombosis and Vascular Biology. 1997;17(6):1121-1127. Li J-J, Jiang H, Huang C-X, et al. Elevated levels of plasma C-reactive protein in patients with unstable angina: Its relations with coronary stenosis and lipid profile. Angiology. 2002;53(3):265-273. Ridker PM, Rifai N, Rose L, Buring JE, Cook NR. Comparison of Creactive protein and low-density lipoprotein cholesterol levels in the prediction of first cardiovascular events. New England Journal of Medicine. 2002;347(20):1557-1565. Bazzino O, Ferreiros E, Pizarro R, Corrado G. C-reactive protein and the stress tests for the risk stratification of patients recovering from unstable angina pectoris. American Journal of Cardiology. 2001;87:1235-1239. Cosin-Sales J, Pizzi C, Brown S, Kaski J. C-reactive protein, clinical presentation, and ischemic activity in patients with chest pain and normal coronary angiograms. Journal of the American College of Cardiology. 2003;41(9):1468-1474. Yudkin J, Stehouwer C, Emeis J, Coppack S. C-reactive protein in healthy subjects: Associations with obesity, insulin resistance and endothelial dysfunction: A potential role for cytokines originating from adipose tissue? Arteriosclerosis Thrombosis and Vascular Biology. 1999;19(4):972-978. Pasceri V, Willerson J, Yeh E. Direct proinflammatory effect of C-reactive protein on human endothelial cells. Circulation. 2000;102(18):2165-2168. Fichtlscherer S, Rosenberger G, Walter D, Breuer S, Dimmeler S, Zeiher A. Elevated C-reactive protein levels and impaired endothelial vascoreactivity in patients with coronary artery disease. Circulation. 2000;102(9):1000-1006. Ridker PM. High-Sensitivity C-Reactive Protein. Potential adjunct for global risk assessment in the primary prevention of cardiovascular disease. Circulation. 2001;103:1813-1818. Hubner W, Lutoslawska G, Sendecki W, Tadeusiak W. Training effects of plasma C-reactive protein level and creatine kinase activity in athletes. Physical Education and Sport. 2000;44(3):37-45. Kushner I, Sehgal A. Is high-sensitivity C-reactive protein an effective screening test for cardiovascular risk? Archives of Internal Medicine. 2002;162(8):867-869. Danesh J, Collins R, Peto R. Lipoprotein(a) and coronary heart disease: Meta-analysis of prospective studies. Circulation. 2000;102(10):10821085. Ridker PM. Clinical Application of C-reactive protein for cardiovascular disease detection and prevention. Circulation. 2003;107:363-369. Tisi P, Hulse M, Chulakadabba A, Gosling P, Shearman C. Exercise training for intermittent claudication: Does it adversely affect biochemical markers of the exercise-induced inflammatory response? European Journal of Vascular and Endovascular Surgery. 1997;14(5):344-350. 134
104.
105. 106.
107.
108.
109.
110.
111. 112.
113.
114.
115.
116.
117.
Rohde L, Hennekens CH, Ridker P. Survey of C-reactive protein and cardiovascular risk factors in apparently healthy men. American Journal of Cardiology. 1999;84:1018-1022. Pyne D. Exercise-induced muscle damage and inflammation: A review. Australian Journal of Science Medicine in Sport. 1994;26:49-58. Pyne D, Baker M, Telford R, Weidermann M. A treadmill protocol to investigate independently the metabolic and mechanical stress of exercise. Australian Journal of Science Medicine in Sport. 1997;29(3):7782. Abramson J, Vaccarino V. Relationship between physical activity and inflammation among apparently healthy middle-aged and older US adults. Archives of Internal Medicine. 2002;162:1286-1292. King D, Carek P, Mainous A, Pearson W. Inflammatory markers and exercise: Differences related to exercise type. Medicine and Science in Sports and Exercise. 2003;35(4):575-581. Fallon K, Fallon S, Boston T. The acute phase response and exercise: court and field sports. British Journal of Sports Medicine. 2001;35(3):170173. Meyer T, Gabriel H, Ratz M, Muller H, Kindermann W. Anaerobic exercise induces moderate acute phase response. Medicine and Science in Sports and Exercise. 2001;33(4):549-555. Meyers J. Exercise and cardiovascular health. Circulation. 2003;107:e2e5. Castell L, Poortmans J, Leclercq R, Brassuer M, Duchateau J, Newsholme E. Some aspects of the acute phase response after a marathon race and the effects of glutamine supplementation. European Journal of Applied Physiology and Occupational Physiology. 1997;75(1):47-53. Gleeson M, Almey J, Brooks S, Cave R, Lewis A, Griffiths H. Haematological and acute-phase responses associated with delayedonset muscle soreness in humans. European Journal of Applied Physiology and Occupational Physiology. 1995;71(2-3):137-142. Edwards D, Davis M, Brubaker P, Phillips T, Leeuwenburgh C, Braith R. Markers of inflammation are modified by exercise training in coronary artery disease. Medicine and Science in Sports and Exercise. 2002;34(5):S180. Milani R, Lavie C, Mehra M. Reduction in C-reactive protein through cardiac rehabilitation and exercise training. Journal of American College of Cardiology. 2004;43(6):1056-1061. Volk O, Neuman G. Metabolic and muscular stress parameters during an ultratriathalon. Schweizerische-Zeitschrift fuer Spormedizin und Sporttraumatologie. 1998;46(2):67-70. Irving R, Noakes T, Burger S, Myburgh K, Querido D, Van Zyl Smit R. Plasma volume and renal function during and after ultramarathon running. Medicine and Science in Sports and Exercise. 1990;22(5):581-587. 135
118.
119.
120.
121.
122.
123.
124.
125.
126.
127.
128.
129.
130.
131.
Taylor C, Rodgers G, Goodman C, et al. Hematological, iron-related, and acute phase protein responses to sustained strenuous exercise. Journal of Applied Physiology. 1987;62(2):464 - 469. Akimoto T, Furudate M, Saitoh M, et al. Increased plasma concentrations of intercellular adhesion molecule-1 after strenuous exercise associated with muscle damage. European Journal of Applied Physiology. 2002;86(3):185-190. Tanasescu M, Leitzmann M, Rimm E, Willett W, Stampfer M, Hu F. Exercise type and intensity in relation to coronary heart disease in men. Journal of the American Medical Association. 2002;288(16):1994-2000. LaMonte M, Durstine L, Yanowitz F, et al. Cardiorespiratory fitness and Creactive protein among a tri-ethnic sample of women. Circulation. 2002;106:403-406. Church T, Barlow C, Earnest C, Kampert J, Priest E, Blair S. Associations between cardiorespiratory fitness and C-reactive protein in men. Arteriosclerosis Thrombosis and Vascular Biology. 2002;22:1869-1876. Chen K, Bassett D. The technology of accelerometry-based activity monitors: Current and future. Medicine and Science in Sports and Exercise. 2005;37(11):S490-S500. Kohl H. Physical activity and cardiovascular disease: Evidence for a dose response. Medicine and Science in Sports and Exercise. 2001;33(6):S472-S483. Cox C. Physiological and psychological measurements of dogsled drivers during the 1049 mile Iditarod trail sled dog race [Dissertation]: Health and Human Performance, The University of Montana; 2004. Gordon T, Kannel W. Premature mortality from coronary heart disease. The Framingham Study. Journal of the American Medical Association. 1971;215(10):1617-1625. Helmrich S, Ragland D, Paffenbarger R. Prevention of non-insulindependent diabetes mellitus with physical activity. Medicine and Science in Sports and Exercise. 1994;26(7):824-830. Blair S, Kohl H, Barlow C, Paffenbarger R, Gibbons L, Macera C. Changes in physical fitness and all-cause mortality. A prospective study of healthy and unhealthy men. Journal of the American Medical Association. 1995;273(14):1093-1098. Blair S, Wei M, Lee C. Cardiorespiratory fitness determined by exercise heart rate as a predictor of mortality in the Aerobics Center Longitudinal Study. Journal of Sports Sciences. 1998;16(S):S47-S55. Blair S, Kohl H, Paffenbarger R, Clark D, Cooper K, Gibbons L. Physical fitness and all-cause mortality: A prospective study of healthy men and women. Journal of the American Medical Association. 1989;262(15):23952401. Lee I, Sesso H, Paffenbarger R. Physical activity and coronary heart disease risk in men: Does the duration of exercise episodes predict risk? Circulation. 2000;102(9):981-986. 136
132.
133.
134.
135. 136.
137.
138. 139.
140.
141.
142.
143.
144.
145.
146.
Schneider P, Crouter S, Bassett D. Pedometer measures of free-living physical activity: Comparison of 13 models. Medicine and Science in Sports and Exercise. 2004;36(2):331-335. Masurier G, Tudor-Locke C. Comparison of pedometer and accelerometer accuracy under controlled conditions. Medicine and Science in Sports and Exercise. 2003;35(5):867-871. Schneider P, Crouter S, Lukajic O, Bassett D. Accuracy and reliability of 10 pedometers for measuring steps over a 400-m walk. Medicine and Science in Sports and Exercise. 2003;35(10):1779-1784. Tudor-Locke C, Myers A. Challenges and opportunities for measuring physical activity in sedentary adults. Sports Medicine. 2001;31(2):91-100. Crouter S, Schneider P, Karabulut M, Bassett D. Validity of 10 electronic pedometers for measuring steps, distance, and energy cost. Medicine and Science in Sports and Exercise. 2003;35(8):1455-1460. Welk G. Principles of design and analysis for the calibration of accelerometry-based activity monitors. Medicine and Science in Sports and Exercise. 2005;37(11):S501-S511. Matthews C. Calibration of accelerometer output for adults. Medicine and Science in Sports and Exercise. 2005;37(11):S512-S522. Leenders N, Sherman W, Nagaraja H. Comparison of four methods of estimating physical activity in adult women. Medicine & Science in Sports & Exercise. 2002;32:1320-1326. Matthews C, Ainsworth B, Thompson R, Bassett D. Sources of variance in daily physical activity levels as measured by an accelerometer. Medicine and Science in Sports and Exercise. 2002;34(8):1376-1381. Wong M, Day N, Luan J, Chan K, Wareham N. The detection of geneenvironment interaction for continuous traits: should we deal with measurement error by bigger studies or better measurement? International Journal of Epidemiology. 2003;32:51-57. Trost S, McIver K, Pate R. Conducting accelerometer-based activity assessments in field-based research. Medicine and Science in Sports and Exercise. 2005;37(11):S531-S543. Levine J, Baukol P, Westerterp K. Validation of the Tracmor triaxial accelerometer system for walking. Medicine and Science in Sports and Exercise. 2001;33:1593-1597. Kochersberger G, McConnell E, Kuchibhatla M, Pieper C. The reliability, validity, and stability of a measure of physical activity in the elderly. Archives of Physical Medicine and Rehabilitation. 1996;77:793-795. Tudor-Locke C, Ainsworth B, Thompson R, Matthews C. Comparison of pedometer and accelerometer measures of free-living physical activity. Medicine and Science in Sports and Exercise. 2002;34(12):2045-2051. Plasqui G, Westerterp K. Accelerometry and heart rate as a measure of physical fitness: Proof of concept. Medicine and Science in Sports and Exercise. 2005;37(5):872-876. 137
147. 148. 149.
150.
151.
152.
153.
154.
155.
156.
157.
158.
159.
160.
161.
Robergs R, Roberts S. Exercise Physiology: Exercise, Performance, and Clinical Applications. St Louis: Mosby; 1997. Francis K. Fitness assessment using step tests. Comprehensive Therapy. 1987;13(4):36-41. Meyer K, Samek L, Schwaibold M, et al. Interval training in patients with severe chronic heart failure: Analysis and recommendations for exercise procedures. Medicine and Science in Sports and Exercise. 1997;29(3):306-312. McArdle W, Ketch F, Ketch V. Exercise Physiology. Energy, Nutrition, & Human Performance. 6th ed. Philadelphia, Pennsylvania: Lippincott, Williams and Wilkins; 2007. Myers J, Ashley E. Exercise and the heart. Dangerous curves. A perspective on exercise, lactate and the anaerobic threshold. Chest. 1997;111:787-795. Gaskill S. Effect of pre-training ventilatory threshold on pre- to posttraining changes in ventilatory threshold and maximal aerobic capacity: The HERITAGE Family Study [Dissertation]: Exercise Physiology, University of Minnesota; 1998. Wasserman K, Stringer W, Casaburi R, Koike A, Cooper C. Determination of the anaerobic threshold by gas exchange: Biochemical considerations, methodology and physiological effects. Zeitschrift fur Kardiologie. 1994;83(S3):S1-S12. Davis J, Vodak P, Wolmore J, Vodak J, Kurtz P. Anaerobic threshold and maximal aerobic power for three modes of exercise. Journal of Applied Physiology. 1976;41(2):544-550. Caiozzo V, Davis J, Ellis J, et al. A comparison of gas exchange indices used to detect the anaerobic threshold. Journal of Applied Physiology. 1982;53(5):1184-1189. Gaskill S, Ruby B, Walker A, Sanchez O, Serfass R, Leon A. Validity and reliability of combining three methods to determine ventilatory threshold. Medicine and Science in Sports and Exercise. 2001;33(11):1841-1848. Amann M, Subudhi A, Walker J, Eisenman P, Shultz B, Foster C. An evaluation of the predictive validity and reliability of ventilatory threshold. Medicine and Science in Sports and Exercise. 2004;36(10):1716-1722. Volkov N, Shirkovets E, Borilkevich V. Assessment of aerobic and anaerobic capacity of athletes in treadmill running tests. European Journal of Applied Physiology and Occupational Physiology. 1975;34(2):121-130. Beaver W, Wasserman K, Whipp B. A new method for detecting anaerobic threshold by gas exchange. Journal of Applied Physiology. 1986;60(6):2020-2027. Gitt A, Winter U, Fritsch J, et al. Comparison of the four respiratory determination methods for the anaerobic threshold. Zeitschrift fur Kardiologie. 1994;83(S3):S37-S42. Wasserman K, Beaver W, Whipp B. Gas exchange theory and the lactic acidosis (anaerobic) threshold. Circulation. 1990;81(1 S):II 14-30. 138
162.
163.
164.
165.
166.
167. 168.
169.
170.
171.
172. 173.
174.
175.
Laukkanen J, Kurl S, Salonen R, Rauramaa R, Salonen J. The predictive value of cardiorespiratory fitness for cardiovascular events in men with various risk profiles: A prospective population-based cohort study. European Heart Journal. 2004;25(16):1428-1437. Farrell S, Kampert J, Kohl H, et al. Influences of cardiorespiratory fitness levels and other predictors on cardiovascular disease mortality in men. Medicine and Science in Sports and Exercise. 1998;30(6):899-905. Kampert JB, Blair SN, Barlow CE, Kohl HW. Physical activity, physical fitness and all cause cancer mortality: A prospective study of men and women. Annals of Epidemiology. 1996(6):452-457. Gregg E, Cauley J, Stone K, et al. Relationship of changes in physical activity and mortality among older women. Journal of the American Medical Association. 2003;289(18):2379-2386. Paffenbarger R, Wing A, Hyde R. Physical activity as an index of heart attack risk in college alumni. American Journal of Epidemiology. 1978;108(3):161-175. Paffenbarger R, Lee I. A natural history of athleticism, health and longevity. Journal of Sports Sciences. 1998;16(S):S31-S45. Williams P. The illusion of improved physical fitness and reduced mortality. Medicine and Science in Sports and Exercise. 2003;35(5):736740. Tamai M, Kubota M, Ikeda M, et al. Usefulness of anaerobic threshold for evaluating daily life activity and prescribing exercise to the healthy subjects and patients. Journal of Medical Systems. 1993;17(3/4):219-225. Tanaka K, Takeshima N, Kato T, Niihata S, Ueda K. Critical determinants of endurance performance in middle-aged and elderly endurance runners with heterogeneous training habits. European Journal of Applied Physiology. 1990;59:443-449. Henritze J, Weltman A, Schurrer R, Barlow K. The effects of training at and above the lactate threshold on the lactate threshold and maximal oxygen uptake. European Journal of Applied Physiology. 1985;54(84-88). Borg G. Psychological bases of perceived exertion. Medicine and Science in Sports and Exercise. 1982;14(5):377-381. Perez-Landaluce J, Fernandez-Garcia B, Rodriguez-Alonso M, et al. Physiological differences and rating of perceived exertion (RPE) in professional, amateur and young cyclists. Journal of Sports Medicine and Physical Fitness. 2002;42(4):389-395. Swaine I, Emmett J, Murty D, Dickinson C, Dudfield M. Rating of perceived exertion and heart rate relative to ventilatory threshold in women. British Journal of Sports Medcine. 1995;29(1):57-60. Feriche B, Chicharro J, Vaquero A, Perez M, Lucia A. The use of a fixed value of RPE during a ramp protocol. Comparison with the ventilatory threshold. Journal of Sports Medicine and Physical Fitness. 1998;38(1):35-38. 139
176. 177.
178.
179.
180.
181.
182.
183.
184.
185.
186. 187.
188.
189.
190.
Lee I, Sesso H, Oguma Y, Paffenbarger R. The "weekend warrior" and risk of mortality. American Journal of Epidemiology. 2004;160(7):636-641. Oguma Y, Sesso HD, Paffenbarger RS, Lee IM. Physical activity and all cause mortality in women: A review of the evidence. British Journal of Sports Medicine. 2002;36(3):162-172. Williams P. Relationship of distance run per week to coronary heart disease factors in 8283 male runners. The National Runners' Health Study. Archives of Internal Medicine. 1997;157(2):191-198. Lee I, Skerrett P. Physical activity and all-cause mortality: What is the dose-response relation? Medicine and Science in Sports and Exercise. 2001;33(6S):S459-S471. Drygas W, Kostka T, Jegier A, H K. Long-term effects of different physical activity levels on coronary heart disease risk factors in middle-aged men. International Journal of Sports Medicine. 2000;21(4):235-241. Manson J, Greenland P, LaCroix A, et al. Walking compared with vigorous exercise for the prevention of cardiovascular events in women. New England Journal of Medicine. 2002;347(10):716-725. Hakim A, Curb J, Petrovitch H, et al. Effects of walking on coronary heart disease in elderly men: the Honolulu Heart Program. Circulation. 1999;100(1):9-13. Lee I, Sesso H, Oguma Y, Paffenbarger R. Relative intensity of physical activity and risk of coronary heart disease. Circulation. 2003;107(8):11101116. Kannel W, Castelli W, McNamara P. The coronary profile: 12-year followup in the Framingham study. Journal of Occupational Medicine. 1967;9(12):611-619. Kannel W. Habitual level of physical activity and risk of coronary heart disease: the Framingham study. Canadian Medical Association Journal. 1967;96(12):811-812. Williams P. Relationships of heart disease risk factors to exercise quantity and intensity. Archives of Internal Medicine. 1998;158(3):237-245. Yu S, Yarnell J, Sweetnam P, Murray L. What level of physical activity protects against premature cardiovascular death? The Caerphilly study. Heart. 2003;89:502-506. Lee I, Paffenbarger R. How much physical activity is optimal for health? Methodological considerations. Research Quarterly for Exercise and Sport. 1996;67(2):206-208. Godefroi R, Klementowicz P, Pepler C, Lewis B, McDonough K, Goldberg R. Levels of, and factors associated with, C-reactive protein in employees attending a company-sponsored cardiac screening program. Cardiovascular Epidemiology and Prevention. 2005;103:180-184. Saito M, Ishimitsu T, Minami J, Ono H, Ohrui M, Matsuoka H. Relations of plasma high-sensitivity C-reactive protein to traditional cardiovascular risk factors. Atherosclerosis. 2003;167:73-79. 140
191.
192.
193.
194.
195.
196.
197.
198.
199.
200.
201.
202.
Ryu S, Lee Y, Park J, Kang M, Kim K. Relations of plasma high-sensitivity C-reactive protein to various cardiovascular risk factors. Journal of Korean Medical Science. 2005;20:379-383. Raitakari M, Mansikkaniemi K, Marniemi J, Viikari J, Raitakari O. Distribution and determinants of serum high-sensitive C-reactive protein in a population of young adults. The Cardiovascular Risk in Young Finns Study. Journal of Internal Medicine. 2005;258(428-434). Kondo N, Nomura M, Nakaya Y, Ito S, Ohguro T. Association of inflammatory marker and highly sensitive C-reactive protein with aerobic exercise capacity, maximum oxygen uptake and insulin resistance in healthy middle-aged volunteers. Circulation. 2005;69(4):452-457. Depres J-P. CRP and risk of coronary heart disease: Can exercise training cool down the flames? Arteriosclerosis Thrombosis and Vascular Biology. 2004;24:1743-1745. Giannopoulou I, Fernhall B, Carhart R, et al. Effects of diet and/or exercise on the adipocytokine and inflammatory cytokine levels of postmenopausal women with type 2 diabetes. Metabolism. 2005;54:866-875. Okita K, Nishijima H, Murakami T, et al. Can exercise training with weight loss lower serum C-reactive protein levels? Arteriosclerosis Thrombosis and Vascular Biology. 2004;24(10):1868-1873. Nassis G, Papantakou K, Skenderi K, et al. Aerobic exercise training improves insulin sensitivity without changes in body weight, body fat, adiponectin, and inflammatory markers in overweight and obese girls. Metabolism. 2005;54:1472-1479. Aronson D, Sella R, Sheikh-Ahmad M, et al. The association between cardiorespiratory fitness and C-reactive protein in subjects with the metabolic syndrome. Journal of the American College of Cardiology. 2004;44:2003-2007. Borodulin K, Laatikainen T, Salomaa V, Jousilahti P. Associations of leisure time physical activity, self-rated physical fitness, and estimated aerobic fitness with serum C-reactive protein among 3803 adults. Atherosclerosis. 2005;185(2):381-7. Pitsavos C, Panagiotakos DB, Chrysohoou C, Kavouras S, Stefanadis C. The associations between physical activity, inflammation, and coagulation markers, in people with metabolic syndrome: The ATTICA study. European Journal of Cardiovascular Prevention and Rehabilitation. 2005;12:151-158. Goldhammer E, Tanchilevitch A, Maor I, Beniamini Y, Rosenchein U, Sagiv M. Exercise training modulates cytokines activity in coronary heart disease patients. International Journal of Cardiology. 2005;100:93-99. Blair S, Jackson A. Physical fitness and activity as separate heart disease risk factors: A meta-analysis. Medicine and Science in Sports and Exercise. 2001;33(5):762-764.
141
203.
204. 205.
206.
207.
208.
209.
210. 211.
212.
213.
214.
215.
216.
217.
Leon A, Gaskill S, Rice T, et al. Variability in the response of HDL cholesterol to exercise training in the HERITAGE Family Study. International Journal of Sports Medicine. 2002;23(1):1-9. Sullivan DR. Screening for cardiovascular disease with cholesterol. Clinica Chimica Acta. 2001;315:49-60. Hultquist C, Albright C, Thompson D. Comparison of walking recommendations in previously inactive women. Medicine and Science in Sports and Exercise. 2005;37(4):676-683. Swartz A, Strath S, Bassett D, et al. Increasing daily walking improves glucose tolerance in overweight women. Preventive Medicine. 2003;37(4):356-362. Dunn A, Garcia M, Marcus B, Kampert J, Kohl H, Blair S. Six-month physical activity and fitness changes in Project Active, a randomized trial. Medicine and Science in Sports and Exercise. 1998;30(7):1076-1083. Macfarlane D, Taylor L, Cuddihy T. Very short intermittent vs continuous bouts of activity in sedentary adults. Preventative Medicine. 2006;43(4):332-336. Hatano Y. Use of the pedometer for promoting daily walking exercise. International Council for Health, Physical Education and Recreation. 1993:294-328. Tudor-Locke C, Bassett D. How many steps/day are enough?: Preliminary pedometer indices for public health. Sports Medicine. 2004;34(1):1-8. Welk G, Differding J, Thompson R, Blair S, Dziura J, Hart P. The utility of the Digi-Walker step counter to assess daily physical activity patterns. Medicine and Science in Sports and Exercise. 2000;32(9 Suppl):S481488. Wilde B, Sidman C, Corbin C. A 10,000 step count as a physical activity target for sedentary women. Research Quarterly for Exercise and Sport. 2001;72(4):411-415. Bock B, Marcus B, Pinto B. Maintenance of physical activity following an individualized motivationally tailored intervention. Annals of Behavioral Medicine. 2001;23(2):79-87. Dunn A, Andersen R, Jakicic J. Lifestyle physical activity interventions. History, short- and long-term effects, and recommendations. American Journal of Preventative Medicine. 1998;15(4):398-412. Titze S, Martin B, Seiler R, Stronegger W, Marti B. Effects of a lifestyle physical activity intervention on stages of change and energy expenditure in sedentary employees. Psychology of Sport and Exercise. 2001;2:103116. Le Masurier G, Sidman C, Corbin C. Accumulating 10,000 steps: Does this meet current physical activity guidelines? Research Quarterly for Exercise and Sport. 2003;74(4):389-394. Tudor-Locke C, Bell R, Myers A, et al. Controlled outcome evaluation of the First Step Program: A daily physical activity intervention for individuals with type II diabetes. International Journal of Obesity. 2006;28(1):113-119. 142
218.
219.
220. 221.
222.
223.
224. 225.
226.
227.
228.
229.
230.
231.
Araiza P, Hewes H, Gashetewa C, Vella C, Burge M. Efficacy of a pedometer-based physical activity program on parameters of diabetes control in type 2 diabetes mellitus. Metabolism Clinical and Experimental. 2006;55:1382-1387. Iwane M, Arita M, Tomimoto S, et al. Walking 10,000 steps/day or more reduces blood pressure and sympathetic nerve activity in mild essential hypertension. Hypertension Research. 2000;23:573-580. Johnson S. The impact of calculated ambulation on health promotion. The American Black Nursing Forum Journal. 2005;16(2):33-38. Arraix G, Wigle D, Mao Y. Risk assessment of physical activity and physical fitness in the Canada Health Survey follow-up study. Journal of Clinical Epidemiology. 1992;45(4):419-428. Frohlich E, Grim C, Labarthe D, Maxwell M, Perloff D, Weidman W. Recommendations for human blood pressure determination by sphygmomanometers: Report of a special task force appointed by the steering committee, American Heart Association. Circulation. 1988;77(2):502a-514a. American College of Sports Medicine. ACSM's Guidelines for Exercise Testing and Prescription. 7th ed. Philadelphia: Lippincott, Williams & Wilkins; 2006. Blair S, Dunn A, Marcus B, Carpenter R, Jaret P. Active Living Everyday. 20 Steps to Lifelong Vitality. Champaign, IL: Human Kinetics; 2001. Dunn A, Marcus B, Kampert J, Garcia M, Kohl H, Blair S. Reduction in cardiovascular disease risk factors: 6-month results from Project Active. Preventative Medicine. 1997;26(6):883-892. Kohl H, Dunn A, Marcus B, Blair S. A randomized trial of physical activity interventions: Design and baseline data from Project Active. Medicine and Science in Sports and Exercise. 1998;30(2):275-283. Debusk R, Stenestrand U, Sheehan M, Haskell W. Training effects of long versus short bouts of exercise in healthy subjects. American Journal of Cardiology. 1990;65:1010-1013. Jakicic J, Wing R, Butler B, Robertson R. Prescribing exercise in multiple short bouts versus one continuous bout: Effects on adherence, cardiorespiratory fitness and weight loss in overweight women. International Journal of Obesity. 1995;19:893-901. Two Feathers J, Kieffer E, Palmisano G, et al. Racial and ethnic approaches to community health (REACH) Detroit partnership: Improving diabetes-related outcomes among african american and latino adults. American Journal of Public Health. 2005;95(9):1552-1560. Di Loreto C, Fanelli C, Lucidi P, et al. Make your diabetic patients walk: Long-term impact of different amounts of physical activity on type 2 diabetes. Diabetes Care. 2005;28:1295-1302. Thomas L, Williams M. Promoting physical activity levels in the workplace: Using pedometers to increase daily activity. Health Promotion Journal of Australia. 2006;17(2):97-102. 143
232.
233.
234.
235.
236.
237. 238.
239. 240.
241. 242. 243. 244.
245.
246.
Kelley G, Kelley K, Tran Z. Walking, lipids and lipoproteins: A metaanalysis of randomized control trials. Preventive Medicine. 2004;38(5):651-661. Okura T, Natata Y, Tanaka K. Effects of exercise intensity on physical fitness and risk factors for coronary heart disease. Obesity Research. 2003;11(9):1131-1139. Mensink G, Heerstrass D, Neppelenbroek S, Schuit A, Bellach B. Intensity, duration and frequency of physical activity and coronary risk factors. Medicine and Science in Sports and Exercise. 1997;29(9):11921198. Brinkworth G, Noakes M, Buckley J, Clifton P. Weight loss improves heart rate recovery in overweight and obese men with features of the metabolic syndrome. American Heart Journal. 2006;152(4):E1-E6. Pritchett A, Foreyt J, Mann D. Treatment of the metabolic syndrome: The impact of lifestyle modification. Current Atherosclerosis Reports. 2005;7(2):95-102. Sykes K, Choo L, Cotterrell M. Accumulating aerobic exercise for effective weight control. Journal of the Royal Society of Health. 2004;124(1):24-28. Rosamond W, Flegal K, Friday G, et al. Heart disease and stroke statistics-2007 update. A report from the American Heart Association statistics committee and Stroke statistics subcommittee. Circulation. 2007;115:e69-e171. Kannel W, Sorlie P. Some health benefits of physical activity. The Framingham Study. Archives of Internal Medicine. 1979;139(8):857-861. Fletcher G, Blair S, Blumenthal J, et al. Statement on exercise. Benefits and recommendations for physical activity programs for all Americans. A statement for health professionals by the Committee on Exercise and Cardiac Rehabilitation of the Council on Clinical Cardiology, American Heart Association. Circulation. 1992;86(1):340-344. Wilson P, D'Agostino R, Levy D. Prediction of coronary heart disease using risk factor categories. Circulation. 1998;97:1837-1847. Wilson P. Established risk factors in coronary artery disease, the Framingham study. American Journal of Hypertension. 1994;7:S7-S12. Warburton D, Nicol C, Bredin S. Health benefits of physical activity: The evidence. Canadian Medical Association Journal. 2006;174(6):801-809. Sternfeld B, Bhat A, Wang H, Sharp T, Quesenberry C. Menopause, physical activity and body composition/fat distribution in midlife women. Medicine and Science in Sports and Exercise. 2005;37(7):1195-1202. Page A, Cooper A, Stamatakis E, et al. Physical activity patterns in nonobese and obese children assessed using minute-by-minute accelerometry. International Journal of Obesity. 2005;29(9):1070-1076. Hughes A, Henderson A, Ortiz-Rodriquez V, Artinou M, Reilly J. Habitual physical activity and sedentary behaviour in a clinical sample of obese children. International Journal of Obesity. 2006;10:1494-1500. 144
247.
248.
249.
250.
251.
252.
253.
254. 255. 256. 257.
258.
259.
260.
Padilla J, Wallace J, Park S. Accumulation of physical activity reduces blood pressure in pre- and hypertension. Medicine and Science in Sports and Exercise. 2005;37(8):1264-1275. Mini-Mitter. Actical technical data. Mini Mitter. Available at: http://www.minimitter.com/Products/Brochures/Actical%20Tech%20Sheet %202006.pdf. Accessed December 8, 2007. Buchowski M, Acra S, Majchrzak K, Sun M, Chen K. Patterns of physical activity in free-living adults in the southern United States. European Journal of Clinical Nutrition. 2004;58:828-837. Chobanian A, Bakris G, Black H, Cushman W, Green L, Izzo J. The seventh report of the Joint National Committee on prevention, detection, evaluation, and treatment of high blood pressure: the JNC 7 report. Journal of the American Medical Association. 2003;289:1560–2572. National Cholesterol Education Program. Expert panel on detection, evaluation and treatment of high blood cholesterol in adults. Summary of the second report of the National Cholesterol Education Program (NCEP) adult treatment panel II. Journal of the American Medical Association. 1993;269:3015-3023. American College of Sports Medicine. Resource Manual for Guidelines for Exercise Testing and Prescription. 4th ed. Baltimore, MD: Lippincott, Williams & Wilkins; 2001. National Heart Lung Blood Institute Expert Panel on the Identification Evaluation and Treatment of Overweight and Obesity in Adults. Clinical guidelines on the identification, evaluation, and treatment of overweight and obesity in adults: the evidence report. Obesity Research. 1998;6(S2):S51-S209. American Diabetes Association. Standards of medical care in diabetes. Diabetes Care. 2004;27:S15–S35. Heil D. Predicting activity energy expenditure using the Actical Activity Monitor. Research Quarterly for Exercise and Sport. 2006;77(1):64-80. Warburton D, Nicol C, Bredin S. Prescribing exercise as preventive therapy. Canadian Medical Association Journal. 2006;174(7):961-974. Bouchard C, Dionne F, Simoneau J, Boulay M. Genetics of aerobic and anaerobic performance. Exercise and Sports Science Reviews. 1992;20(1):27-58. Bouchard C, Daw E, Rice T, et al. Familial resemblance for VO2max in the sedentary state: the HERITAGE family study. Medicine and Science in Sports and Exercise. 1998;30(2):252-258. Eaton C, LaPane K, Garber C, Assaf A, Lasater T, Carleton R. Physical activity, physical fitness, and coronary heart disease risk factors. Medicine and Science in Sports and Exercise. 1995;27(3):340-346. Hendelman D, Miller K, Baggett C, Debold E, Freedson P. Validity of accelerometry for the assessment of moderate intensity physical activity in the field. Medicine and Science in Sports and Exercise. 2000;32(9):S442S449. 145
261.
262.
263.
264. 265. 266. 267. 268.
269.
270. 271.
272. 273.
274.
275.
276.
Bassett D, Ainsworth B, Swartz A, Strath S, O'Brian W, King G. Validity of four motion sensors in measuring moderate intensity physical activity. Medicine and Science in Sports and Exercise. 2000;32(9):S471-S480. Swartz A, Strath S, Bassett D, O'Brian W, King G, Ainsworth B. Estimation of energy expenditure using CSA accelerometers at hip and wrist sites. Medicine and Science in Sports and Exercise. 2000;32(9):S450-S456. Roth E. Heart disease in patients with stroke: Incidence, impact, and implications for rehabilitation. Part 1: Classification and prevalence. Archives of Physical Medicine and Rehabilitation. 1993;74(7):752-760. Lee I, Paffenbarger R. Physical activity and stroke incidence: The Harvard health alumni study. Stroke. 1998;29:2049-2054. Lee C, Blair S. Cardiorespiratory fitness and stroke mortality in men. Medicine and Science in Sports and Exercise. 2002;34(4):592-595. Lee C, Folsom A, Blair S. Physical activity and stroke risk: A metaanalysis. Stroke. 2003;34(10):2475-2481. Ivey F, Macko R, Ryan A, Hafer-Macko C. Cardiovascular health and fitness after stroke. Topics in Stroke Rehabilitation. 2005;12(1):1-16. Gordon N, Gulanick M, Costa F, et al. Physical activity and exercise recommendations for stroke survivors: An American Heart Association scientific statement from the council on clinical cardiology, subcommittee on exercise, cardiac rehabilitation, and prevention; the council on cardiovascular nursing; the council on nutrition, physical activity, and metabolism; and the stroke council. Circulation. 2004;109:2031-2041. MacKay-Lyons M, Howlett J. Exercise capacity and cardiovascular adaptations to aerobic training early after stroke. Topics in Stroke Rehabilitation. 2005;12(1):31-44. Rimmer J, Wang E. Aerobic exercise training in stroke survivors. Topics in Stroke Rehabilitation. 2005;12(1):17-30. Gresham G, Kelly-Hayes M, Wolf P, Beiser A, Kase C, D'Agostino R. Survival and functional status 20 or more years after first stroke: The Framingham Study. Stroke. 1998;29(4):793-797. Shephard R. PAR-Q, Canadian home fitness test and exercise screening alternatives. Sports Medicine. 1998;5(3):185-195. Washburn R, Zhu W, McAuley E, Frogley M, Figoni S. The physical activity scale for individuals with physical disabilities: Development and evaluation. Archives of Internal Medicine. 2002;83(2):193-200. Amar J, Cambou J, Touze E, et al. Comparison of hypertension management after stroke and myocardial infarction: Results from ECLAT1 - a French nationwide study. Stroke. 2004;35(7):1579-1583. Sacco R, Adams R, Albers G, et al. Guidelines for prevention of stroke in patients with ischemic stroke or transient ischemic attack. Stroke. 2006;37(2):577-617. Antikainen R, Jousilahti P, Tuomilehto J. Systolic blood pressure, isolated systolic hypertension and risk of coronary heart disease, strokes, 146
277.
278.
279.
280.
281.
282.
283.
284.
285.
286.
287.
288.
cardiovascular disease and all-cause mortality in the middle-aged population. Journal of Hypertension. 1998;16(5):577-583. Prospective Studies Collaboration. Age-specific relevance of usual blood pressure to vascular mortality: A meta-analysis of individual data for one million adults in 61 prospective studies. Lancet. 2002;360(9349):19031913. Vasan R, Larson M, Leip E, et al. Impact of high-normal blood pressure on the risk of CVD. New England Journal of Medicine. 2001;345(18):12911297. Kshirsagar A, Carpenter M, Bang H, Wyatt S, Colindres R. Blood pressure usually considered normal is associated with an elevated risk of cardiovascular disease. The American Journal of Medicine. 2006;119(2):133-141. Wannamethee S, Shaper A, Walker M. Overweight and obesity and weight change in middle aged men: Impact on cardiovascular disease and diabetes. Journal of Epidemiology of Community Health. 2005;59(2):134139. Domanski M, Jablonski K, Rice M, Fowler S, Braunwald E. Obesity and cardiovascular events in patients with established coronary disease. European Heart Journal. 2006;27(12):1416-1422. Zhou B. Effect of body mass index on all-cause mortality and incidence of cardiovascular diseases-report for meta-analysis of prospective studies open optimal cut-off points of body mass index in Chinese adults. Biomedical and Environmental Sciences. 2002;15(3):245-252. Dagenais G, Yi Q, Mann J, Bosch J, Pogue J, Yusuf S. Prognostic impact of body weight and abdominal obesity in women and men with cardiovascular disease. American Heart Journal. 2005;149(1):54-60. Milionis H, Filippatos T, Derdemezis C, et al. Excess body weight and risk of first-ever acute ischaemic non-embolic stroke in elderly subjects. European Journal of Neurology. 2007;14(7):762-769. Purroy F, Montaner J, Molina C, et al. C-reactive protein predicts further ischemic events in transient ischemic attack patients. Acta Neurologica Scandinavica. 2007;115(1):60-66. Ridker P, Hennekens C, Buring J, Rifai N. C-reactive protein and other markers of inflammation in the prediction of cardiovascular disease in women. New England Journal of Medicine. 2000;342(12):836-843. Gussekloo J, Schaap M, Frohlich M, Blauw G, Westendorp R. C-reactive protein is a strong but nonspecific risk factor for fatal stroke in elderly persons. Arteriosclerosis Thrombosis and Vascular Biology. 2000;20(4):1047-1051. Rost N, Wolf P, Kase C, et al. Plasma concentration of C-reactive protein and risk of ischemic stroke and transient ischemic attack the Framingham Study. Stroke. 2001;32(11):2575-2579.
147
289.
290.
291.
292.
293.
294. 295. 296.
297.
298.
299.
300.
301.
Woodward M, Lowe G, Campbell D, et al. Associations of inflammatory and hemostatic variables with the risk of recurrent stroke. Stroke. 2005;36(10):2143-2147. Tommasi S, Carluccio E, Bentivoglio M, et al. C-reactive protein as a marker for cardiac ischemic events in the year after a first, uncomplicated myocardial infarction. American Journal of Cardiology. 1999;83(12):15951599. Di Napoli M, Papa F. Inflammation, hemostatic markers, and antithrombotic agents in relation to long-term risk of new cardiovascular events in first-ever ischemic stroke patients. Stroke. 2002;33:1763-1771. Ascott-Evans B. The metabolic syndrome, insulin resistance and cardiovascular disease. Cardiovascular Journal of South Africa. 2002;13(4):187-188. National Cholesterol Education Program. Executive summary of the third report of the national cholesterol education program (NCEP) expert panel on detection, evaluation, and treatment of high blood cholesterol in adults (Adult Treatment Panel III). Journal of the American Medical Association. 2001;285(19):2486-2497. Michael K, Macko R. Ambulatory activity intensity profiles, fitness, and fatigue in chronic stroke. Topics in Stroke Rehabilitation. 2007;14(2):5-12. Shaughnessy M, Resnick B, Macko R. Testing a model of post-stroke exercise behavior. Rehabilitation Nursing. 2006;31(1):15-21. Paolucci S, Grasso M, Antonucci G, et al. Mobility status after inpatient stroke rehabilitation: 1-year follow-up and prognostic factors. Archives of Physical Medicine and Rehabilitation. 2001;82(1):2-8. Haskell W, Lee I, Pate R, et al. Physical activity and public health: Updated recommendation for adults from the American College of Sports Medicine and the American Heart Association. Medicine and Science in Sports and Exercise. 2007;39(8):1423-1434. Nelson M, Rejeski W, Blair S, et al. Physical activity and public health in older adults: Recommendation from the American College of Sports Medicine and the American Heart Association. Medicine and Science in Sports and Exercise. 2007;39(8):1435-1445. Ng S, Hui-Chan C. The timed up & go test: Its reliability and association with lower-limb impairments and locomotor capacities in people with chronic stroke. Archives of Physical Medicine and Rehabilitation. 2005;86(8):1641-1647. Flansbjer U, Holmbäck A, Downham D, Patten C, Lexell J. Reliability of gait performance tests in men and women with hemiparesis after stroke. Journal of Rehabilitation Medicine. 2005;37(2):75-82. Yang Y, Wang R, Lin K, Chu M, Chan R. Task-oriented progressive resistance strength training improves muscle strength and functional performance in individuals with stroke. Clinical Rehabilitation. 2006;20(10):860-870. 148
302. 303.
304.
305.
306. 307.
308. 309.
310.
311.
312.
313.
314.
315.
316.
Hershkovitz A, Brill S. Get up and go--home. Aging Clinical and Experimental Research. 2006;18(4):301-306. Flansbjer U, Downham D, Lexell J. Knee muscle strength, gait performance, and perceived participation after stroke. Archives of Physical Medicine and Rehabilitation. 2006;87(7):974-980. Leroux A, Pinet H, Nadeau S. Task-oriented intervention in chronic stroke: Changes in clinical and laboratory measures of balance and mobility. American Journal of Physical Medicine and Rehabilitation. 2006;85(10):820-830. Duncan P, Richards L, Wallace D, et al. A randomized, controlled pilot study of a home-based exercise program for individuals with mild and moderate stroke. Stroke. 1998;29(10):2055-2060. Duncan P, Studenski S, Richards L, et al. Randomized clinical trial of therapeutic exercise in subacute stroke. Stroke. 2003;34(9):2173-2180. Eng J, Chu K, Dawson A, Kim C, Hepburn K. Functional walk tests in individuals with stroke: Relation to perceived exertion and myocardial exertion. Stroke. 2002;33(3):756-761. Mayo N, Wood-Dauphinee S, Ahmed S, et al. Disablement following stroke. Disability and Rehabilitation. 1999;21(5-6):258-268. Pohl P. Influence of stroke-related impairments on performance in 6minute walk test. Journal of Rehabilitation Research and Development. 2002;39(4):439-444. Eng J, Dawson A, Chu K. Submaximal exercise in persons with stroke: Test-retest reliability and concurrent validity with maximal oxygen consumption. Archives of Physical Medicine and Rehabilitation. 2004;85(1):113-118. Kelly J, Kilbreath S, Davis G, Zeman B, Raymond J. Cardiorespiratory fitness and walking ability in subacute stroke patients. Archives of Physical Medicine and Rehabilitation. 2003;84(12):1780-1785. Dean C, Richards C, Malouin F. Walking speed over 10 metres overestimates locomotor capacity after stroke. Clinical Rehabilitation. 2001;15(4):415-421. Bjurö T, Fugl-Meyer A, Grimby G, Höök O, Lundgren B. Ergonomic studies of standardized domestic work in patients with neuromuscular handicap. Scandinavian Journal of Rehabiltation Medicine. 1975;7(3):106113. Zamparo P, Francescato M, De Luca G, Lovati L, di Prampero P. The energy cost of level walking in patients with hemiplegia. Scandinavian Journal of Medicine and Science in Sports. 1995;5(6):348-352. Mackay-Lyons M, Makrides L. Longitudinal changes in exercise capacity after stroke. Archives of Physical Medicine and Rehabilitation. 2004;85(10):1608-1612. Potempa K, Lopez M, Braun L, Szidon J, Fogg L, Tincknell T. Physiological outcomes of aerobic exercise training in hemiparetic stroke patients. Stroke. 1995;26(1):101-105. 149
317. 318.
319.
320.
321.
Mackay-Lyons M, Makrides L. Exercise capacity early after stroke. Archives of Physical Medicine and Rehabilitation. 2002;83(12):1697-1702. Tang A, Sibley K, Bayley M, McIlroy W, Brooks D. Do functional walk tests reflect cardiorespiratory fitness in sub-acute stroke? Journal of Neuroengineering and Rehabilitation. 2006;3(23):1-8. Patterson S, Forrester L, Rodgers M, et al. Determinants of walking function after stroke: Differences by deficit severity. Archives of Physical Medicine and Rehabilitation. 2007;88(1):115-119. Pang M, Eng J, Dawson A. Relationship between ambulatory capacity and cardiorespiratory fitness in chronic stroke: Influence of stroke-specific impairments. Chest. 2005;127(2):495-501. Macko R, DeSouza C, Tretter L, et al. Treadmill aerobic exercise training reduces the energy expenditure and cardiovascular demands of hemiparetic gait in chronic stroke patients. A preliminary report. Stroke. 1997;28(2):326-330.
150