Journal of Geography and Regional Planning Vol. 2(5), pp. 121-130, May, 2009 Available online at http://www.academicjournals.org/JGRP ISSN 2070-1845 © 2009 Academic Journals
Full Length Research Paper
Mapping as a complement of statistical/graphical approach to climate data analysis: Example from rainfall variability over the western Nigeria A. O. Eludoyin1*, O. M. Akinbode2, M. A. Oyinloye3 and A. Fadejin4 1
Department of Geography, Obafemi Awolowo University, Ile-Ife, Nigeria. Department of Geography and Planning Sciences, Adekunle Ajasin University, Akungba-Akoko, Nigeria. 3 Department of Urban and Regional Planning, Federal University of Technology, Akure, Nigeria. 4 Department of Geography, University of Ibadan, Nigeria.
2
Accepted 17 March, 2009
The challenge of insufficient network of meteorological data collection centre has been an age old problem in Africa. It is therefore necessary to encourage a technique that will ensure that data are generated for areas without them. This study is in this regard. 20 years rainfall data were collected from 5 stations in the Western region of Nigeria and analyses were carried out to detect the monthly variations in 2 decades (1985 – 1995 and 1995 – 2004). The study made use of geographic information system (GIS)’s mapping procedure and graphical methods to illustrate that mapping effectively complements the graphical/statistical method, apart from showing spatial distribution, values can be generated for areas without such data. The various maps can also be overlaid in a GIS environment to determine causes and effect of what is being studied among others. The study concluded that mapping could easily complement statistical/graphical approach to studies in spatial science, especially in modeling and data management. Key words: GIS mapping, monthly and spatial variability, climate data, western Nigeria. INTRODUCTION A spatial science typically seeks to describe and interpret the spatial objects from place to place of the earth as the world of man. A spatial object is defined as an object that is characterized by location (longitude, latitude and altitude) and attribute. The object could be represented as point, chains of points (lines) or polygon, depending on its form. This is the technique that has informed the use of geospatial analysis in geographical studies. In climate study, the problem of insufficient meteorological data has been recognized as an old age problem in Africa (Jagtap, 2008). This had probably been informed by the poor network of meteorological stations in most of the African countries. A way of solving this problem is to use the mapping technique inherent in geographical information system (GIS). A GIS is a computerized technique that involves data acquisition, storage, manipulation, analysis and information presentation aimed at solving an earth bound problem. GIS technology is not synonymous to
*Corresponding author. E-mail:
[email protected].
automated mapping (AM) because it involves the creation of digital database that can be updated, analysed and synthesized to produce user required results (Burrough, 1985). Mapping, in whatever form, usually involves interpolation which is commonly used in computer assisted mapping (CAM) and which assumed that the unknown value of a point is influenced more by nearer points than those farther away. This is quite important when the phenomena being studied (for example, rainfall as in this case) is continuous in space and are measured at points in space (at synoptic stations). Since the existence of such point is always limited in number for financial and other reasons, the mapping technique that uses interpolation becomes expedient. Statistical analyses on the other hands typically include the use of graphs and various parametric and non parametric tests. Whereas non parametric statistical tests such as Chi square, Kolmogorov–Smirnov tests, etc. derive statistics from ordinal or nominal (qualitative data) (Taylor, 1977) while parametric statistics require data that are of interval and ratio (quantitative) format. Data for parametric statistics
122
J. Geogr. Reg. Plann.
test must meet the following criteria (Taylor, 1977; Zar, 1992); (i) the observations must be independent; it must have been derived from random sampling procedures and not systematic sampling; (ii) the observations must have been drawn from a normally distributed population; non-parametric tests do not involve this condition and are sometimes referred to as distribution free; (iii) the population must have same variance (iv) and the variables must have been measured at least at the interval scale. As important as these criteria are, it is not realistic that data obtained on natural phenomena will meet them. Although, data may be transformed to meet some of the conditions, especially for normal distribution (Zar, 1992), such procedure will not make values available for the areas without data. Sneyers (1990) has also discussed the problems of statistical methods in detecting climate variability or change. For example, the parametric statistics cannot be valid for correlating sequences (Kadioglu, 1997) while non-parametric tests which are based on ranks rather than the magnitude of observations are not dependent on the correlation structure and cannot be viable for most objective tests. Again, the study by Serra et al. (2001) suggested that absolute use of the non– parametric statistics may not be adequate for the analysis of climate trend. In this paper therefore, a cartographical approach of the geographical information system is preferred to in presenting the monthly rainfall records at 5 stations scattered in the southwestern Nigeria in order to detect possible local and regional trends. Rainfall is one of the natural climatic process and a good subject for investigation on rainfall climatology in order to provide information relevant to hydrological and agricultural investigations. It is also relevant in assessing the impact of climate change and global warming since it represents the gross water volume of the southwest (and the entire) Nigeria. It is the ultimate source of the country’s water found in rivers, streams, lakes and wells. The distribution and the total amount of rainfall are important in the tropics (Ayoade, 2004) within which Nigeria lies. The start, duration and end of the rainy seasons control the agricultural activities within this region. The rainy season also brings with it lower temperatures and exercises considerable influence on the people’s way of life since it limits outdoor activities. Its variability is also important economically because it may bring widespread crop failure and famine in highly agrarian settlements. Many of the tropical countries heavily depend on rainfed agriculture to feed their teeming populations and provide exportable goods. Previous studies (e.g. Lamb, 1979; Olaniran, 1991) on rainfall trends and variability at diff-erent scales did not exploit the use of the technological development in the geographic information systems for mapping identified variability in rainfall. In addition, existing rainfall maps of the southwestern Nigeria are rather too generalized and present loose impressions of insignificant variability of rainfall in the region. Most existing atlases in the country also lack information about the monthly variation of precipitation in the region.
Rainfall, like most climate variables is characteristically continuous and because of many uncertainties and difficulties in obtaining homogeneous climatologic time series, the trends have become one of the most uncertain aspects in meteorological research (Kadioglu, 1997). Different trend detection studies have been carried out in different parts of the world, mostly for identification of climate change. Some of these cases have shown significant trend components especially during the last few decades (Karl et al. 1993; Adebayo, 1999; Serra et al. 2001). However, physical interpretations have been related at times, to the greenhouse effect, global warming, urban heat islands, aerosols and high topography that exert cooling effects on the climate (Kadioglu, 1997; Ayoade, 2005).The effects of urbanization on precipitation and temperatures also have been discussed widely in the literature (Changnon, 1992). Although variability of the climate system could be as large as the changes observed to date. Many synoptic stations in the developing countries have insufficient data to estimate its magnitude and intensity. Only less than 30 years data were available at the time of the study, hence the choice of only 2 decades (1985 -1994, 1995 - 2004) for comparison. It is therefore realized that these series are too short to define a climatic trend, hence the choice of the term ‘variability’. Thus, in this study the recent trends in the available climatological series will be analyzed without singling out climate change as their cause. MATERIALS AND METHODS This study used monthly rainfall data for 20 years (1984 – 2004) for 5 synoptic stations; Ibadan, Osogbo, Ondo, Benin City and Warri in the southwestern Nigeria (Figure 1). The data were organized into two; 1984 - 1994 and 1995 - 2004 means. These were used for the mapping of the rainfall volume in Integrated Land and Water Information System (ILWIS) software (Version 3.2 Academic). ILWIS is a geographical information systems’ raster based software written in the ITC, Eschende, Netherlands. Monthly rainfall values were used to create a point map in an already geo-referenced map of the studied area. The value point map was then interpolated using the moving average. Moving average is usually adopted when focus is on the short time fluctuation in a value of series (Gregory, 1980). This was used to generate all the value maps. The thickness of the gray colour in the maps was used to represent the abundance of rain at the particular time of interest (that is, the lighter the grey, the lighter the rain and vice versa). In addition, spatial and temporal comparisons were computed using the Analysis of variance (ANOVA) and descriptive statistics. Comparisons were based on monthly variations and differences in values of the 2 groups (1985 1994 and 1995 - 2004). The data were analyzed in order to identify meaningful variability within the decades which were made available by making use of the GIS technique. One of the effective applications of which include the following steps in sequence; (i) a map of the area of study was digitized in the ILWIS 3.2 academic software as a submap of the imported and subsequently geo-referenced Nigerian map (Figure 2a - b); (ii) point map was created for each month and decade using the coordinates and the mean monthly rainfall value as attribute for each synoptic station; (iii) the values were interpolated for each month through the region using moving averages. The moving average operation is a point interpolation which
Eludoyin et al.
123
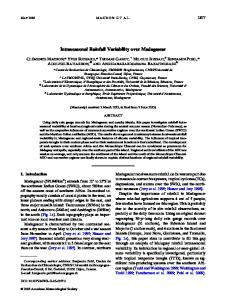
Figure 1. Map of Nigeria showing the location of the synoptic stations.
Figure 2a. A view of a geo-referenced map of Nigeria (base map) in ILWIS software window.
requires a point map as input and returns a raster map as output. Using this method, the values for the output pixels are the weighted averages of input point values. Weighted averaging is the calculation of the sum of the products of weights and point values, divid-
ed by the sum of weights. The weight function used for this study is the inverse decrease function. This function is underlined by the assumption that measured point values are accurate and local variation within a pixel is small. This function ensures that the com-
124
J. Geogr. Reg. Plann.
Figure 2b. A captured section of the study area from the base map (2a), by digitization.
puted output values equal the input point values. For each output pixel, an output value is calculated as the sum of the products of calculated weight values and point values, divided by sum of weights (1)
output _ pixel _ value =
( wi ∗ val i ) ÷
wi
(1)
And the weight factor using the inverse decrease function is given as: Weight = (1 – d*) – 1 Here in, wi and
vali
(2) are weight and point values for point i, res-
pectively. d = D/D0 = relative distance of point to output pixel D = Eucildean distance of point to output pixel D0 = Limiting distance, which is users defined n = weight exponent and (iv) classification was achieved creating representation for each map.
RESULTS AND DISCUSSION The maps generated using the moving averages of the data from the selected 5 meteorological stations in the western Nigeria are shown in Figure 3. The Figure (3) showed that rainfall has relatively declined from November to February and later increased from April to October in each of the decades studied. This incidentally interprets the seasonal classification of the southwestern Nigeria into dry and wet seasons respectively. Figure 4 also compares rainfall values in each of the month in 1985 - 1994 and 1995 - 2004. The result of the study has also shown that rainfall has fluctuated differently at different period of the year and station. For instance, the 10 years rainfall mean compared in this study revealed that the rainfall amount exhibited a decrease in February, March, May, September and October in most stations. Decrease in rainfall was also observed in 2 months in Ibadan, 6 in Warri and
Eludoyin et al.
Figure 3a. Map showing the variability of rainfall in western Nigeria.
125
126
J. Geogr. Reg. Plann.
Figure 3b. Maps showing the variability of rainfall in Western Nigeria.
Eludoyin et al.
127
Figure 3c. Maps showing the variability of rainfall in Western Nigeria.
Osogbo, and 3 months in Benin and Ondo, suggesting that while rainfall has increased for more months in Iba-
dan, Benin and Ondo, the rate of fluctuation in Warri and Osogbo may be more rapid. However, a conclusion about
128
J. Geogr. Reg. Plann.
Figure 3d. Maps showing the variability of rainfall in Western Nigeria.
about the rate of this fluctuation may yet need a consideration of data for more decadal variability. The implication
of this includes flooding in coastal settlements like Warri whose elevation is less than 10 m above the sea level
Eludoyin et al.
129
Table 1. Spatial characteristics of the selected stations used in this study.
Station Benin Ibadan Ondo Osogbo Warri
Latitude 0 6 19’ 0 7 22’ 0 7 06’ 0 7 41’ 0 5 31’
Longitude 0 5 36’ 0 3 59 0 4 50 0 4 29’ 0 5 44’
Elevation 77.8 m 227 m 287 m 302 m 6.1 m
Physiographic region Coastal Plain Inselberg landscape Inselberg landscape Inselberg landscape Creeks / lagoons
Source: Barbour et al. 1982.
Figure 4. Mean monthly distributions of rainfall for 1985 – 1994 and 1995 – 2004.
(Table 1) and other cities including Ibadan and Osogbo. In this case, wastes that were dumped along drainage channels may eventually block the drains (NEST, 1991). On the other hand, agricultural productivity will be likely to be affected by the fluctuation and it may distort the planting season. The study revealed that Ondo, Ibadan and Benin city which have been known for high agricultural yield (Adebayo, 1999)– are currently experiencing shortage of rainfall in some months within the planting season (April – June). If this trend continues, this will potentially reduce the yield, unless the farmers are adequately informed. The graphical representations of the phenomena
shown in Figures 4a and b, shows that rainfall has reduced in the latter decade than the 1985 – 1994, except in Osogbo and Ibadan. The figures showed that Benin received more mean rainfall than all other stations in May, July and December during the first decade while Warri received more rains in most months, except in October in the subsequent decade. Conclusions This study has shown that mapping could adequately
130
J. Geogr. Reg. Plann.
complement the use of statistics in climate study. The study has exemplified the use of maps as a complement to graphical/statistical approach to climate study. It has also shown that the use of maps can reveal additional information that cannot be discerned from the graphs, for example, estimation of values for areas without stations. Also, by overlaying maps on relief, drainage, soils, and vegetation etc. the impact of the variation in rainfall can be assessed. Furthermore, this study showed visual modeling of climatic change and variability could be adapted for any region. REFERENCES Adebayo WO. (1999). The spatial – temporal dynamics of temperature and rainfall fluctuations in Nigeria: Unpublished PhD thesis, Department of Geography, University of Ibadan, Nigeria. Ayoade JO (2004). Introduction to climatology for the tropics, Spectrum Books, Lagos, Nigeria. Ayoade JO (2005). Introduction to Agroclimatology, University Press, Ibadan, Nigeria. Barbour KM, Oguntoyinbo JS, Onyemelukwe JOC, Nwafor JC (1982). Nigeria in Maps, Hodder and Stonghton, London. Burrough PA (1985). Principles of GIS for Land Resources Assessment, Clarendon Press, Oxford. Changnon SA (1992). Inadvertent weather modification in urban areas: lessons for global climate change Bulletin of the American Meteorological Society 73: 619 – 627. Gregory S (1980). Statistical methods and the Geographer, Longman, 4th Edition.
Jagtap S (2007). Managing vulnerability to extreme weather and climate events: implications for agriculture and food security in Africa, Proceeding of the International conference on the impacts of extreme weather and climate on socio-economic development in Africa, 11 – 15 November pp. 1 – 15. Kadigolu M (1997). Trends in surface air temperature data over Turkey, Int. J. Climatol. 17: 511 – 520. Karl TR, Jones PD, Knight RW, Kukla G, Plummer V, Raxuvayev, P, Gallo KP, Lindseay J, Charleston RJ, Peterson TC (1993). Asymmetric trends of daily maximum and minimum temperature, Bulletin of the American Meteorological Society 74 (6): 1007 – 1023. Lamb HA (1979). Climate: Past, Present and Future, Vol. 2 Methuen. National Environment Study action Team, NEST (1991). Nigerians Threatened Environment: A Natural Profile, NEST, Bodija, Ibadan. Olaniran OJ (1991). Evidence of climate change in Nigeria based on annual series of rainfall of different daily amounts 1919 – 1985, Climate Change 19: 319 – 341. Serra C, Burgueno A, Lana X (2001). Analysis of maximum and minimum daily temperatures recorded at Fabra Observatory (Barcelona, NE Spain) in the period 1917 – 1998, Int. J. Climatol. 21: 617 – 636. Sneyers R (1990). On the statistical analysis of series of observations, WMO technical Note 143, WMO No 199, TP 103, World Meteorological Organisation, p. 192. Taylor PJ (1977) Quantitative methods in geography, Houghton Mifflin Company, U.S.A. p. 385.