2nd International Conference on Energy and Environment: bringing together Engineering and Economics Guimarães, Portugal 18-19 June, 2015
EVALUATING THE USE OF OPEN DATA TO ESTIMATE THE GLOBAL SOLAR ENERGY POTENTIAL Fabio Veronesi1*, Stefano Grassi1, Roland Schenkel1, Athina Korfiati1, Charalampos Gkonos1, Ariadni Gaki1, Stephan Volkwein2, Martin Raubal1, Lorenz Hurni1 1
Institute of Cartography and Geoinformation, ETH Zurich – Stefano-Franscini-Platz 5, CH-8093 Zurich 2 SolarSuperState Association – In der Ey 17, CH-8047 Zurich * Corresponding author:
[email protected]
KEYWORDS Global Solar Potential, photovoltaic, Interactive Web Map ABSTRACT Demand for renewable sources of electricity is a fast growing sector, due to the global efforts to reduce CO 2 emissions. In particular, solar energy plays a promising role for both developed and developing countries. Despite this however, only a limited amount of electricity is currently produced from solar power. The first step in helping countries realize the importance of tapping into solar energy is showing the potential amount of electricity that could theoretically be produced this way. For this reason we used open data to produce an interactive web map that shows the solar potential of individual countries worldwide. We modified an approach proposed in literature to calculate the solar energy potential for both centralized, i.e. solar power plants, and decentralized systems, i.e. PV panels installed on buildings’ rooftops or façades. We increased the accuracy of previous approaches by including mean annual temperature data to adjust the performance ratio of solar panels. Furthermore, we developed an approach to estimate the rooftop and façade areas as a function of GDP. These data are crucial for assessing the potential for solar installations in urban areas. The current global solar potential technically available to exploit was estimated at about 613 PWh/y.
INTRODUCTION Demand for renewable sources of electricity is a fast growing sector nowadays, due to the global efforts to reduce CO2 emissions. In particular, solar energy is foreseen as the most promising renewable energy source due to the benefits it offers (Weinrub, 2011). First and foremost, solar energy is clean, since it can produce electricity without emitting greenhouse and toxic gases such as CO2 and NOx. Furthermore, it can have positive effects from an economic standpoint, not only because after the initial investment it reduces electricity bills, but also because the renewable energy sector has the potential to create new jobs. In addition, solar energy is relatively easy to install on rooftops and therefore it can provide a way to produce clean electricity in rural locations (Solangi et al., 2011). In spite of the advantages of solar energy, the current state of solar production is just a minor fraction of what is potentially available to develop, since solar energy covers only 0.05% of the total primary energy supply (Solangi et al., 2011). In order to change that, researchers need to provide policy makers with tools to easily assess the amount of electricity that can potentially be generated from solar energy by their countries, compared to what is currently generated and consumed. This project aims at filling this gap using open data, so that our results are in the public domain and therefore can be accessed by anyone with an internet connection. To create the solar potential map we modified the standard top-down approach (Angelis-Dimakis et al., 2011). The most recent example of this approach for solar potential computation is the work of Hoogwijk (2004), who used a set of linear equations to first calculate the percentage of land suitable for PV (photovoltaic) installation and then the amount of electricity that can potentially be generated from it. There are three problems with this approach that made us test ways of updating her results. First of all, the PV technology has changed substantially since 2004 and therefore it is necessary to update the computations using updated panels’ efficiency factors. The second reason is related to the lack of ways, in Hoogwijk’s work, of correcting the panels’ performance ratios for temperature. This is a crucial point because it highly affects the electricity output of solar panels and if not properly taken into account may lead to overestimations, particularly in equatorial regions. Lastly, to assess the potential for urban PV installations, Hoogwijk proposed an estimation of rooftop and façade areas based on GDP (Gross Domestic Product) per capita. This was done simply because no measured data existed of the amount of rooftop and façades (Wiginton et al., 2010), but only rough estimates. The problem with the approach followed by Hoogwijk however, is that it highly underestimates the only available data we have about the amount of rooftop and façade areas, i.e. the data provided by IEA (International Energy Agency) for 14 OECD (the Organization for Economic Co-operation and Development) countries in 2002. To
solve that, in this research we used a polynomial regression to model rooftop and façade areas (from IEA) as a function of GDP, which allowed us to estimate them for countries not covered by the IEA study. The results of this project are presented using an interactive web map freely available on-line (http://solarpotential.ethz.ch). This instrument harness the power of web GIS to optimize the fruition of the data to people not familiar with its technology. For this reason the results of this study can be used by practitioners and policy makers alike to spread the message that countries have the potential to produce a lot more clean energy and that even if oil prices are extremely low now it does not mean that we should not try to invest in clean energy.
MATERIALS AND METHODS Study Area and Datasets The study was conducted on a global scale and we used only data freely available on the web to produce our maps. The most important dataset we needed to start computing the global solar energy potential was the average amount of solar irradiation. For this we downloaded the Surface meteorology and Solar Energy dataset (SSE - Release 6.0; NASA, 2014), with solar irradiation yearly averages on a resolution of 1-degree, which is approximately 100 km at the equator. We used a cubic spline smoother to downscale it to a resolution of 1 km, which we set as our target resolution for computing the solar potential. From NASA we also downloaded average global temperature data, which will be used to correct the efficiency of solar panels. For elevation we used the Global Multi-resolution Terrain Data 2010 (GMTED2010; USGS, 2011) digital elevation model (DEM). This dataset is a collection of elevation data from several different sources, such as the earlier version GTOPO30, the global Digital Terrain Elevation Data (DTED) from the Shuttle Radar Topography Mission (SRTM), Canadian elevation data, Spot 5 Reference3D data, and data from the Ice, Cloud, and land Elevation Satellite (ICESat; Danielson & Gesch, 2011). From the DEM we computed the slope derivative that will be used for the geographical potential. The land cover data were provided by the GlobCover2009 (ESA, 2009), which has a resolution of 300m and 22 land cover classes. In order to have a baseline to our computation, we collected data regarding the amount of electricity produced by PV globally, plus data regarding the average electricity consumption. The cumulative installed PV power data were collected by SolarSuperState Association (SolarSuperState.org), which was partner in this research. The solar electricity production data were collected from the US Energy Information Administration (EIA) from the year 2011, which is the most recent to provide full global coverage. This dataset refers to the total solar electricity production, which is the sum of PV generation plus production from concentrated solar power plants, which produce energy transforming solar energy into heat and not through the photovoltaic effect. We also collected average annual electricity consumption data, for 2011, from various sources: namely EIA and the CIA World Factbook. For estimating rooftop and façade areas, we collected GDP data for each country, for which data were available, from the International Monetary Fund (IMF) database from the year 2013. Methodology In order to compute the global solar potential we followed an approach widely used in literature, referred to as topdown approach (Angelis-Dimakis et al., 2011). We started from the global solar irradiance dataset, which represents the total amount of solar energy physically available on the earth’s surface. From this we followed a method that reduces the amount of exploitable energy according to environmental factors and technical limitations. We worked on a 1 Km resolution and then summed the cells values to obtain the total potential for each country. Geographic Potential First we computed the geographical potential, which is the fraction of the earth’s surface suitable for the development of solar facilities, according to the following equation: 𝐺𝑖 = 103 · 𝐼𝑖 · h · 𝐴𝑎,
(1)
where 𝐺𝑖 (kWh·y-1) is the geographical potential of cell i, 𝐼𝑖 (W·m-2) is the time-averaged irradiance in cell i (extracted from the NASA irradiation data), h (h·y-1) is the number of hours in a year, and 𝐴𝑎,𝑖 (km2) is the available area for PV installation in cell i. The only unknown variable in Equation (1) is the area, and for its calculation we followed two slightly different approaches for centralized and decentralized systems.
Geographical Potential - Centralized Systems To assess the amount of area suitable for developing solar facilities we used an approach suggested by Hoogwijk (2004) based on suitability factors. Basically only a small fraction of each raster cell is considered suitable for development, based on its land cover. The list of suitability factors divided by land-cover is presented in Table 1. Moreover, since centralized plants require large flat areas we excluded locations with a slope higher than 4% (Hoogwijk, 2004). We also excluded areas with a solar irradiance below 950 kWh/m2 per year, since they are less appealing for investing in solar facilities.
Table 1: Suitability Factor used in this Research, divided by Land Cover type. Land Cover Type Urban, Bioreserve, Forest Arable, Shrub, Savannah, Tundra, Grassland Extensive grassland, desert
Suitability Factor (%) 0 1 5
Geographical Potential – Decentralized Systems For decentralized systems we intend PV panels installed on buildings’ rooftop and façades. Direct measurements of these data are however not available (Wiginton et al., 2010). We only have the estimates from IEA, and for this reason we updated an approach suggested by Hoogwijk (2004), fitting a polynomial regression to model the IEA data as a function of GDP, so that we could estimate rooftop and façade areas for each country where GDP data are available. Technical Potential The technical potential is the geographical potential multiplied by efficiency factors and performance ratios of the solar panels, calculated from the following equation: 𝐸𝑖 = 𝐺𝑖 · 𝜂𝑚 · 𝐾΄ · {1 + 𝛼𝑃𝑚𝑎𝑥 (𝛵𝐴𝑚+ 𝛥𝛵−25 )}
(2)
where Ei is the technical potential in the cell i, Gi (kWh·y-1) is the geographical potential in a cell i, and ηm is the conversion efficiency, which corresponding to the amount of solar energy that can be transformed into electricity. The remaining of the equation was plugged in directly from Kawajiri et al. (2011), where K’ is a design factor, 𝛼𝑃𝑚𝑎𝑥 is the maximum power temperature coefficient, 𝛵𝐴𝑚 is the 24h ambient temperature profile averaged over the month m, and 𝛥𝛵 is the average annual increase of modules’ temperature. These parameters were calculated experimentally by Kawajiri et al. (2011). Basically we first calculated the percentage of land suitable for energy production (i.e. geographic potential), then computed the amount of energy that land could potentially generate if covered by PV panels. The approach presented in literature (Hoogwijk, 2004) has been modified in two ways. Firstly, we updated the efficiency factors in order to reflect the latest technological advancements in the sector (SRoeCo Solar, 2012); more specifically we used an efficiency of 20% applied to both centralized and decentralized systems. Moreover, given that performance ratio is highly affected by temperature, we implemented a way to keep this into account by including the approach developed by Kawajiri et al. (2011).
Interactive Web Map One of the main objectives of this work is to provide a platform for practitioners and policy makers to easily consult our results. For this reason we developed an interactive web map, since interactive cartographic information systems encompass numerous characteristics and functionalities that facilitate the presentation of complex information (Kunz, et al., 2011). We present the results of our research as a series of maps, where each country has a color based on its solar potential. We also provide detailed information regarding ratios between current energy production and consumption and solar potential.
RESULTS AND DISCUSSION Geographic Potential As mentioned, we used two different approaches to compute the geographical potential for centralized and decentralized systems, as suggested by Hoogwijk (2004). For centralized systems, we excluded areas with slope above 4%, solar irradiation below 950 kWh/m2 per year, and we further reduced the area available for development using suitability factors that depend on land cover (Table 1). The maximum suitability factor is set to 5%, which may seems counterintuitive when applied to desert. However, we need to remember that we aim at providing end users with realistic solar potential figures. For this reason it makes little sense to assume that entire deserted areas would be covered by solar facilities. Therefore we think the suitability factors we used are appropriate to provide realistic estimates. We also excluded areas where the yearly solar irradiation is below 950 kWh/m 2, in line with values used in literature (e.g. Compagnon, 2004) For decentralized systems, which are installed on buildings’ rooftops and facades, we calculated the available building area starting from the IEA estimates (Gutschner et al., 2002). The IEA calculated, with an experimental approach, rooftop and façade areas for several countries: Australia, Austria, Canada, Denmark, Finland, Germany, Italy, Japan, Netherlands, Spain, Sweden, Switzerland, UK, and USA. Since these are the closest things to actual observations we had, we used them to estimate rooftop and façade figures for countries not covered by IEA. These data have a strong correlation with GDP, and for this reason we were able to use polynomial regression model to estimate total rooftop and façade areas for each country not covered by IEA. This model fitted the IEA data very well obtaining an R2 of 0.99 and a root mean square error of 218.33 km2.
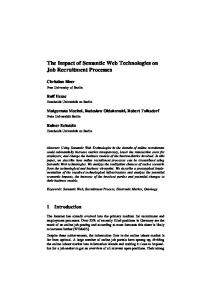
Technical Potential Regarding the technical potential, we considerably updated the previous approach developed by Hoogwijk (2004). First of all, we changed the efficiency factor of PV panels based on the latest technical advancements. We used a constant efficiency of 20%, which we think is realistic enough for the current state of the art in solar development. Even though researchers have achieved efficiencies higher than 40% using multijunction solar cells (King et al., 2007; Mertens, 2013), currently installed solar panels have an average efficiency between 14% and 18% (PurSolar, 2015) and the latest commercial models can reach 21% (SRoeCo Solar, 2012), which keeping into account losses from inverter, cabling and deviations of module temperatures, can translates into a real efficiency of around 18% (Mertens, 2013). Since PV efficiency should increase to 23-30% in real terms in 2020 (Hofman et al., 2002), we think our choice is appropriate for providing an accurate estimate valid for the near future. In addition to the efficiency factor, we also incorporated temperature in our model. This parameters highly affects the semiconductors and therefore decreases the power output of the PV cell. It is estimated that for an increment of one degree Celsius the power output decreases by 0.5% (Mertens, 2013). This means that if a panel reaches a temperature of 60°C its power output will be 17.5% lower than its nominal efficiency, calculated in laboratory conditions at 25°C. The map of the technical potential is presented in Figure 1.
Figure 1: Technical Solar Potential on a 1 x 1 km Resolution.
Interactive Web Map Several examples of web maps are available online to encourage the use of solar energy. Probably the first example of such maps is the “San Francisco Energy Map” (http://sfenergymap.org/), created in 2006. Similar maps are available for numerous other cities in US mainland, such as Boston, Los Angeles, and New York. In Europe the Joint Research Center (JRC) has created a similar system (http://re.jrc.ec.europa.eu/pvgis/apps4/pvest.php?lang=en&map=europe) where users can select a location on the map, plus parameters regarding the type of panels to install, and obtain a table with data regarding the potential amount of solar power available for that location. The common thread of these web maps is that they all focus on providing citizens with ways to estimate the potential yield of PV panels on their properties. This research is more interested in providing practitioners and policy makers with a tool to facilitate the adoption of solar power at the political level. For this reason we created a series of maps to show realistic figures for solar potential for each country worldwide. Moreover, we also provide data regarding the potential impact that investing in solar energy may provide to individual countries. For example, from the interactive web map we can see that Italy has one of the highest ratio between current solar energy production and total consumption, with 34.5‰, which is still very low considering that EU countries should produce 20% of their energy from renewable sources by 2020 (EU, 2009). If we look at the total solar potential for Italy (1181.07 TWh/y), we can quickly realize that even if a small proportion of this is successfully developed it can cover most of the total energy consumption for the whole country, which is 311.23 TWh/y. Clearly it is not realistic to assume that Italy will develop the full solar potential, but even just tapping 10% of it can cover around 38% of the electricity consumed by the whole country each year.
CONCLUSIONS AND FURTHER RESEARCH In this study we modified methods available in literature to calculate the global solar energy potential. We increased the accuracy of previous estimates by including temperature, which highly affects the PV performances, and by providing a better way to calculate rooftop and façade PV potentials, validated against the IEA data. Our results are presented in an interactive web interface available online. From this website practitioners and policy makers can obtain more information regarding the potential for developing solar energy. Our data provide a good way of disseminating the message that several countries could cover large parts of their electricity demands by just developing a fraction of their solar potential. More work is certainly needed to further increase the accuracy of our figures. For example, the keystone of our research is the solar irradiation map provided by NASA. There are a couple of problems with this map though: the first is that it provides data only until 2005, and we do not have a way to account for the changes after that year, which in a context of climate changes may be important. The second issue is related to the coarse resolution of these data, which for small countries means that we are computing the potential from a very limit number of observations. Therefore one way to further increase the accuracy of the solar potential estimates is obtaining more accurate irradiation data. Moreover, we should try to find ways for fast updated of the electricity figures for each country. At the moment these are referred to 2011, simply because these data were simple to gather. However it would be interesting to have ways of updating the map with the current figures. The amount of rooftop and façade data is also another point which we would need to investigate further. Observed data are simply not available on the global scale. Several studies have started looking into automatic ways of extracting rooftop area from GIS data (few examples are: Laycock et al., 2003; Hofierka et al., 2009; Silván-Cárdenas et al., 2011) but are still in an early stage. ACKNOWLEDGEMENTS The authors would like to thank NASA Langley Research Center Atmospheric Science Data Center Surface meteorological and Solar Energy (SSE), USGS, IMF, CIA, IEA and EIA for providing the open data we used in this research. REFERENCES Angelis-Dimakis, A., Biberacher, M., Dominguez, J., Fiorese, G., Gadocha, S., Gnansounou, E., ... & Robba, M. 2011. “Methods and tools to evaluate the availability of renewable energy sources. Renewable and Sustainable Energy” Reviews, 15(2), 1182-1200. Carabajal, C. C., Harding, D. J., Boy, J. P., Danielson, J. J., Gesch, D. B., & Suchdeo, V. P. 2011. “Evaluation of the global multi-resolution terrain elevation data 2010 (GMTED2010) using ICESat geodetic control”. In International Symposium on Lidar and Radar Mapping Technologies (pp. 82861Y-82861Y). International Society for Optics and Photonics. Compagnon, R. (2004). Solar and daylight availability in the urban fabric. Energy and Buildings, 36(4), 321-328. Danielson, J. J., & Gesch, D. B. 2011. “Global Multi-resolution Terrain Elevation Data 2010” (GMTED2010)-of20111073. pdf. Open-File Report, (2011–1073).
EU 2009. “Renewable Energy Directive” Available at: http://eur-lex.europa.eu/legalcontent/EN/TXT/HTML/?uri=CELEX:32009L0028&from=EN – Last accessed: 11.02.2015 First Solar. 2012. “World's Largest Operational Solar PV Project, Agua Caliente, Achieves 250 Megawatts of GridConnected Power”. Press release. Available at: http://investor.firstsolar.com/releasedetail.cfm?ReleaseID=706034 – Last accessed: 06.02.2015 Gutschner, M., Nowak, S., & Toggweiler, P. (2002). “Potential for building integrated photovoltaics”. IEA-PVPS Task, 7. Hastie, T., Tibshirani, R., Friedman, J., Hastie, T., Friedman, J., & Tibshirani, R. 2009. The elements of statistical learning (Vol. 2, No. 1). New York: springer. Hofierka, J., & Kaňuk, J. 2009. Assessment of photovoltaic potential in urban areas using open-source solar radiation tools. Renewable Energy, 34(10), 2206-2214. Hofman, Y., D. de Jager, E. Molenbroek, F. Schilig, and M. Voogt 2002. "The potential of solar electricity to reduce CO2 emissions." Utrecht, Ecofys 106. Hoogwijk, M.M. 2004. “On the global and regional potential of renewable energy sources”. Ph.D. Dissertation, Utrecht University Repository. Available at: http://dspace.library.uu.nl/handle/1874/782 - Last accessed : 12.02.2015 Kawajiri, K., Oozeki, T. & Genchi, Y., 2011. Effect of temperature on PV potential in the world. Environmental Science & Technology, 45 (20). p. 9030–9035. King, R. R., D. C. Law, K. M. Edmondson, C. M. Fetzer, G. S. Kinsey, H. Yoon, R. A. Sherif, and N. H. Karam. 2007. "40% efficient metamorphic GaInP/GaInAs/Ge multijunction solar cells." Applied physics letters 90, no. 18: 183516-183516. Kunz, M., Gret-Regamey, A. and Hurni, L., 2011. “Visualization of uncertainty in natural hazards assessments using an interactive cartographic information system”. Natural Hazards, 59(3), pp. 1735-1751. Laycock, R. G., & Day, A. M. 2003. “Automatically generating roof models from building footprints”. WSCG '2003: posters: the 11-th international conference in central Europe on computer graphics, visualization and computer vision 2003, 3.-7. February 2003, Plzen, p. 81-84. Available at: https://otik.zcu.cz/handle/11025/991 - Last accessed: 12.02.2015 Marion, B., Adelstein, J., Boyle, K., Hayden, H., Hammond, B., Fletcher, T., ... & Townsend, T. 2005. “Performance parameters for grid-connected PV systems”. In Photovoltaic Specialists Conference. Conference Record of the Thirty-first IEEE (pp. 1601-1606). IEEE. Mertens, Konrad. Photovoltaics: Fundamentals, Technology and Practice. John Wiley & Sons, 2013. Mohamed, A. O., & Hasan, A. 2012. Effect of dust accumulation on performance of photovoltaic solar modules in Sahara environment. Journal of Basic and Applied Scientific Research, 2(11), 11030-11036. NASA, 2014. Surface meteorology and Solar Energy (SSE) Release 6.0. Available at: https://eosweb.larc.nasa.gov/project/sse/SSE6Methodology.pdf – Last accessed: 12.02.2015 NREL – National Renewable Energy Laboratory. 2014. “Ivanpah Solar Electric Generating System”. Available at: http://www.nrel.gov/csp/solarpaces/project_detail.cfm/projectID=62 – Last accessed: 06.02.2015 PurSolar 2015. “Getting the Best Solar Panel Efficiency and the Factors that Affect it”. Available at: http://www.pursolaraz.com/learn-about-solar/what-affects-solar-panel-efficiency-2/ - Last accessed: 10.02.2015 RES21. 2013. “Renewable 2013 Gobal Status Report”. Available at: http://www.ren21.net/Portals/0/documents/Resources/GSR/2013/GSR2013_highres.pdf - Last accessed: 06.02.2015 Silván-Cárdenas, J. L., & Wang, L. 2011. “Extraction of buildings footprint from lidar altimetry data with the hermite transform”. In Pattern Recognition (pp. 314-321). Springer Berlin Heidelberg. Solangi, K. H.; Islam, M. R.; Saidur, R.; Rahim, N. A. and Fayaz, H. 2011. “A review on global solar energy policy”. Renewable and sustainable energy reviews, 15(4), 2149-2163. SRoeCo Solar 2012. “Solar Panel Comparison Table”. Available at: http://sroeco.com/solar/table/ - Last accessed: 09.02.2015 U.S. Geological Survey, 2011. Global Multi-resolution Terrain Elevation Data 2010 (GMTED2010). Available at: http://topotools.cr.usgs.gov/GMTED_viewer/viewer.htm – Last accessed: 12.02.2015 Weinrub, A. 2011. “Community Power: Decentralized Renewable Energy in California”. Local Clean Energy Alliance. Available at: http://www.localcleanenergy.org/files/Community_Power_Publication_Online-3.pdf - Last accessed: 03.02.2015 Wiginton, L. K., Nguyen, H. T., & Pearce, J. M. 2010. “Quantifying rooftop solar photovoltaic potential for regional renewable energy policy”. Computers, Environment and Urban Systems, 34(4), 345-357. Woody, T. 2010. “BrightSource Alters Solar Plant Plan to Address Concerns Over Desert Tortoise”. The New York Times. Available at: green.blogs.nytimes.com//2010/02/11/brightsource-alters-solar-plant-plan-to-address-concernsover-desert-tortoise Last accessed: 06.02.2015 Woyte, A., Richter, M., Moser, D., Mau, S., Reich, N., & Jahn, U. (2013). Monitoring of Photovoltaic Systems: Good Practices and Systematic Analysis. In Proc. 28th European Photovoltaic Solar Energy Conference (pp. 3686-3694).