SERIES PAPER DISCUSSION
IZA DP No. 9425
Excess Commuting in the US: Differences between the Self-Employed and Employees J. Ignacio Gimenez-Nadal Jose Alberto Molina Jorge Velilla October 2015
Forschungsinstitut zur Zukunft der Arbeit Institute for the Study of Labor
Excess Commuting in the US: Differences between the Self-Employed and Employees J. Ignacio Gimenez-Nadal University of Zaragoza and CTUR
Jose Alberto Molina University of Zaragoza and IZA
Jorge Velilla University of Zaragoza
Discussion Paper No. 9425 October 2015
IZA P.O. Box 7240 53072 Bonn Germany Phone: +49-228-3894-0 Fax: +49-228-3894-180 E-mail:
[email protected]
Any opinions expressed here are those of the author(s) and not those of IZA. Research published in this series may include views on policy, but the institute itself takes no institutional policy positions. The IZA research network is committed to the IZA Guiding Principles of Research Integrity. The Institute for the Study of Labor (IZA) in Bonn is a local and virtual international research center and a place of communication between science, politics and business. IZA is an independent nonprofit organization supported by Deutsche Post Foundation. The center is associated with the University of Bonn and offers a stimulating research environment through its international network, workshops and conferences, data service, project support, research visits and doctoral program. IZA engages in (i) original and internationally competitive research in all fields of labor economics, (ii) development of policy concepts, and (iii) dissemination of research results and concepts to the interested public. IZA Discussion Papers often represent preliminary work and are circulated to encourage discussion. Citation of such a paper should account for its provisional character. A revised version may be available directly from the author.
IZA Discussion Paper No. 9425 October 2015
ABSTRACT Excess Commuting in the US: Differences between the Self-Employed and Employees* In this paper, we propose a new spatial framework to model excess commuting of workers and we show empirical differences between the self-employed and employees in the US. In a theoretical framework where self-employed workers minimize their commuting time, employees do not minimize their commuting time because they lack full information, and thus the difference between the time devoted to commuting by self-employed workers and employees is modeled as wasteful commuting (i.e., excess commuting). We first formulate a microeconomic framework for commuting by modeling the location of individuals in urban cores surrounded by rings. Using the American Time Use Survey for the years 2003-2013, our empirical results show that employees spend twelve more minutes per day, or forty percent of the average commuting time, compared to their self-employed counterparts. This is consistent with our “diana” model, in that location is an important factor.
JEL Classification: Keywords:
R20, R41, J64
excess commuting, urban cores, American Time Use Survey, self-employed workers, employees
Corresponding author: J. Ignacio Gimenez Nadal Faculty of Economics and Business University of Zaragoza C/ Gran Via 2 50005 Zaragoza Spain E-mail:
[email protected]
*
This paper has benefited from funding from the Spanish Ministry of Economics (Project ECO201234828).
1. Introduction In this paper, we analyze excess commuting by workers in the United States, with this being defined as “the difference between the theoretical minimum and the observed commuting distance/time at one point in time, expressed as a percentage of the observed commute (Hamilton, 1982).” The analysis of commuting behavior is important for several reasons. For instance, Kahneman et al. (2004) and Kahneman and Krueger (2006) show that time spent in commuting ranks among the lowest activities in terms of “instant enjoyment” obtained by individuals. There are also psychological costs associated with travel (Koslowsky et al., 1995; Evans et al, 2002; Kahneman et al., 2004), and commuting and health outcomes are negatively related (Walsleben et al., 1999; Jansen et al., 2003; Hämming et al., 2009; Hansson et al., 2011; Roberts et al., 2011). Furthermore, longer commutes are systematically associated with lower levels of well-being (Frey and Stutzer, 2008; Novaco and Gonzalez, 2009), and long commutes cause stress for workers (Schaeffer et al., 1988; Hennesy and Wiesenthal, 1999; Wener et al., 2003; Gottholmseder et al., 2009; Novaco et al., 1990). Recent studies have shown that the time devoted to commuting has increased in developed countries in recent years, in Germany (Gimenez-Nadal and Molina, 2014), the Netherlands (Susilo and Maat, 2007; Gimenez-Nadal and Molina, 2014) and the United States (Kirby and LeSage, 2009; McKenzie and Rapino, 2009; Gimenez-Nadal and Molina, 2014), leading commuting time comprising a significant part of the total time devoted to the labor market (Kenworthy and Laube, 1999). The analysis of commuting behavior is a field of economics with many contributions (see Ma and Banister (2006) for a chronological review). In the field of transport economics, commuters choose a mode, defined in terms of speed and time, to minimize the monetary and opportunity costs of travel (DeSalvo and Huq, 1996). In urban economics, the focus is on household location, where commuting is generally assumed to confer disutility, and households are located to maximise the utility obtained from housing and all other goods (see the “monocentric city model” in Alonso (1964), Mills (1967) and Muth (1969) and the “polycentric city model” developed in Muller (1981), Garreau (1991) and Knox and McCarthy (2005)). Commuting has been incorporated in models of job search (van den Berg and Gorter, 1997; van Ommeren, 1998; Rouwendal, 2004) where commuting is considered a source of labor mobility that allows workers to access geographically dispersed labor
1
markets without the need for migration (Cameron and Muellbauer, 1998). Hence, workers choose their place of residence and of work, in order to minimize the cost of displacement from one to another, the commuting cost, although this is only possible in a perfect frame of labor and housing search markets. Given market imperfections, workers cannot minimize their commuting (Weinberg et al., 1981; Zax, 1991; Holzer, 1994), and the “minimum” commute differs from the actual commute, with this difference being defined as “excess commuting” (Hamilton, 1982). Since then, many studies have analyzed excess commuting in different frameworks (see Kanaroglou, Higgins and Chowdhury (2015) for a review), including van Ommeren and van der Straaten (2008), who estimate the effect of search imperfections on the length of the average commute. According to that study, the self-employed do, in fact, minimize their commute whereas employees may have to accept jobs with a longer commute, and the “excess commuting” is identified by estimating the difference in the commute of employees and self-employed individuals, leading to results showing that about 40 to 60% of the observed commute may be considered “excess” due to search imperfections. The identification hypothesis relies on the assumption that the self-employed look for physical places to carry out their work or establish a business (a room, an office…), while employed workers look for jobs, and while the information available on vacant physical places is perfect - or at least almost so - the information on vacant jobs is not. Within this framework, the main goals of our paper are to model and document the “excess” commuting of workers in the United States. First, and based on van Ommeren and van der Straaten (2008)’s theoretical framework, we present a new model focused on the choice of place of work, while the place of residence of the worker is fixed. In this model, we assume that cities take the form of a series of concentric rings, with the city center being the urban core where most jobs are concentrated. As we move away from this core, the number of jobs decreases. The model is indexed by a rate of perception of vacant jobs that reflects the absence of perfect information about the labor search market. The main result obtained from the model is that, as the rate increases, i.e., as the information is more complete, commuting decreases - and when the information is perfect, excess commuting is null. Second, we use the American Time Use Survey (ATUS) for the years 2003-2013, which includes information on the time devoted by US workers to commuting on a daily basis. Note that there are different ways of seeing commuting (i.e., according to
2
the effort/cost it involves, the time spent, or the distance traveled) and in what follows, the empirical results will be related to commuting time.1 Given that male and female workers have different commuting behavior (see Gimenez-Nadal and Molina (2016) for a review) we carry out our analysis by gender. Comparing the time devoted to commuting by self-employed and employed workers, we find that, on average, 20% and 39% of the total commuting of males and females, respectively, is “excess commuting”, with such differences being concentrated in car users and male active commuting. We then test this new model with data from the ATUS 2003-2013, where location of workers is classified according to their metropolitan/non-metropolitan status, and we find that those workers living in non-metropolitan areas report more time devoted to commuting, compared to those living in metropolitan areas, which is consistent with our theoretical setting. We also find that the size of the city of residence is positively related to the time devoted to commuting. Our contribution to the literature is threefold. First, we offer updated information on the commuting behavior of workers in the US. The novelty of our approach is that we use information from time use surveys, which have been underused in the literature on commuting. (National Travel Surveys have traditionally been used for the analysis of commuting patterns of households in various countries.) The use of time use surveys can serve as a complement to National Travel Surveys (Kitamura and Fuji, 1997; Gimenez-Nadal and Molina, 2014; Gimenez-Nadal and Molina, 2016), as prior research has found that the measurement bias when using commuting time is rather small (Small and Song; 1992, van Ommeren and Van der Straaten; 2008) We then develop a theoretical model on the choice of place of work, where we assume that cities take the form of a series of concentric rings, with the city center being the urban core where most of the jobs are concentrated. In this sense, we extend the model of van Ommeren and van der Straaten (2008) and test the new model using data for workers in the US. Third, and based on the theoretical setting, we offer a count of the “excess commuting”
1
Workers may not choose jobs minimizing the commuting time, but rather the distance to their jobs. Under these circumstances, once the process of choosing distance is done, workers minimize their commuting time by choosing the mode of transport. However, we assume that the problem of minimization of commuting takes place directly in time. We consider that our alternative directly collects a number of aspects related to the cost of commuting, such as the presence of traffic congestion, the condition and density of roads and urban highways, etc. Also, time is generally more accurate that distance, which presumably gives us a lower error term. Furthermore, a specific analysis of commuting time by travel mode (e.g., car, active commuting, etc…) is done to test for the consistency and applicability of our results.
3
US workers engage in due to job market imperfections. Despite that we find much prior research on this last topic (see Cropper and Gordon (1991), Small and Song (1992), Manning (2003) and Rodriguez (2004), where excess commuting is about 50% of total commuting), it may be relevant for researchers, employers, and policy makers as we analyze the latest available data. The rest of the paper is organized as follows. Section 2 presents the new theoretical model. Section 3 describes the data. Section 4 describes our econometric strategy and the results. Section 5 present a GIS modeling where we analyze the relationship between population in the state of residence and average commuting time, and Section 6 sets out our main conclusions.
2. The “Diana” model The existence of an actual minimum commuting time is only possible in a perfect frame of labor and housing search markets. In a real economy, with imperfections, workers cannot minimize their commuting (Weinberg et al., 1981; Zax, 1991; Holzer, 1994). The most common imperfections studied in the literature are those related to the transportation costs of residence and to the imperfect information about job opportunities. We will compare, as in van Ommeren and van der Straaten (2008), the commuting of one group of workers (employees) with the commuting of another group of workers (the self-employed), and for the latter we assume the hypothesis of perfect information about the labor market, motivated by the fact that these individuals do not really look for a job, but a physical place to carry out their work or establish a business (a room, an office…), and we can assume that the available information on vacant places is perfect, or at least almost perfect, compared to that available about job search. Therefore, it is acceptable to assume that, among the self-employed, there is no excess commuting, and thus the difference between the commute of the self-employed and that of employees can be considered as “excess commuting”. These differences, as developed in van Ommeren and van der Straaten (2008), are given by a different arrival rate of jobs λ. Note that some commuting by workers is unavoidable, and the present model considers zero minimum commuting without loss of generality. We can relax this assumption, as van Ommeren and van der Straaten (2008) do, with the application of an exogenous and positive constant τ, which measures the distance to the nearest job. 4
Consider that individuals have fixed dwellings. On the one hand, we suppose that there is homogeneity in jobs, productivity, and wages, so any given worker in the private sector can be replaced by another. On the other hand, there is heterogeneity in commuting time (or distance), and the cost of this commuting is ηt, where t is the commuting time (or distance) and η
0 is constant.
Workers can be employed (which will be denoted by 1) or unemployed (denoted by 0). The unemployed receive job offers with a random time process indexed by the arrival rate λ, and the employed do not. We assume that unemployed workers receive an unemployment benefit, b
0, and immediately accept or reject offers, and that
employed workers can be fired, according to the same time process, with a positive probability δ
0.
The contribution of our model, compared with the original, is that cities are modeled as if they were “dianas”, consisting of an urban core surrounded by rings (Figure 1), in contrast to Van Ommeren and Van der Straaten (2008), who model cities in an abstract form with a non-defined density function, F. We have linearized the model to one dimension and we have normalized the time (or distance) between rings to 1 (Figure 2). We assume that most of the job offers are in the urban core, i when we go far from the core (i
0, and
1, … , n ) the job offers decrease, a hypothesis
consistent with Wasmer and Zenou (2002). If we consider that the arrival rates are proportional to the job offers, we can represent both with the parameter λ ≡ λ i such that λ
λ
⋯
λ
0. In addition, living costs also decrease as we move away c
from the urban core, c
⋯
c . We assume that the time (or distance) of intra-
rings displacements is not commuting, by assuming that these displacements are actively done, in line with the results of Martin, Goryakin and Suhrcke (2014), who say that active commuting does not suppose any monetary, physical, or psychic cost for workers. The hypothesis that we will test is whether commuting increases when workers live in places farther from the urban core. Let r be the discount future rate. Then, the values of being unemployed and employed in the ring j, for an individual who lives in i for i rV
b
rV
w
c c
λ max V , V η|i
j|
δ V
5
0, … n, are respectively:
V , V for j
0, … , n.
It is important to note that there will exist a time (or distance) T ≡ T i
0 such
that unemployed workers will accept jobs associated only with smaller commuting times, but not with greater. This is: V
V ∀|i
j|
T, V
V ∀|i
particular, the definition of rV makes sense, for each i, only if |i
j|
j|
T. In due to
commuting costs. We can also rewrite rV as ,
b
rV
c
λ V
V ;
,
and, as rV
rV , for j ∋ |i T i
w
b η
j | 1 η
T i , we obtain the following expression of T: ,
λ V
V , i
0, … , n;
,
which, as in van Ommeren and van der Straaten (2008), decreases with λ ∀j and tends to 0 when every λ goes to ∞. Within this framework, we can set the following Hypothesis: The maximum commuting time is decreasing with the information on job offers, and tends to zero when the information tends to be perfect. This is demonstrated in Appendix A. In particular, when there exists perfect information, workers will not accept jobs with any kind of non-zero commuting, or excess commuting, according to the constant τ.
3. Data and variables We use the 2003-2013 American Time Use Survey (ATUS) to analyze the commuting time of workers in the US. Respondents are asked to fill out a diary summarizing episodes of the preceding day, and thus the ATUS provides us with information on individual time use, based on diary questionnaires in which individuals report their activities throughout the 24 hours of the day. The ATUS includes a set of activities, defined as the ‘primary’ or ‘main’ activity individuals were doing at the time of the interview. Thus, we are able to add up the time devoted to any activity of reference (e.g., paid work, leisure, TV watching) as ‘primary’ activity. The ATUS is administered by the Bureau of Labor Statistics, and is considered the official time use survey of the country. More information can be found in http://www.bls.gov/tus/.
6
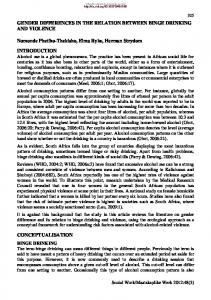
The advantage of time-use surveys over stylized-questions, such as those included in the European Community Household Panel (ECHP), the British Household Panel Survey (BHPS), and the German Socio-Economic Panel (GSOEP), where respondents are asked how much time they have spent, for example, in the previous week, or normally spend each week, on any activity, is that diary-based estimates of time use are more reliable and accurate than estimates derived from direct questions (Juster and Stafford, 1985; Robinson, 1985; Bianchi et al., 2000; Bonke, 2005; Yee-Kan, 2008). Thus, in the same way that money-expenditure diaries have become the gold standard in the consumption literature, so have time-use diaries become the preferred method of gathering information about time spent on market work, non-market work, and leisure. Most studies documenting how individuals use their time are now based on these data sets (Aguiar and Hurst, 2007; Guryan et al., 2008; Ramey and Ramey, 2010; Sevilla, Gimenez-Nadal and Gershuny, 2012). For the sake of comparison with prior studies (Aguiar and Hurst, 2007; GimenezNadal and Sevilla, 2012), and to minimize the role of time-allocation decisions, such as education and retirement, that have a strong inter-temporal component over the life cycle, we restrict the sample used throughout our analysis to workers between the ages of 21 and 65 (inclusive). Furthermore, given that workers may have reported their activities during non-working days, and thus they do not have any commuting time, we restrict the analysis to working days, defined as those days where individuals devoted at least 60 minutes to market work activities, excluding commuting. Our model is based on the comparison between employed and self-employed workers, but in the ATUS other categories are considered, such as workers in the public sector. Given that the model is based on a direct comparison between employees and the self-employed, we restrict the analysis to both self-employed and employed (i.e., private) workers, excluding other categories. These restrictions leave us with 28,700 observations, 15,426 male and 13,274 female. Figure 3 shows the average time devoted to commuting during the years of the survey, for the selected sample. We have added a linear trend based on the average values, in order to obtain an idea of the trends in commuting time. We observe that commuting time has increased during the years of the survey, consistent with prior studies finding that commuting time in the US has increased (Kirby and LeSage, 2009; McKenzie and Rapino, 2009; Gimenez-Nadal and Molina, 2014). Also,
7
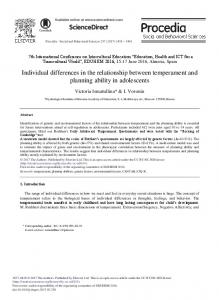
men devote more time to commuting in comparison to women, consistent with Gimenez-Nadal and Molina (2016). Regarding the time devoted to commuting, we consider the time of “commuting to/from work”, coded with the activity code “180501”. Also, given that we restrict the analysis to working days, we define “market work” as the time devoted to the sum of the following categories: “work, main job (not at home)”, “working nec (not at home)”, “work-related activities nec (not at home)”, “work & related activities nec (not at home)”, and “waiting work related activities (not home)”. Table 1 shows the average time devoted to commuting by employed and self-employed workers on their working days, by gender. Self-employed men and women devote an average time of 36.44 and 21.86 minutes per working day to commuting, respectively, while employed men and women devoted 45.59 and 36.09 minutes per working day to commuting. Thus, we find a difference of 9.15 minutes between self-employed and employed male workers, which represents a difference in commuting time of 20%, and a difference of 14.23 between self-employed and employed female workers, which represents a difference in commuting time of 39%, with both differences being statistically significant at standard levels. Furthermore, we find that both employed and self-employed males devote more time to commuting compared to their female counterparts, which is consistent with Gimenez-Nadal and Molina (2016). Considering the time devoted to market work, we find that male and female workers devote 492.60 and 409.90 minutes per working day, respectively, if they are self-employed, while their counterparts devote 516.15 and 462.46 minutes per working day, respectively. Thus, in comparison with employed workers, self-employed male and female workers devote 23.55 and 52.56 fewer minutes per day to these activities, with such differences being statistically significant at standard levels. These differences indicate that self-employed workers devote less time to commuting and market work compared to employed workers, which is also consistent with the positive relationship between commuting and market work reported in Schwanen and Dijst (2002) and Gimenez-Nadal and Molina (2014). Figure 4 shows k-density distributions for the time devoted to commuting, according to their employment status, for both men and women. We observe that the time devoted to Commuting is concentrated between 0 and 2 hours per day for both men and women, and that the variation in Commuting for women is smaller than the
8
variation for men, as the variance coefficients yield values of 1.038 for men and 1.051 for women. By employment status, we observe that self-employed men and women have greater variations in commuting time compared to their counterparts, as the variance coefficients yield values of 1.348 and 1.521 for self-employed men and women, while the variance coefficients yield values of 0.984 and 1.007 for employed men and women, respectively. We have defined other variables that may affect the time devoted to commuting by workers (see Gimenez-Nadal and Molina (2016) for a review). We define age of respondents, education, race, being a citizen of the US, whether the respondent lives in couple, respondent’s couple labor status, number of working hours per week (selfreported, retrospective method), total monthly household income, the number of children in the household, and family size.2 For education, we consider 3 educational levels: primary education (less than high school diploma), secondary education (high school diploma) and university education (more than high school diploma), and we define 3 dummies. In the case of race, we define a dummy variable considering the respondent being white (1) or not (0). The same applies for the variable about citizenship; we create a dummy variable considering the respondent having US citizenship (1) or not (0). We also identify individuals living in couple, or not, and those whose partner is working, with 2 dummy variables. Household income is defined as the combined income of all family members during the last 12 months and includes money from jobs; net income from business, farm or rent; pensions; dividends; interest; Social Security payments; and any other money income received by family members who are 15 years of age or older. Household income is reported along sixteen income intervals ranging from less than US$ 5,000 to US$150,000 and more. For the top income category, we assume the same interval width as for the one second to the top. Table 1 shows that, compared to employees, self-employed workers are relatively older, have a higher level of education (i.e. a higher proportion of workers with university education), a higher proportion are whites, and are non-citizens. Furthermore, self-employed workers have, in comparison to employees, a higher probability of living
2
Existing research has shown a relationship between wages and individual commuting behaviour (Van Ommeren, van den Berg and Gorter, 2000; Rupert, Stancanelli and Wasmer, 2009). However, the inclusion of wages in the analysis of commuting time may lead to endogeneity problems. Thus, and to the extent that income and education have been found to have a positive relationship to commuting time, we use education and household income as proxies for earnings
9
in couple, and thus of having a working partner. Also, self-employed workers have statistically significant higher household income levels and smaller daily working hours than employees, although the differences in the weekly working hours are not significant for male workers. We also take into account in our analysis the occupation and industry of workers. Most theoretical models assume that workers are homogeneous, in the sense that workers are directly comparable. However, there may be certain industries and occupations where it is more difficult to run a business, and thus the characteristics of workers in those sectors may differ more than in others. Furthermore, prior research has shown a relationship between occupations and commuting (Hanson and Johnston, 1985; Gordon, Kumar and Richardson, 1989; Hanson and Pratt, 1995), as for instance femaledominated occupations are more evenly distributed compared to men, and thus women may choose jobs closer to home. For this reason, and given that we have information on the occupation and industry, we define the occupation and industry of workers. In doing so, we consider the classification used by the ATUS dataset, that uses the 2002/2010 Census Occupation Classification and the 2002/2007 Census Industry Classification, to classify workers according to their respective occupation and industry. From these industry and occupation original codes, the ATUS team aggregates the industry and occupation codes into 14 and 11 categories. For industry, the following categories are defined:
Agriculture,
forestry,
fishing,
and
hunting;
Mining;
Construction;
Manufacturing; Wholesale and retail trade; Transportation and utilities; Information; Financial activities; Professional and business services; Educational and health services; Leisure and hospitality; Other services; Public administration; and Armed Forces. For occupation, the following categories are defined: Management, business, and financial; Professional and related; Service; Sales and related; Office and administrative support; Farming, fishing, and forestry; Construction and extraction; Installation, maintenance, and repair; Production; Transportation and materials moving; and Armed Forces. Table 1 shows that self-employed workers have a significantly higher probability of being in a management, business, financial, sales, construction and extraction occupation than employees. Regarding industries, the self-employed have greater probabilities of working in Agriculture, forestry, fishing and hunting; Construction, and Professional and business services than employees. In any case, there are no significant differences between the self-employed and employees in Professional occupations (only for men);
10
Farming, fishing and forestry, and Installation occupations (only for women); Financial, Services and Education and health industries (only for men); Mining and Sales industries (only for women), and Leisure industry (for both men and women). Thus, given the heterogeneity of the two groups of workers, which may condition the observed differences in commuting time, it is important to control for the type of industry and occupation of the worker. The ATUS allows us to compute the mode of transport of all the commuting episodes. Respondents report their commuting episodes, together with whether the commuting episode was done by car, public transport, etc… Thus, we compute the percentage of commuting that is done via different modes of transport, measured as the percentage of the total time in commuting. For example, for commuting time by car we sum the commuting time using this mode of transport, and we divide the sum by the total time devoted to commuting. We have defined the following modes of transport: private vehicle (car, truck, or motorcycle (driver); car, truck, or motorcycle (passenger)), active commuting (walking, bicycle), public transport (bus, subway/train, boat/ferry, taxi/limousine service), and other transport (airplane, other mode of transportation). Table 1 shows the percentage of commuting time that is done using the different categories of transport. 3 For men and women, the predominant mode of transport is by private vehicle, followed by active commuting and public transport, although there are differences between employees and the self-employed as the former have a higher proportion using private vehicles, with this difference being especially large in the case of women workers. Employees also appear to do more active commuting, and commuting by public transport, which may indicate that employees have longer commutes in comparison to the self-employed. Given such differences in the mode of transport, we will develop a specific analysis of differences in commuting time between employees and the self-employed. Finally, we consider the demographic location of individuals, following the US Census Bureau’s categorization of metropolitan areas, which will allow us to test our theoretical model. Despite that the Census Bureau's terminology for metropolitan areas and the classification of specific areas changes over time, the general concept is 3
Here, we must consider that some workers report no commuting on their working days. It could be the case of delivery drivers, whose time driving is computed as part of market work. Thus, given that some workers do not report any commuting time, the sum of the percentage of commuting done in the differenct modes of transport is not equal to 1.
11
consistent: a metropolitan area consists of a large population center and adjacent communities that have a high degree of economic and social interaction. The geographic information included in the ATUS includes a categorization of households as to whether they are in the central city within a metropolitan area, on the fringe of a metropolitan area (or just in a metropolitan area if no distinction is made) or in a nonmetropolitan area. Some small metropolitan areas do not have a central city/outlying area distinction, so households in those areas are excluded from the analysis. We define 3 dummy variables as follows: metropolitan (central city within a metropolitan area), fringe metropolitan (fringe of a metropolitan area) and non-metropolitan. As shown in Table 1, employees have a greater probability of being in a metropolitan center, and thus a lesser probability of being in a non-metropolitan area, with such differences being statistically significant at standard levels. Furthermore, we use the information about the size of the area of residence. The ATUS includes information about the population size of the metropolitan area in which a household is located, that is coded as follows: 2) 100,000-249,999 inhabit, 3) 250,000-499,999 inhabit, 4) 999,999 inhabit, 5) 1,000,000-2,499,999
500,000-
inhabit, 6) 2,500,000–4,999,999 inhabit,
and 7) 5,000,000+ inhabit. As shown in Table 1, both men and women employees tend to live in more populated metropolitan areas than do the self-employed.
4. Econometric analysis and results We estimate OLS regressions on the time devoted to commuting. However, since some individuals report no time in commuting (11.75% and 12.91% of men and women, respectively, during their working days) there can be some controversy regarding the selection of alternative models, such as that of Tobin (1958). According to Frazis and Stewart (2012), OLS models are preferred in the analysis of time allocation decisions, since estimation techniques for limited dependent variables that assume a non-linear functional form, such as the Tobit model, will be inconsistent if we want to estimate means of long-run time use from a sample of daily observations. Gershuny (2012) argues that estimations derived from single-day diaries have the problem of too many zeros, but traditional diary studies can still produce accurate estimates of mean times in activities for samples and subgroups. Within this framework, Foster and Kalenkoski (2013) compare the use of Tobit and OLS models in the analysis of the time devoted to
12
childcare activities, and find that the qualitative conclusions are similar for the two estimation methods. Thus, we rely on OLS models. The statistical model is as follows. For a given individual ‘i’, let Ci represent the daily hours individual “i” devotes to commuting, let Privatei be a dummy variable to indicate whether respondent “i” is an employee (1) or not (0), let Xi be a vector of sociodemographic and regional characteristics, and let εi be random variables that represent unmeasured factors. We estimate the following equation:
Ci 1Privatei X i i
(1)
where Ci represents the time devoted to Commuting by individual “i”. Given our theoretical framework, where employees have more commuting compared to the selfemployed, we would expect to find that β
0. Given prior research showing that the
factors affecting time-allocation decisions of men and women are different (GimenezNadal and Sevilla, 2011; 2012; Gimenez-Nadal and Molina, 2014, 2016), we run each model separately by gender. Since the distributions of commuting time do not follow a normal distribution, we have corrected the standard errors to obtain robust standard errors. The vector X includes socio-demographic characteristics as described in Section 3. Primary education is chosen as the education level of reference. We have also included vectors of dummy variables to scale the day of the week (ref.: Monday) and the year (ref: 2003), and a vector of dummy variables to control for the state of residence (ref.: Alabama). Table 2 shows the results of estimating Equation (1) on the time devoted to commuting.4 Columns 1, 2 and 3 show the results of estimating Equation (1) for all workers, male, and female, respectively. We find that for all workers the coefficient for employee is positive and statistically significant at standard levels, indicating that employees spend comparatively more time in daily commuting than the self-employed. The same conclusions can be obtained if we restrict the analysis to male (Column 2) and female (Column 3) workers. In particular, excess commuting due to search imperfections in the labor market is, on average, of 10 minutes 30 seconds for men and 13 minutes 50 seconds for women. This is consistent with our theoretical framework, and given that the time devoted to commuting is 45.591 and 36.094 minutes per day for 4 We have estimated all the models, including the time devoted to market work during the day of the survey, and the results are robust to the inclusion of daily market work time (see Tables A1, A2 and A3 in Appendix).
13
males and females, this excess commuting represents 23% and 37% of the daily commuting of workers. Our results show a lower level of excess commuting over total commuting, compared to prior studies of commuting, where linear programming times between areas are used, partially correcting the problems of these studies (van Ommeren and van der Straaten, 2008). We have alternatively estimated Equation (1) for all workers (Column 4), males (Column 5) and females (Column 6), using an alternative definition of commuting, where we have included the categories “travel related to work nec” (coded as “1805099”) and “travel related to income gen activity” (coded as “180503”). Results do not change with the definition of commuting used, which indicates the consistency of our results. We also find that age has an inverted U-shaped relationship with commuting time, with this relationship being concentrated on women only, and the maximum commuting time being reached at the age of 40. Controlling the basic education level, secondary education is only significant among women, with a negative relationship. Race is only significant among women (being white implies less commuting time) and being a US citizen is always significant and negative related to commuting time. Household income has a positive relationship with commuting time, as higher household income usually means more time in commuting. In the absence of information on wage rates, personal income and education can be used as proxies, and have been found to have a positive influence on commuting times (Rouwendal and Nijkamp, 2004; Dargay and Van Ommeren, 2005; Susilo and Maat, 2007; Sandow, 2008; Sandow and Westin, 2010; Dargay and Clark, 2012). When individuals have higher household income, it could mean that wages are also higher, and thus workers devote more time to commuting (Manning, 2003). Furthermore, having children is negatively related to the time devoted to commuting by women, which is consistent with the Household-Responsibilities Hypothesis (Gimenez-Nadal and Molina, 2016) as women usually look for job locations close to their homes, in order to fulfill their household responsibilities, and thus the commuting time of mothers is comparatively lower than the commuting time of nonmothers. The normal number of hours of work per week has a positive relationship with commuting, while men who live in couple tend to do more commuting because they often need more income, so they look for more specialized jobs (Flowerdew, 1992; Green, 1997; McQuaid and Chen, 2012). On the contrary, when in a couple where both members have an active labor status, the effect is negative on commuting time.
14
Table 3 shows the results of estimating Equation (1) for men and women, depending on the mode of transport. We define mode of transport as commuting done exclusively by private vehicle (car, truck, or motorcycle (driver); car, truck, or motorcycle (passenger)), active commuting (walking, bicycle), or public transport (bus, subway/train, boat/ferry, taxi/limousine service). We exclude airplane and other modes of transportation, given that there is not enough variation in those modes across employment status. Additionally, given that combined commuting may be difficult to interpret, we restrict the analysis to individuals whose commuting is done with one mode of transport only. Van Ommeren and Van der Straaten (2008) find that the effect of being self-employed is somewhat smaller (in absolute sign) on commuting time than on distance, suggesting that the self-employed travel faster, as there are differences between the two groups about the choice of mode of transport. Thus, we analyze differences in commuting time between the employed and the self-employed by mode of transport, so that differences between the two groups are not due to differences in mode of transport. Table 3 shows that differences in the time devoted to commuting between the employed and the self-employed are concentrated on private transport and active commuting for men, and private transport for women. In the case of males, employees devote 5.390 more minutes per day to commuting when they use private transport, and 12.95 more minutes per day when they do active commuting, in comparison with their self-employed counterparts. In the case of women, employees devote 4.099 more minutes per day to commuting when they use private transport in comparison with their self-employed counterparts. We also find that male whites who travel by private vehicle devote more time to commuting in comparison with blacks and other ethnicities, consistent with the Spatial Mismatch Hypothesis (Klain, 1968; Zax and Klain, 1996; Zenou, 2002). Column (1) in Table 4 estimates Equation (1) when we include variables about the geographical characteristics of the respondent. The reference category are individuals living in a central city within a metropolitan area, and we include two dummy variables to control for whether respondents live on the fringe of a metropolitan area (or just in a metropolitan area if no distinction is made) or in a non-metropolitan area. Additionally, we include a variable to control for the size of the city. We observe that, in comparison with individuals living in a central city within a metropolitan area, individuals living on the fringe of a metropolitan area devote 2.710 more minutes per day to commuting,
15
while individuals living in a nonmetropolitan area devote 8.136 more minutes per day to commuting. These results give empirical support to our new “Diana” model, as the farther people live from the metropolitan core, the more time they devote to commuting, which is consistent with our theoretical hypothesis that most job vacancies are in city centers. Furthermore, we find that the greater the city size, the more the time devoted to commuting, indicating that individuals who live in crowded places tend to have longer commuting times (but not necessarily longer commuting distances, since the mode of transport also determines the time of the commute). Columns 2 to 4 of Table 4 show the results for men, and Columns 5 to 7 of Table 4 show the results for women, considering whether respondents live in metropolitan centers, fringe metropolitan areas, and non-metropolitan areas. We can observe how labor market imperfections have the expected effect, according to Table 1, and to a greater extent as we approach the metropolitan center. The MSA size again has a positive and significant effect on commuting time, and age and education level results are in line with Tables 1 and 2. The Household-Responsibilities Hypothesis and the labor status of the couple have the expected relationships, according to Table 1. The Spatial Mismatch Hypothesis is again verified for male workers who live on the fringe of a metropolitan area.
5. GIS modeling In this Section, we present a graphical analysis to illustrate our results regarding commuting time and state of residence. In doing so, we use a Geographical Information System (GIS) model based on individuals living in US cities (according to their longitude-latitude), and in each city we represent the average commute of the workers in the reference city. Such models are based on the conformal conical projection of J.H. Lambert; that is, from an Earth map some characteristics of interest are represented, using data on latitude and longitude. An analysis of commuting using this model can be found in Kwan and Kotsev (2015), who analyze commuting patterns of individuals living in the city of Sofia, Bulgaria. The authors use a microeconomics-based geographical model with detailed information about commuting time, and the different locations of the places of residence and work, to analyze differences in commuting patterns, controlling by gender and the mode of transport. Other papers about
16
commuting that use visual evidence and GIS modeling are Kwan (2000), Kwan (2004) and Shen, Kwan and Chai (2013). For our purposes, the application that has been used to generate the model is ArcGIS (Esri). From a map of the US, we include the location (with latitude and longitude) of the main cities of each state, the average commute of the individuals living in each state, and the population of each state. Due to the type of data we have at hand, we have not been able to develop an in-depth analysis, as in Kwan and Kotsev (2015), and we must focus on a national level with a certain degree of disaggregation. The purpose of our graphical analysis is to see that those areas with higher average commuting are also the most populous states, with the biggest cities. This relationship seems self-evident but, if we consider that in large cities a large amount of jobs and houses are located in a very concentrated space, in comparison with less populated areas, where it is very likely that individuals must travel comparatively longer distances from their homes to their jobs, we could find that commuting time does not necessarily have a direct relationship to the distance travelled, and does not depend only on the mode of transport, but also on the place characteristics and the job location. Figure 5 shows the average commuting time by state, in relation to the population of the state. We find that average commuting time is greater in more populous states, especially on the East coast. Considering that cities on the East coast represent a set of heavily-populated cities, and the states are not very large in size, we can think of intensely populated areas having higher commuting times, which may indicate that individuals living in them have a long commuting time not because they cover large distances, but because of other urban characteristics.
6. Conclusions This paper analyses the commuting behavior of workers in the US, focusing on the daily commuting time of workers in the period 2003-2013. In doing so, we aim to measure the “excess commuting” defined as the commuting originated due to job market imperfections. In doing so, we offer an updated measure of the time devoted to commuting, and we find that 20% and 39% of the total commuting of males and females, respectively, is “excess commuting”, with such differences being concentrated in private transport users and male active commuters. These results are in line with those obtained in other studies, although they differ slightly from the traditional works using flows, Operational Research techniques, or National Travel Surveys, which offer
17
commuting excesses of 50%. This divergence may indicate that time use surveys are useful in refining the measures of excess commuting. We also develop a new theoretical model for commuting around urban centers, and in the empirical testing of the model we find that commuting time is longer for workers living in non-metropolitan areas, which places urban centers as the core of economic activity. In short, the new theoretical model appears to be consistent with the US reality. We also show how the commute is longer in crowded cities, indicating that congestion and distance are positively related to commuting time. We hope that our results will stimulate further research on the topic of commuting behavior and “excess commuting”. Theoretical, as well as further empirical, research is needed to shed light on the question of how commuting behavior changes over time, and to determine how new infrastructures (e.g., highways, metro lines…) contribute to this behavior. It may be that policies aimed to promote rental housing favor the reduction of commuting, as location costs would be reduced and workers would tend to locate closer to the urban centers. Here, we have the case of Spain, a country with a high propensity to own housing property, and where young individuals were given a fixed monthly amount of money for rental housing, which allowed them to “leave the nest” and set up their own house. It may be of interest to see if this measure would be useful, given that since the majority mode of transport is by private car and the commute is a significant emitter of greenhouse gases. Finally, and given that most commuting is done by car, encouraging the use of public transport and investing in it would significantly reduce these emissions. The study of the environmental impact of commuting is a field that has been largely overlooked. The data used in this paper impose one limitation, as the ATUS is a cross-section of individuals, which does not allow us to identify the relationship between commuting and self-employment status hours net of (permanent) individual heterogeneity in preferences. As argued by Van Ommeren and Van der Straaten (2008), selection into self-employment is an important issue, since there may be unobserved factors related to both the decision to be self-employed (vs. employed) and how much time to spend in daily commuting. Alternative datasets with a panel data structure, such as the British Household Panel Survey, The German Socio-Economic Panel, and the Panel Study of Income Dynamics, all provide information on both commuting behavior and employment, which could be used to investigate this topic. Furthermore, no information
18
about residence location is available for respondents. Despite that there is information for certain geographic characteristics, there is no information on residence location, and Giuliano (1998) shows that residence location patterns of the self-employed do not differ from those of the employees. These issues may be biasing our results, and thus we leave them for future research.
References Aguiar, M. and E. Hurst (2007). “Measuring trends in leisure: the allocation of time over five decades,” Quarterly of Journal Economics 122, 969-1007. Alonso, W. (1964). “Location and Land Use,” Harvard University Press, Cambridge. Van den Berg, G.J., and C. Gorter (1997). “Job search and commuting time,” Journal of Business and Economic Statistics 15, 269–281. Bianchi, S., M. Milkie., L. Sayer and J.P. Robinson (2000). “Is anyone doing the housework? Trends in the gender division of household labor,” Social Forces 79, 191–228. Bonke, J. (2005). “Paid work and unpaid work: Diary information versus questionnaire information,” Social Indicators Research 70, 349–368. Cameron, G. and J. Muellbauer (1998). “The housing market and regional commuting and migration choices,” Scottish Journal of Political Economy 45, 420–446. Cropper, M.L. and Gordon, P. (1991). “Wasteful Commuting: A Re-examination,” Journal of Urban Economics 29, 2-13. DeSalvo, J.S., and M. Huq (1996). “Income: residential location, and mode choice,” Journal of Urban Economics 40, 84–99. Evans, G.W., R.E Wener and D. Phillips (2002). “The morning rush hour: predictability and commuter stress,” Environment and Behavior 34, 521–530. Flowerdew, R. 1992. “Labour market operation and geographical mobility,” in A.G. Champion and A.J. Fielding (eds), Migration Processes and Patterns Volume 1: Research Progress and Prospects. London: Belhaven Press, pp. 77-101. Foster, G. and C. Kalenkoski (2013). “Tobit or OLS? An empirical evaluation under different diary window lengths,” Applied Economics 45, 2994-3010.
19
Frazis, H., and J. Stewart (2012). “How to Think About Time-Use Data: What Inferences Can We Make About Long- and Short-Run Time Use from Time Use Diaries?” Annals of Economics and Statistics 105/106, 231-246. Frey, B.S., and A. Stutzer (2008). Stress that Doesn”t Pay: The Commuting Paradox,” Scandinavian Journal of Economics 110, 339-366 Garreau, J. (1991). Edge City: Life on the New Frontier. Doubleday, New York. Gershuny, J. (2012). “Too Many Zeros: A Method for Estimating Long-term Time-use from Short Diaries,” Annals of Economics and Statistics 105/106, 247-270. Gimenez-Nadal, J.I. and J.A. Molina (2014). “Commuting Time and Labour Supply in the Netherlands: A Time Use Study,” Journal of Transport Economics and Policy 48, 409-426. Gimenez-Nadal, J.I. and J.A. Molina (2016). “Commuting Time and Household Responsibilities: Evidence using Propensity Score Matching,” IZA Discussion Paper 8749. Gimenez-Nadal, J.I., and A. Sevilla (2011). “The Time-Crunch Paradox,” Social Indicators Research 102: 181-196. Gimenez-Nadal, J.I. and A. Sevilla (2012). “Trends in time allocation: a cross-country analysis,” European Economic Review 56, 1338-1359. Giuliano, G. (1998). “Information technology, work patterns and intra-metropolitan location: a case study,” Urban Studies 35, 1077–1095 Gordon, P., A. Kumar and H. Richardson (1989). “Gender differences in metropolitan travel behavior,” Regional Studies 23: 499–510. Gottholmseder, G., K. Nowotny, G.J.Pruckner and E. Theurl (2009). “Stress perception and commuting,” Health Economics 18, 559-576. Green, A. E. (1997). “A question of compromise? Case study evidence on the location and mobility strategies of dual career households,” Regional Studies, 31(7), 641-657. Guryan, J., E. Hurst, and M. Kearney (2008). “Parental education and parental time with children,” Journal of Economic Perspectives 22: 23–46. Hamilton, B.W. (1982). “Wasteful commuting,” Journal of Political Economy 90, 1035-1053.
20
Hämmig, O., F. Gutzwiller and G. Bauer (2009). “Work-life conflict and associations with work and nonwork-related factors and with physical and mental health outcomes: a national representative cross-sectional study in Switzerland,” BMC Public Health 9, 435. Hansson, E.,
K. Mattisson, J. Björk, P. Östergren and K. Jakobsson (2011).
“Relationship between commuting and health outcomes in a cross-sectional population survey in southern Sweden,” BMC Public Health 11, 834. Hanson, S. and I. Johnston (1985). “Gender differences in work trip lengths: Implications and explanations,” Urban Geography 6: 193–219. Hanson, S. and G. Pratt (1995). Gender work and space. International Studies of Women and Place. London: Routledge. Hennessy, D.A., and D.L. Wiesenthal (1999). “Traffic congestion, driver stress, and driver aggression,” Aggressive Behavior 25, 409–423. Holzer, H.J. (1994). “Work, search and travel among white and black youth,” Journal of Urban Economics 35, 320-345. Jansen, N.W.H., I.J. Kant, T.S. Kristensen and F.J.N. Nijhuis (2003). “Antecedents and Consequences of Work-Family Conflict: A Prospective Cohort Study,” Journal of Occupational and Environmental Medicine 45, 479-491. Juster, T. and F. Stafford (1985). Time, Goods, and Well-Being. Ann Arbor, MI: Institute for Social Research. Kahneman, D. and A.B. Krueger (2006). “Developments in the Measurement of Subjective Well-Being,” Journal of Economic Perspectives 20, 3-24. Kahneman, D., A.B. Krueger, D. Schkade, N. Schwarz and A. Stone (2004). “A Survey Method for Characterizing Daily Life Experience: The Day Reconstruction Method,” Science 3, 1776-1780. Kanaroglu, P.S., C.D. Higgins and T.A. Chowdhurry (2015). “Excess commuting: a critical review and comparative analysis of concepts, índices and policy implications,” Journal of Transport Geography 44, 13-23.
21
Kenworthy, J.R., and F.B. Laube (1999). “Patterns of automobile dependence in cities: an international overview of key physical and economic dimensions with some implications for urban policy,” Transportation Research Part A 33, 691–723. Kirby, D.K. and J.P. LeSage (2009). “Changes in commuting to work times over the 1990 to 2000 period,” Regional Science and Urban Economics 39, 460-471. Kitamura, R., and S. Fujii (1997). “Time-use data, analysis and modeling: toward the next generation of transportation planning methodologies,” Transport Policy 4, 225-235. Klain, J.F. (1968). “Housing segregation, negro employment, and Metropolitan decentralization,” Quarterly Journal of Economics 82, 175-197. Knox, P.L., and L. McCarthy (2005). Urbanization: An Introduction to Urban Geography, Second edn, Prentice Hall, Englewood Cliffs, NJ. Koslowsky, M., A. Kluger and Reich (1995). Commuting Stress: Causes, Effects and Methods of Coping. Plenum, New York. Kwan, M-P. (2000). “Interactive geovisualization of activity-travel patterns using threedimensional geographical information systems: a mathodological exploration with a large data set,” Transportation Research Part C: Emerging technology, 8, 185203. Kwan, M-P. (2004). “GIS methods in time-geographical research: geocomputation and geovisualization of human activity patterns,” Geografiska Annaler Series B: Human Geography, 84, 267-80. Kwan, M-P. and A. Kotsev (2015). “Gender differences in commute time and accessibility in Sofia, Bulgaria: a study using 3D geovisualization,” The Geographical Journal, 181, 83-96. Mills, E.S. (1967). “An aggregative model of resource allocation in a metropolitan area,” American Economic Review 57, 197-210. Ma, K.M. and D. Banister (2006). “Excess commuting: a critical review,” Transport Reviews 26, 749-767. McQuaid, R. W., and T. Chen (2012). “Commuting times – The role of gender, children and part-time work,” Research in Transportation Economics, 34(1), 66-73.
22
Manning, A. (2003). “The real thin theory: monopsony in modern labor markets,” Labour Economics 10, 749-767. Martin, A., Y. Goryakin, and M. Suhrcke (2014). “Does active commuting improve psiychological wellbeing? Longitudinal evidence from eighteen waves of the British Household Panel Survey,” Preventive Medicine 69, 296-303. Muth, R.F. (1969). Cities and Housing: The Spatial Pattern of Urban Residential Land Use. University of Chicago Press, Chicago, IL. Muller, P.O. (1981). Contemporary Suburban America. Prentice Hall, NJ. McKenzie, B., and M. Rapino (2009). “Commuting in the United Stated: 2009,” U.S. Department of Commerce, Economics and Statistics Administration, U.S. CENSUS BUREAU. Novaco, R.W., and O.I. Gonzalez (2009). Commuting and Well-being. In Y. AmichaiHamburger (Ed.), Technology and Psychological Well-Being (pp. 174-205). Cambridge University Press, Cambridge, U.K. Novaco, R.W., D. Stokols and L. Milanesi (1990). “Objective and subjective dimensions of travel impedance as determinants of commuting stress,” American Journal of Community Psychology 18, 231–257. Van Ommeren, J. (1998). “On-the-job search behavior: the importance of commuting time,” Land Economics 74, 526–540. Van Ommeren, J.N. and J.W. van der Straaten (2008). “The effect of search imperfections on commuting behavior: Evidence from employed and self-employed workers,” Regional Science and Urban Economics 38, 127-147. Ramey, G. and V.A. Ramey (2010). “The Rug Rat Race,” Nber Working Paper Series 15284, National Bureau of Economic Research. Robinson, J.P. (1985). “The validity and reliability of diaries versus alternative time use measures,” in Time, goods, and well-being: Juster and Stafford (eds). Ann Arbor, MI: The University of Michigan, pp 33–62. Roberts, J., R. Hodgson and P. Dolan (2011). “It’s driving her mad: Gender differences in the effects of commuting on psychological health,” Journal of Health Economics 30, 1064-1076.
23
Rodriguez, D (2004). “Spatial choices and excess commuting: a case study of bank tellers in Bogota, Colombia,” Journal of Transport Geography 12, 49-61. Rouwendal, J. (2004). “Search theory and commuting behavior,” Growth and Change 35, 391–417. Schaeffer, M., S. Street, J. Singer and A. Baum (1988). “Effects of control on the stress reactions of commuters.” Journal of Applied Social Psychology 18, 944–957. Schwanen, T., and M. Dijst (2002). “Travel-time ratios for visits to the workplace: the relationship between commuting time and work duration”, Transportation Research Part A 36, 573-592. Sevilla, A., J.I. Gimenez-Nadal, and J. Gershuny (2010). “Leisure Inequality in the United States: 1965-2003,” IZA Discussion Papers 6708. Shen, Y., M-P. Kwan and Y. Chai (2013). “Investigating commuting flexibility with GPS data and 3D geovisualization: a case study of Beijing, China,” Journal of Transport Geography, 32, 1-11. Small, K. and S. Song (1992). “Wasteful commuting: a resolution,” Journal of Political Economy 100, 888-898. Susilo, Y.O. and K. Maat (2007). “The influence of built environment to the trends in commuting journeys in the Netherlands,” Transportation 34, 589-609. Tobin, J. (1958). “Estimation of relationships for limited dependent variables,” Econometrica 26: 24–36. Walsleben, J.A., R.G. Norman, R.D. Novak, E.B. O”Malley, D.M. Rapoport and K.D. Strohl (1999). “Sleep Habits of Long Island Rail Road Commuters,” Sleep 22,728734. Wasmer, E. and Y. Zenou (2002). “Does city structure affect job search and welfare?,” Journal of Urban Economics 51, 515-541. Weinberg, D.H., J. Friedman, J. and S.K. Mayo (1981). “Intraurban residential mobility: the role of transaction costs, market imperfections and household disequilibrium,” Journal of Urban Economics 9, 332-348. Wener, R.E., G.W. Evans, D. Phillips and N. Nadler (2003). “Running for the 7:45: the effects of public transit improvements on commuter stress,” Transportation 30, 203–220.
24
Yee-Kan, M. (2008). “Measuring Housework Participation: The Gap Between “Stylised” Questionnaire Estimates and Diary-Based Estimates,” Social Indicators Research 86, 381-400. Zax, J.S. (1991). “Compensation for commuters in labor and housing markets,” Journal of Urban Economics 30, 192-207. Zax, J. and J.F. Klain (1996). “Moving to the suburbs: de recolocating companies leave their black employees behind?,” Journal of Labor Economics 14, 472-493.
25
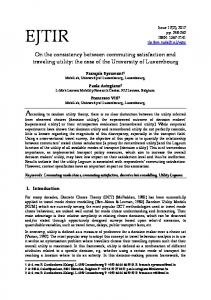
Figure 1. The “Diana” Model
Note: The black lines represent a city in a Diana diagram, in line with our assumption. The red dot is the dwelling of an individual and the red lines are displacements to respective possible job locations in different rings of the city.
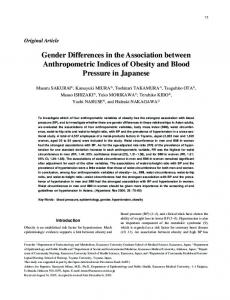
Figure 2. Linearization of the “Diana” Model
Note: The black lines represent a city in a linear diagram, in line with our relaxed assumption. The red dot is the dwelling of an individual and the red lines are displacements to respective possible job locations in different rings of the city.
Figure 3. Average commuting time by year and gender
Note: The sample is restricted to individuals between 21 and 65, who are not students and are not retired, working as self-employed or employed, from the ATUS 2003-2013. Commuting time is measured in hours per day.
26
Figure 4. K-density distributions of commuting time, by gender and self-employment status
Note: The sample is restricted to individuals between 21 and 65, who are not students and are not retired, working as self-employed or employed, from the ATUS 2003-2013. Commuting time is measured in hours per day.
27
Figure 5. Commuting time, by state of residence and population density
Source: American Time Use Survey. (link to map)
28
Table 1. Sum Stats of variables, by gender and self-employment status Variables
Commuting time Age Primary education Secondary education University education White Citizen In couple Couple working status No. weekly working hours Market work time Household income No. of children Family size Private vehicle Management, Business oc. Professional oc. Services oc. Sales oc. Office and Admin. oc. Farming, fishing, … oc. Construction oc. Installation oc. Production oc. Transportation oc. Agric., Forestry,… ind. Mining ind. Construction ind. Manufacturing ind. Wholesale ind.
Male Selfemployed Employees Diff Mean SD Mean SD 36.443 (49.146) 45.591 (44.896) 48.912 (12.216) 42.456 (11.992) 0.065 (0.246) 0.090 (0.286) 0.250 (0.439) 0.292 (0.455) 0.686 (0.464) 0.618 (0.486) 0.910 (0.287) 0.856 (0.351) 1.475 (1.201) 1.622 (1.367) 0.724 (0.447) 0.669 (0.471) 0.472 (0.499) 0.438 (0.496) 42.921 (21.759) 43.091 (14.591) 492.60 (192.62) 516.150 (134.64) 66687.6 (50405.9) 63780.0 (44691.9) 0.953 (1.241) 0.990 (1.153) 2.909 (1.510) 2.993 (1.511) 0.727 (0.445) 0.857 (0.350) 0.327 (0.469) 0.195 (0.396) 0.188 (0.391) 0.183 (0.387) 0.069 (0.154) 0.081 (0.273) 0.153 (0.360) 0.109 (0.311) 0.008 (0.090) 0.058 (0.234) 0.006 (0.081) 0.011 (0.108) 0.143 (0.350) 0.088 (0.283) 0.041 (0.198) 0.075 (0.264) 0.025 (0.158) 0.102 (0.303) 0.036 (0.187) 0.093 (0.290) 0.081 (0.274) 0.015 (0.124) 0.002 (0.052) 0.010 (0.100) 0.214 (0.410) 0.106 (0.308) 0.046 (0.210) 0.216 (0.411) 0.121 (0.326) 0.161 (0.367)
P-value diff -9.148 6.456 -0.025 -0.042 0.068 0.054 -0.147 0.056 0.034 -0.170 -23.550 -2907.6 -0.037 -0.084 -0.129 0.132 0.004 -0.011 0.044 -0.050 -0.005 -0.054 -0.034 -0.077 -0.056 0.066 -0.007 0.108 -0.170 -0.040
29
(