Exercise Difficulty Calibration Based on Student Log Mining Gautham Adithya Ravi
Sergey Sosnovsky
Saarland University Campus 66123 Saarbrücken, Germany +49 (0) 176 / 8904-8639
DFKI Campus D3.2 D-66123 Saarbrücken, Germany +49 (0) 681 / 85775-5367
[email protected]
[email protected]
ABSTRACT Predicting parameters of an exercise at the design time is not an easy task. We propose a new approach for re-evaluating learning characteristics of interactive exercises designed for Intelligent Tutoring Systems based on analyzing historical data from the exercise usage logs. It combines retrospective step-by-step prediction of student’s knowledge by the user modeling component of an ITS with the psychometric apparatus of Item Response Theory. The algorithm tries to take into account the reliability of log data and estimates the overall degree of trustworthiness for every suggested calibration. The evaluation of the approach has demonstrated that calibration of exercise difficulties improves the predictive validity of student modeling.
Categories and Subject Descriptors I.2.6 [Learning]: Parameter learning; K.3.1 [Computer Uses in Education]: Computer-assisted instruction.
easy to an under-performing student might result in repeated failures and frustration. Our approach aims at accurate calibration of exercise difficulty metadata in an ITS. First, we data-mine exercise activity logs to predict students’ knowledge of underlying concepts (see Figure 1); the students’ knowledge predictions are used as estimates of their ability to solve the exercises. Then, they are combined with the observed outcomes of consequent exercise attempts to infer the difficulty of the exercises used in the system. The approach relies on two well-founded techniques widely used in the field of learning analytics for probabilistic estimation of student mastery and difficulty of assessment. Bayesian Knowledge Tracing (KT) [1] is used to retrospectively compute student knowledge for the concepts involved in calibrated exercises. Item Response Theory (IRT) 2PL-model [2] is applied to estimate the exercise difficulty based on its history of attempts.
General Terms Algorithms, Design, Experimentation, Human Factors.
Keywords Intelligent Tutoring Systems, Student Modeling, Educational Data Mining, Learning Analytics, Exercise Difficulty, Knowledge Tracing, Item Response Theory
1. INTRODUCTION Providing accurate metadata is important for designing a successful online educational environment. Such issues as learning content discoverability, reusability, adaptability and extensibility directly depend on it. Metadata quality becomes even more significant for adaptive educational systems. Missing, incomplete and/or poorly constructed metadata can be one of the major factors affecting the functionality and effectiveness of elearning applications that try to intelligently construct personalized learning experiences for their users. For instance, inaccurate exercise difficulties will cause an Intelligent Tutoring System (ITS) to produce ineffective instruction: -
Presenting easy exercises that are incorrectly annotated as difficult, to a strong student can cause unnecessary drilling practice and boredom; Presenting difficult exercises that are incorrectly annotated as Permission to make digital or hard copies of all or part of this work for personal or classroom use is granted without fee provided that copies are not made or distributed for profit or commercial advantage and that copies bear this notice and the full citation on the first page. To copy otherwise, or republish, to post on servers or to redistribute to lists, requires prior specific permission and/or a fee. DAILE’2013, January 28, 2013, Villard-de-Lans, Vercors, France. Copyright 2010 ACM 1-58113-000-0/00/0010 …$15.00.
Figure 1. General approach
2. BACKGROUND THEORY This section briefly introduces the two main modeling techniques that our approach is built on.
2.1 Item Response Theory IRT helps to estimate the probability of a correct response to a test an item given the ability of an examinee. Thus, it provides a mapping model between the student’s parameters and the parameters of an exercise (such as difficulty) by bringing them to the same scale. The model is expressed as a logistic (sigmoid) function. The following formula represents a 2-parameter item model: 1 𝑃𝑟(𝜃) = 1 + 𝑒 ! !"#$%"&"'()"*'(!!!"##"$%&'() The probability Pr(θ) of a student with the ability θ to answer the item correctly depends on the two parameters of the function: -
The point on the ability scale where the probability of answering the item correctly (Pr(θ)) is equal to 0.5 represents the difficulty of an item. Difficulty defines the required ability
-
level, at which it becomes more probable to answer the item correctly. The rate, at which the logistic function grows, translates to the measure of the item’s discrimination between two students of different abilities. The higher is value of the function slope, the better the test item can distinguish between the student who have the necessary ability level and those that do not.
In addition to the 2-parameter model, there exist also the 1paramter model that treats all test items as having equivalent discriminations and 3-paremeter model that assumes the possibility of guessing.
2.2 Knowledge Tracing KT is a popular algorithm for probabilistic estimation of students’ mastery of knowledge components (skills and concepts) based on the history of attempts to solve related exercises. Given that a student’s attempt to solve an exercise can be classified as either correct or incorrect and considering that each exercise is associated with one or more knowledge components, KT models the evolution of student’s proficiency in applying these knowledge components. After every attempt to solve an exercise (i.e. to apply a corresponding knowledge component), the conditional probability of the student having mastered the knowledge component 𝑃 𝐿! 𝑅𝑒𝑠𝑢𝑙𝑡! is re-computed based on the following four parameters: -
𝑃 𝐿!!! – the probability that the knowledge component has been in a learnt state before the attempt; 𝑃(𝑆) – the probability that an incorrect attempt was caused by a slip (i.e. a knowledge component is already in a learnt state even though the related exercise was not solved correctly); 𝑃(𝐺) – the probability that a correct attempt was a result of a guess (i.e. a knowledge component is not in a learnt state yet even though the related exercise was solved correctly); 𝑃 𝑇 – the probability that a student learns a knowledge component while attempting to solve an item addressing it. 𝑃 𝐿!!! 𝐶𝑜𝑟𝑟𝑒𝑐𝑡! ) =
𝑃 𝐿!!! ∗ (1 − 𝑃(𝑆)) 𝑃 𝐿!!! ∗ 1 − 𝑃 𝑆
𝑃 𝐿!!! 𝐼𝑛𝑐𝑜𝑟𝑟𝑒𝑐𝑡! ) =
+ 1 − 𝑃 𝐿!!!
∗ 𝑃(𝐺)
𝑃 𝐿!!! ∗ 𝑃(𝑆) 𝑃 𝐿!!! ∗ 𝑃 𝑆 + 1 − 𝑃 𝐿!!!
∗ 1 − 𝑃 𝐺
𝑃 𝐿! 𝑅𝑒𝑠𝑢𝑙𝑡! = 𝑃 𝐿!!! 𝑅𝑒𝑠𝑢𝑙𝑡! + 1 − 𝑃 𝐿!!! 𝑅𝑒𝑠𝑢𝑙𝑡!
∗ 𝑃 𝑇
The main approach presented in this paper, does not have any constraints regarding the choice of student modeling technologies. We use KT, because it is a well-established algorithm for estimating student’s knowledge from their training history, and this allows us to assume a certain level of universality of the obtained results.
1. 2. 3.
Log filtering and enrichment; Student ability estimation; Exercise metadata calibration.
3.1 Log Filtering and Enrichment Before the logs can be processed by the main stages of the algorithm, they have to be cleaned to contain only the relevant events. For this purpose, first, we extract the log data produced by the target set of ITS users with the target set of exercises. Then, the log needs to be cleaned of the events not related to exercise activity, as it often contains a wide range of transactions, such as ‘User login/out’, ‘Page requested/presented’, ‘Note created/modified/deleted’, ‘Tool started/exited’ etc. Finally, we need to exclude any exercises that had missing or improper concept annotation. We have also filtered all the activity that involves students and/or exercises with a low number of registered events. This is done, because the ability estimates for students with poor interaction history and calibration of exercises with little data to support the calibration process is unreliable. Finally, we have enriched every event in our cleaned log data with the information on the concepts underlying the target exercise.
3.2 Student Ability Estimation During the next phase, the estimates for students’ knowledge of domain concepts are computed to further enrich the events in the log. We use the classic Bayesian KT model to represent student knowledge of a concept as the probability that a student has learnt the concept. The probability is calculated based on the sequence of attempts that a student submits for the exercises involving the concept. It is later used as a measure of student ability to apply the concept; thus, we attach it to the next event associated with an exercise requiring application of the concept. We also store, for each event, the number of previous events corresponding to the same student and concept; this serves as a measure of support (or reliability) of the current estimation from the past observations. Figure 2 illustrates this phase. The log data from the phase 1 combined with the step-by-step estimates of student-concept masteries constitute the final enriched log file. Every event in this log file corresponds to an application of a concept during an attempt to solve an exercise and contains seven fields: event id, student id, exercise id, concept id, the ability of a student prior to the current event, the number of supporting events prior to the current event (number of times this concept has been applied before), and the observed result of the current event (1 = correct attempt, 0 = incorrect attempt).
3. THE APPROACH Most ITSs maintain logs of all activities performed by students. The logged data could be stored in various ways, but typically include the basic information characterizing a single learning event, such as the time of the event, the actor (student ID), the object (exercise ID), the type of the event (submit an answer, move to the next step, ask for feedback, etc.) and the outcome (correct/incorrect). The domain and content models of the ITS also provide the mapping between the knowledge components and the exercises. The proposed approach uses all this information to calibrate the exercise difficulty metadata in the three main steps:
Figure 2. Event level – student ability estimation
3.3 Exercise Metadata Calibration The final phase of the proposed approach computes the IRT-based estimation of exercise difficulty metadata (see Figure 3). At this point, the events from the enriched logs produced at phase 2 are grouped per-exercise, clustered according to the student ability and used to fit the IRT sigmoid curve. The parameters of the curve help us to estimate exercise difficulty.
exercises with the ITS ActiveMath [4]. Evaluation was performed based on splitting the student population into the training set, containing 80% of all students and the testing set, containing the other 20%. The exercise difficulties were estimated using the events produced by the training set students. As a measure of success we used the prediction accuracy of the ITS’s user model computed using students from the testing set and the calibrated set of exercises. By comparing the predictions with the actual responses we computed several metrics, characterizing how well the resulting knowledge models help the ITS to reason about students’ proficiency. We did not evaluate the instructional effectiveness of the resulting ITS, but simply the predictive validity of its knowledge modeling components.
4.1 Data
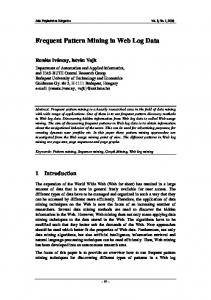
Figure 3. Exercise metadata calibration In order to fit the IRT sigmoid curve, we need a set of data points in the coordinate space probability of success vs. ability. First we address the “ability”-coordinate. For each exercise, we extract all corresponding events. We weight the events based on their reliability/support using Loge(support-1) as a factor. This is done to increase the role of more reliable events. If a student has accumulated rich history of attempting the concept prior to the target event, the KT-based estimate of students’ ability at this point will be reliable. If the target event is one of the first attempts for the concept, the model simply has not had enough evidence to produce a reliable estimate. Then, the weighted events for each exercise are clustered according to the associated ability value using a standard k-means clustering algorithm [3] into ten ability groups. The k-means algorithm iteratively minimizes the aggregate distance between each event’s ability estimate and the mean of the ability cluster. The means of the clusters become the “ability” coordinates of our data points. To find the “probability of success” coordinate, we compute the probability of correct attempt for every ability cluster as a ratio of the number of correct attempts to the total number of attempts. This gives us the required observations for estimating the exercise difficulty parameter of an exercise using the 2PL sigmoid function. For each exercise a sigmoid curve is then fit based on the obtained “ability - probability of success” pairs. We use the trust-regionreflective algorithm minimizing the least squares distance between the curve and the observation data points [5]. The parameters of the optimal sigmoid curve correspond to the difficulty and discrimination estimations of the target exercise.
4. EVALUATION We have evaluated the developed approach with the real data set collected from a class of university students solving interactive
The evaluation was performed on the ActiveMath logs collected in September – October 2009, in the Hochschule für Technik und Wirtschaft (University of Applied Sciences), Saarbrücken, Germany. A set of mathematical exercises was designed to support a bridging course for the new students covering the competencies required to successfully start learning universitylevel math. Overall, 371 students were working with 95 different exercises covering a total of 33 mathematical concepts. We filtered out exercises with event counts lower than the number of used ability clusters (k = 10). This reduced the number of exercises to 76, out of which 74 had registered events in the testing data set. The other numbers stayed the same. Table 1 summarizes the final training and testing datasets randomly sampled from the original logs. Table 1. Datasets summary Total Training set Testing set Events Students
13234
10741
2493
371
298
73
4.2 Difficulty Estimation Figure 4 demonstrates several examples of the IRT curves fitting the exercise usage data. The red points are the means of the clusters computed from estimates of student ability and corresponding average probabilities of successful attempts. The blue dashed lines are the optimal sigmoid curves fitting the data points. We have observed a high variability of results in terms of difficulty, discrimination (steepness of the curve), and goodness of fit. Tables 2 and 3 summarize exercise calibration process. Table 2 briefly characterizes how the events are distributed among the exercises. The number of supporting events per event is the count of the previous events corresponding to the same student and concept as the current event; it is, essentially, the reliability of the event and the KT knowledge estimate associated with it. Table 3 provides the summary of the difficulty metadata estimates, while Figure 5 plots the distribution of difficulty values. We can see that the majority of exercises concentrate at difficulty between 0.3 and 0.6. Yet, there is also a large portion of exercises with very a high difficulty. This is an interesting phenomenon that indicates the need to not only recalibrate these exercises’ difficulties, but to have a closer look at the exercises themselves. They might have errors or, otherwise, are too difficult for the target population of users, as only about 10% of attempts to solve these exercises have been correct. To identify the exact cause, a more detailed analysis is required, which is beyond the scope of this paper.
Table 2. Item calibration process – summary Number of Events per Exercise Number of Supporting Events per Event
Median
Mean
82
112.91
4.84
5.49
Median 0.5202
Mean 0.6189
Standard Deviation 0.2691
Table 4. Confusion matrix Predictions
Table 3. Exercise difficulty metadata – summary
of the exercise is greater than or equal to 0.5. The predictions were restricted to only correct and wrong solutions and did not consider partially correct solutions. Actual Responses True (P)
False (N)
True (P’)
True Positives (TP)
False Positives (FP)
False (N’)
False Negatives (FN)
True Negatives (TN)
Table 5. Formulas for positive and negative predictive values, predictive rates & F-1 measures Positive Predictive Value (PPV)
Positive Predictive Rate (PPR)
Negative Predictive Value (NPV)
Negative Predictive Rate (NPR)
TP + 0.5 TP + 0.5 TN + 0.5 TN + 0.5 TP + FP + 0.5 TP + FN + 0.5 TN + FN + 0.5 TN + FP + 0.5
Positive F-1 measure 2 ∗
Negative F-1 measure
PPV ∗ PPR PPV + PPR
2 ∗
NPV ∗ NPR NPV + NPR
Table 6. Formulas for joint predictive value, predictive rate & F-1 measure Joint Predictive Value (Weighted Avg.) (JPV)
Figure 4. Examples of exercise sigmoid functions
Joint Predictive Rate (Weighted Avg.) (JPR)
TP + FP + TP + FP + FN + TN TN + FN NPV ∗ TP + FP + FN + TN
PPV ∗
PPR ∗
TP + FN + TP + FP + FN + TN
NPR ∗
TN + FP TP + FP + FN + TN
Joint F-1 measure 2 ∗
Figure 5. Histogram representation of difficulty metadata
4.3 Evaluating Calibrated Difficulty The quality of our approach is measured using the confusion matrix as shown in Table 4. The predictive values, predictive rates and F-1 measures for the positive cases, negative cases and the cumulative one are computed as shown in Tables 5 and 6. Using the same student modeling component (KT model), a comparison was made between the predictions of the following three model configurations: the proposed approach with calibrated difficulties (KT + IRT), the original approach with difficulties manually annotated by a human expert (KT + Anno) and the simplified approach using only student modeling without any difficulty measures (Only KT). For the first two approaches, where the exercise difficulty was used, a correct solution was predicted if the probability of the student having mastered the underlying concept of the exercise is greater than or equal to the difficulty level of the exercise (represented as a probability for both, the IRT-based estimation and the manual annotation). For the third approach, a correct solution was predicted if the probability of the student having mastered the underlying concept
JPV ∗ JPR JPV + JPR
Tables 7-9 demonstrate the results of the predictions made by the three compared approaches. They show a considerable gain in the accuracy of student performance predictions for the model using calibrated exercise difficulties compared to the two others. Surprisingly, the no-difficulty model outperforms the model with manually annotated difficulties. This happens due to the fact that the experts providing difficulty values seemed to overestimate students’ proficiency (or underestimate the difficulty of the designed exercises): the count of false positive predictions is very high for the “KT+Anno” model. Compared to it, the “KT+IRT” and the “KT only” models generate more balanced predictions. Although, they also tend to overestimate students’ chance to solve an exercise more often than otherwise. Two possible explanations for it are: -
Overestimation at the beginning (when there is not enough information about a student, the KT probabilities are close to 0.5, which can result in too optimistic predictions); Presence of too difficult or erroneous exercises, which generate too many incorrect responses.
In either way, calibration of exercise difficulty according to the proposed approach allows our ITS to produce better predictions about the students’ ability to solve an exercise. This is an essential step towards implementing a more accurate and effective intelligent instruction.
Table 7. Confusion matrix results
KT + IRT
True Positives 906
False Positives 159
False Negatives 15
True Negatives 996
KT + Anno
911
Only KT
818
591
10
564
214
103
941
Table 8. Results for positive and negative predictive values, predictive rates & F-1 measures
KT + IRT KT+ Anno Only KT KT + IRT KT+ Anno Only KT
Positive Predictive Value 0.8508 0.6067
Positive Predictive Rate 0.9837 0.9891
Negative Predictive Value 0.9852 0.9826
Negative Predictive Rate 0.8624 0.4885
0.7927
0.8882
0.9014
0.8148
Positive F-1 measure 0.9124 0.7521 0.8377
Negative F-1 measure 0.9197 0.6526 0.8559
Table 9. Results for joint predictive value, predictive rate & F1 measure
KT + IRT KT + Anno Only KT
Joint Predictive Value 0.9328 0.7628 0.8763
Joint Predictive Rate 0.9290 0.7573 0.8672
Joint F-1 measure 0.9308 0.7599 0.8717
5. COMPARISON WITH OTHER CALIBRATION APPROACHES The approach proposed in this paper could be compared to Performance Factor Analysis (PFA) [6], which reconfigures Learning Factor Analysis (LFA) based cognitive model [7], using the 1PL-IRT. Evaluation of PFA as compared to KT based modeling has shown improvement in accuracy, especially when multi-concept exercises are considered [7]. Although another study by Gong et al. [8] comparing PFA and KT approaches failed to show much difference in accuracy improvement with PFA, the authors hypothesize that PFA works better in circumstances where exercises for a particular knowledge component vary greatly in difficulty, which has been the case in our dataset. This paper would be incomplete without addressing the traditional IRT-based calibration techniques originally used in Computer Adaptive Testing (CAT). A search for IRT-based exercise calibration techniques used outside of the field of educational data mining reveals the following approaches towards joint estimation of item (exercise) and ability IRT parameters. 1. Joint maximum likelihood (JML), exemplified by LOGIST [9, 10]; 2. Marginal maximum likelihood (MML), exemplified by BILOG [11]; 3. Bayesian estimation [12-14] 4. Markov chain Monte Carlo approaches (MCMC) The maximum likelihood estimation (MLE) approaches guarantee only local minima, due to the use of gradient decent based numerical methods to solve a non-convex problem, which is usually the case in educational data due to the noise created by erroneous or negatively discriminating items as well as student actions that are inconsistent with the their ability (e.g. a lucky
guess or a careless mistake). Any improvements the MML has over JML depend greatly on the chosen prior ability distribution, since MML separates the ability parameter optimization from the item parameter optimization using the Expectation Maximization (EM) algorithm [15]. The estimation approaches based on Bayesian hierarchical model, being more robust in estimating the prior information from the observed data have empirically proven to outperform MLE approaches, especially on small datasets [12, 14, 16]. MCMC methods have typically been used in more complex IRT settings where estimation of an item and ability at the same time is desired, but they are known to have a slower execution time even when employing randomization techniques for the estimation of the joint posterior distribution function of all parameters [17]. Our approach relies on the actual data, thus capitalizing on the prior information about the exercises and, specifically, exercise grouping based on the concepts they address. This enables a more robust and focused estimation of the student ability. The selection of the four KT parameters (initial probability of mastery, probability of slip, probability of guess and probability of transition) in our student modeling formula plays a vital role in the predictive performance of the approach. We estimate the optimal KT parameters based on the observed test data using a histogram based search. Relying on the robustness of our student ability predictions, we resort to a simple averaging of the conditional probability of a correct solution to an item, given the ability level of the student. The most likely exercise parameters are then estimated taking into account such modeled posterior distribution as well. Another advantage we gain by using data mining is a detailed account of the history of the data supporting our estimations. Our approach could be compared to the Marginal Maximum Likelihood (MML) technique, in the sense that we choose a prior distribution on the student parameters in the form of the KT parameters and then compute for the most likely exercise parameters, given the observations. Our estimates, though, potentially have finer granularity, because we marginalize only along the items sharing the same knowledge component rather than along all the items. In addition, the curve fitting using a weighted average based least square distance minimization is better equipped in terms of mitigating the influence of outliers and the local minima problem.
6. FUTURE WORK This paper presents only the firs step in developing this approach we plan to continue working on this project in several directions.
6.1 More Detailed Evaluation The binary classification scheme used for the evaluation of the exercise difficulties leads to a straightforward interpretation of the results when the true difficulties of the exercises are unknown, which was the case for us. However, this evaluation scheme could further be improved by taking into account not only the sign of the decision, but also the magnitude of the gap between the student ability estimate and the exercise difficulty, especially when the prediction is false. This would allow computing a more informative metric for the prediction accuracy. Other metrics for the accuracy of the resulting models could be computed, including area under ROC curve, Kappa statistics and sensitivity index. The manually annotated exercise difficulties are based on a discrete 5-point scale (from very easy to very difficult), otherwise
a human expert would hardly be able to produce any estimation. This by default puts them at disadvantage when compared against the data-mined difficulties calibrated on a continuous scale from 0.0 to 1.0. Even though the conducted evaluation has shown that the no-difficulty model has beaten the model based on manually annotated difficulties (which mean, a continues scale for expertprovided difficulties would not make much of a difference), in order to make a fair comparison, data-mined difficulties need to be discretize to the same scale. Finally, the approach could be compared to the standard IRT calibration techniques discussed in Section 5.
6.2 Further Implementation We plan to implement the proposed approach as a component within the authoring tool of the ActiveMath system. Teachers and systems administrators will be using such a component in order to re-calibrate exercise difficulties once enough evidence data is accumulated within the system logs. Several improvements to the algorithm are required in order for the component to be useful and to be used. The proposed approach allows us to estimate not only difficulty of an exercise, but also its discrimination. The ActiveMath metadata scheme contains a field indicating exercise purpose – whether it is suitable for training, testing or both. The obtained discrimination parameter can be informative here, as testing exercises typically should have a higher discrimination value. A necessary extension is a comprehensive calibration quality measure, which takes into account information on the amount and quality of historical data supporting the re-calibrated difficulty. If the number of events is low, or events did not contribute to a wide ability range (thus, producing a poorly-fitted IRT curve), or the ability values themselves are not reliable (a user did not accumulate enough history for the target concept to reliable predict his mastery for it), such a calibration might be too noisy to accept. On relevant note, if a calibrated value does not differ much from the existing difficulty annotation, the update can be also disregarded. Exercise discrimination can be used to further improve student performance predictions. The better the exercise can distinguish between the students who have mastered the concepts and students who have not, the more informative becomes the correctness of student responses to this exercise and more reliable estimation of their ability drown from these responses. Another extension of our approach to multi step and multi concept exercises could include considering a sigmoid mixture model and evaluating its performance against Markov Chain Monte Carlo (MCMC) based calibration techniques, which have traditionally been used to model complex exercises with multiple concepts.
7. REFERENCES [1]
Corbett, A.T., & Anderson, J.R. (1995). Knowledge Tracing Modeling the Acquisition of Procedural Knowledge. Int. J. of User Modeling and User-Adapted Interaction, 4: 253278.
[2]
Hambleton, R. K., Swaminathan, H., & Rogers, H. J. (1991). Fundamentals of Item Response Theory. Newbury Park, CA: Sage Press.
[3]
MacQueen, J. B. (1967). Some Methods for classification and Analysis of Multivariate Observations. 5th Berkeley Symposium on Mathematical Statistics and Probability. Univ. of California Press.: 281–297.
[4]
Melis, E., et al. (2001). ActiveMath: A Generic and Adaptive Web-Based Learning Environment. Int. J. of AIEd 12(4): 385-407.
[5]
Coleman, T.F. and Li, Y. (1996). An Interior, Trust Region Approach for Nonlinear Minimization Subject to Bounds. SIAM J. on Optimization, 6: 418–445.
[6]
Pavlik, P., Cen, H., & Koedinger, K (2009). Performance Factors Analysis - A New Alternative to Knowledge. AIEd’09: 531-538.
[7]
Cen, H., Koedinger, K., & Junker, B. (2006). Learning factors analysis a general method for cognitive model evaluation and improvement. ITS’2006: 164–175.
[8]
Gong, Y., Beck, J.E., & Heffernan, N.T. (2010). Comparing Knowledge Tracing and Performance Factor Analysis by Using Multiple Model Fitting Procedures. ITS’2010, Part I: 35–44.
[9]
Wingersky, M. S., Barton, M. A., & Lord, F. M. (1982). LOGIST user’s guide. Princeton NJ: Educational Testing Service.
[10] Wingersky, M.S. (1983). LOGIST: A Program for Computing Maximum Likelihood Procedures for Logistic Test Models. In Applications of item response theory. Vancouver, BC, Canada. [11] Mislevy, R. J., & Bock, R. D. (1983). BILOG: Item Analysis and Test Scoring with Binary Logistic Models [Computer program]. Mooresville IN: Scientific Software, Inc. [12] Swaminathan, H., & Gifford, J. A. (1982). Bayesian Estimation in the Rasch Model. J. of Educational and Behavioral Statistics, 7(3): 175-192. [13] Swaminathan, H., & Gifford, J. (1986). Bayesian Estimation in the Three-Parameter Logistic Model. Psychometrika, 51(4): 589-601. [14] Swaminathan, H., & Gifford, J. (1985). Bayesian Estimation in the Two-Parameter Logistic Model. Psychometrika, 50: 349-364. [15] Mislevy, R.J., & Stocking M.L. (1989). A Consumer’s Guide to LOGIST and BILOG. Applied Psychological Measurements, 13(1): 57-75. [16] Lord F.M. (1986). Maximum Likelihood and Bayesian Parameter Estimation in Item Response Theory. J. of Educational Measurement, 23(2): 157-162. [17] Patz, R.J.; Junker, B.W. (1999). A Straightforward Approach to Markov Chain Monte Carlo Methods for Item Response Models. J. of Ed. and Behavioral Statistics, 24( 2): 146-178.