Metabolites 2013, 3, 119-143; doi:10.3390/metabo3010119 OPEN ACCESS
metabolites ISSN 2218-1989 www.mdpi.com/journal/metabolites/ Review
Exometabolomics Approaches in Studying the Application of Lignocellulosic Biomass as Fermentation Feedstock Ying Zha 1,2,* and Peter J. Punt 1,2 1
2
TNO Microbiology & Systems Biology, Utrechtsweg 48, Zeist, 3704 HE, The Netherlands; E-Mail:
[email protected] Netherlands Metabolomics Centre (NMC), Einsteinweg 55, Leiden, 2333 CC, The Netherlands
* Author to whom correspondence should be addressed; E-Mail:
[email protected]; Tel.: +31-0-888 662 327; Fax: +31-0-888 668 701. Received: 12 October 2012; in revised form: 13 December 2012 / Accepted: 28 January 2013 / Published: 11 February 2013
Abstract: Lignocellulosic biomass is the future feedstock for the production of biofuel and bio-based chemicals. The pretreatment-hydrolysis product of biomass, so-called hydrolysate, contains not only fermentable sugars, but also compounds that inhibit its fermentability by microbes. To reduce the toxicity of hydrolysates as fermentation media, knowledge of the identity of inhibitors and their dynamics in hydrolysates need to be obtained. In the past decade, various studies have applied targeted metabolomics approaches to examine the composition of biomass hydrolysates. In these studies, analytical methods like HPLC, RP-HPLC, CE, GC-MS and LC-MS/MS were used to detect and quantify small carboxylic acids, furans and phenols. Through applying targeted metabolomics approaches, inhibitors were identified in hydrolysates and their dynamics in fermentation processes were monitored. However, to reveal the overall composition of different hydrolysates and to investigate its influence on hydrolysate fermentation performance, a non-targeted metabolomics study needs to be conducted. In this review, a non-targeted and generic metabolomics approach is introduced to explore inhibitor identification in biomass hydrolysates, and other similar metabolomics questions. Keywords: exometabolomics approaches; lignocellulosic biomass hydrolysates; inhibitor identification; experimental design; fermentation phenotypes
Metabolites 2013, 3
120
1. Introduction In the last decade, more and more attention has been paid to using lignocellulosic biomass as feedstock for bulk chemical production with biotechnology processes [1,2]. This biomass, including for example wheat straw, corn stover and bagasse, consists mainly of agricultural residues, which is renewable and not competitive with world food supply [3,4]. If microorganisms could use such biomass efficiently as fermentation feedstock, production processes would be less expensive and more environmentally friendly. Lignocellulosic biomass is mainly composed of cellulose, hemicellulose and lignin (Figure 1). Cellulose is a polysaccharide consisting of D-glucose, and it forms the backbone structure of lignocellulose; hemicellulose is composed of a matrix of different polysaccharides, such as xylan, arabinoxylan and xyloglucan; in addition, lignin is a complex aromatic polymer, functioning as the supportive structure of lignocellulose [5,6]. Due to the rigid structure of lignocellulosic biomass, very few microorganisms can use the biomass directly for growth and production. Therefore, prior to feeding the biomass into fermentors, a pretreatment-hydrolysis step is carried out to break down the structure of lignocellulosic biomass and hydrolyze the exposed polysaccharides into monomers [7,8]. The conditions under which feedstock is pretreated are quite harsh, involving high temperature, high pressure and an acidic/alkaline environment [9-11]. Pretreatment not only results in the disruption of the lignocellulose structure but also in the formation and release of compounds, which could negatively influence the fermentation processes. Therefore, when biomass hydrolysates (hydrolysis products of lignocellulosic biomass) are used as fermentation media, their fermentability by microbes is reduced compared to synthetic media with pure sugar monomers as carbon source (Figure 1) [12,13]. To identify and ultimately reduce the effects of inhibitory compounds on the fermentation processes, insight into biomass hydrolysate composition and its relationship with fermentation performance is required. One way to obtain this insight is through a so-called metabolomics approach. That is, by studying the relationship between (the change of) metabolite levels and performance of the biological system [14,15]. Metabolomics is a functional genomics approach aimed at studying the diversity of biological systems by analyzing intra- and extra-cellular metabolites. Compared to genomics, transcriptomics and proteomics, metabolomics reflects most directly the physiological status of a biological system, as metabolites links most closely to the phenotype of an organism [15,16]. In the last two decades, a diverse range of techniques that can detect and quantify metabolites with various properties have been developed. Metabolomics has been applied in the areas of pharmacy, food and nutrition, plant research and biotechnology [17,18]. Metabolomics studies include detecting metabolite level change caused by genetic modification and/or altered environmental conditions [19,20], finding bio-makers that improve the performance of a biological system [21], and sample classification [22]. Metabolites are small organic compounds participating as intermediates or products in metabolic pathways. Metabolites that are secreted into fermentation media are defined as exo-metabolites together constituting the so-called exo-metabolome. As the chemical properties of different metabolites are diverse, usually several different analytical techniques are required to conduct a metabolomics study [16,23,24].
Metabolites 2013, 3
121
Figure 1. Schematic workflow for the preparation of lignocellulosic biomass hydrolysates and their use in microbial fermentation. Details of the approach are described in the text (paragraphs 1 and 2).
Metabolites 2013, 3
122
Different metabolomics approaches may be adopted, such as metabolite target analysis, metabolite profiling, metabolomics and metabolic fingerprinting [14]. With metabolite target analysis and metabolite profiling, a selection of metabolites is made based on previous research and expert knowledge, and for the most part a single analytical technique is chosen for measuring this group of compounds. These approaches allow a simple sample analysis process and avoid dealing with complex data-sets. However, though widely applied, these approaches are often biased, neglecting the metabolites that are not in the selection. This can artificially amplify effects of selected compounds on the performance of the biological system, losing information like synergetic effect with compounds not selected for analysis [25]. When it is not known which metabolites are of importance in the research question, a non-targeted metabolomics approach becomes essential, since the approach does not involve compound pre-selection. Metabolomics approaches, mostly targeted, have been used to study the composition of lignocellulosic biomass hydrolysates, in relation to their performance as fermentation media. The “exo-metabolites” in such metabolic footprinting studies are components of biomass hydrolysates [26]. These exometabolomics studies help to identify compounds that inhibit the growth of fermenting microbes, reveal the dynamics of some inhibitory compounds in detoxification and fermentation processes, and provide evidence to optimize pretreatment conditions. To further investigate the overall composition of different types of biomass hydrolysates, and study potential inhibitors in these hydrolysates unbiased, a non-targeted exometabolomics approach should also be adopted. In this review, we present several targeted exometabolomics approaches with which the composition of lignocellulosic biomass hydrolysates was studied. The analytical methods used for analyzing the non-sugar compounds in biomass hydrolysates are summarized. The use of targeted approaches in improving pretreatment conditions and fermentation performance of hydrolysates is illustrated. Furthermore, a non-targeted and generic exometabolomics approach is introduced. The approach is applied to identify inhibitors in different types of biomass hydrolysates unbiased and to study their dynamics in fermentation processes. 2. General Approach of Metabolomics Studies In general, the goal of a metabolomics study is to address biological questions by measuring relevant metabolites in a biological system. The measured metabolites are used to reveal their relationship with the performance of the biological system through statistical means. A flowchart illustrating the general metabolomics approach is shown in Figure 2A. The first step is to define a research question that clearly describes the aim of the study. The question should be informative and specific, pointing out both the analytical targets and the biological system of the study [27]. When the research question is clear and specific, it can be translated into a statistical question, based on which experimental design is carried out and tentative statistical methods are chosen.
Metabolites 2013, 3
123
Figure 2. (A) Overview of a general metabolomics workflow, (B) Non-targeted metabolomics workflow used for studying the use of lignocellulosic biomass hydrolysate as fermentation medium in particular by identifying inhibitory compounds. Details of the approach are described in the text (paragraphs 2 and 4).
Based on the defined research question, an estimation of the amount of metabolites to be measured can be made. The number of metabolites to be measured relates not only to the property of the biological system, but also to the coverage of the analytical methods used. For instance, when both GC-MS and LC-MS were used to analyze the metabolome of Escherichia coli, the detection of between 250 and 500 metabolites was estimated [16]. Based on the number of metabolites to be analyzed, the number of different experiments can also be determined. The larger the number of metabolites, the more experiments should be carried out to acquire a reliable answer to the research question [28–30].
Metabolites 2013, 3
124
Knowing the required number of different experiments to be conducted, experimental design can be performed. The requirements of the designed experiments are that they (1) closely relate to the research question, (2) reflect real-life situations, and (3) result in a range of well-spread measurable phenotypes [31,32]. To ensure the success of the experimental design, information about the operability and repeatability of the experiments needs to be obtained beforehand. Preferably, more experiments than desired are initially conducted, so that, when certain experiments do not meet the requirements mentioned above, they can be discarded from the design. Another key point in experimental design is defining the phenotype(s) to characterize the performance of the different experiments. Depending on the selected phenotype, experimental set-up and sampling strategies will be determined. Phenotypes are parameters defined to describe the research question in a quantitative manner. There is no universal phenotype definition, since the focus of each study is different, and often more than one phenotype is needed to fully represent the research question. The importance of defining proper phenotypes and its influence in answering the research question are illustrated by Braaksma et al. [19]. In her study on enzyme production by the filamentous fungus Aspergillus niger, six different phenotypes were defined to be able to fully address the research question. In addition, different metabolite target groups were found to be correlating to different phenotypes. Therefore, defining a series of phenotypes that address different aspects of the research question is strongly recommended. As soon as phenotypes are defined, experimental process and sampling can be set up to obtain parameters needed to calculate the phenotypes. For practical reasons, it is preferred to set up as simple an experimental process and sampling method as possible, given that all necessary parameters can be acquired. One should bear in mind that the sampling method is also determined by the biological system and the sample analysis techniques of the study. The sample work-up of extracellular metabolomics (exometabolomics) is much simpler than intracellular metabolomics, which needs sample quenching, metabolites extraction and biomass correction [25,26]. When GC-MS is used to analyze samples, extra sample preparation steps, like derivatization, are often required, which is generally not required for LC-MS and NMR analysis [23]. In targeted metabolomics, analytical methods are chosen based on the properties of the pre-selected compounds. In non-targeted metabolomics, analytical techniques also need to be chosen, as it is not possible to use all available methods for sample analysis. Besides, it is more informative to focus on metabolite classes that are relevant to the aim of the study. Therefore, analytical methods in non-targeted metabolomics should still be selected based on the research question and known properties of the biological system. For instance, when it is known that volatile compounds may be important to the research question, methods allowing the analysis of these compounds, such as solidphase microextraction (SPME), should be used [33,34]; and as the focus of the study is on carbohydrates, methods like high-performance anion-exchange chromatography with pulsed amperometric detection (HPAEC-PAD) or LC-MS should be selected [35,36]. In non-targeted metabolomics, sample analysis results in a list of detected compounds, both known and unknown, and their relative quantities, presented as peak areas in chromatograms. The analysis results of all samples in the experimental design form a data-set, which will be studied statistically. Before the data-set is analyzed statistically, it needs to be preprocessed. Generally, data preprocessing involves the following aspects, (1) peak area correction with internal standards, (2) data-set
Metabolites 2013, 3
125
normalization, and (3) data-set transformation. Peak area correction is conducted to minimize the influence of sample matrix, an effect caused by the overall composition of the sample; normalization is carried out to reduce the redundancy of the data-set; and transformation is performed to increase the useful information content the data-set carries. There are multiple ways to preprocess a data-set, and the methods chosen are specific to the analytical technique used and the statistical model selected. Detailed discussions on data preprocessing are given by Roessner et al. [37] and van den Berg et al. [38]. To find the relationship between the preprocessed data-set and the defined phenotypes in non-targeted metabolomics study, multivariate data analysis (MVDA) tools are applied. The most commonly used tools are principal component analysis (PCA), partial least square (PLS), and discrimination/classification methods. PCA model points out variables (metabolites) that contribute the most to the data-set structure [39]; PLS model seeks metabolites that are most responsible for a certain phenotype [40]; discrimination/classification methods determine if a sample belongs to a specific group [28]. Based on the research question, one or several of the MVDA tools are selected to analyze the preprocessed data-set. Two other factors to be considered when conducting MVDA are 1) fusing of the data-sets generated by different analytical methods and its influence on the model building results, and 2) methods for model validation. Simply using MVDA tools for analyzing metabolomics data-sets without checking the validity of the models can produce misleading or even wrong results. Rubingh et al. addressed the complexity of the real-life metabolomics data. Several model validation methods were provided to attain more reliable and comprehensive data analysis results [29]. Compared to non-targeted metabolomics, the compound list in a targeted approach is very short. Since the compounds are pre-selected, their absolute concentrations can be determined with reference compounds. This simplifies or even omits data preprocessing, and makes data analysis straightforward and simple. The last step in a metabolomics study is to translate the statistical analysis results into the biological context to answer the research question. Some analytical results speak for themselves, like the ones in discrimination/classification studies [41], while others are complex, especially those involving metabolites identification [42]. There are several tools that assist the biological interpretation, which are illustrated by van der Werf et al. [25]. Additionally, it should be noted that non-targeted metabolomics analysis might suggest compounds that seem to be ‘incorrect’ based on expert knowledge. They are either not previously found in any similar biological systems, or known to function in an unrelated biological process. Such compounds should also be taken into account for future research, since they may play a role in further understanding the biological system studied. 3. Targeted approach: Applying targeted Metabolomics Approaches to Study the Sugar and Lignin Degradation Products in Lignocellulosic Biomass Hydrolysates Most of the targeted approaches start with analyzing the structure of lignocellulosic biomass, which reveals several main degradation products in biomass hydrolysates, the pretreatment-hydrolysis product of lignocellulose. As shown in Figure 1, cellulose, hemicellulose and lignin are the three main components of lignocellulosic biomass. Cellulose is the linear polymer of β-1,4-linked D-glucose residues, hemicellulose is a heteropolymer mainly containing xylan, arabinoxylan and xyloglucan, when hydrolyzed generating xylose, mannose, galactose, arabinose and glucose [43]. Lignin is a
Metabolites 2013, 3
126
complex macromolecule composed of phenylpropane units, which are the dehydrogenation products of para-coumaryl alcohol, coniferyl alcohol, and sinapyl alcohol [13]. The degradation products of the sugar monomers of cellulose and hemicellulose, and lignin are generally categorized into small carboxylic acids, furans and phenolic (aromatic) compounds [12,44]. Formic, acetic and levulinic acid are the most common small carboxylic acids, while furfural and 5-hydroxy-methylfurfural (HMF) are the representatives of furans [45]. Comparatively, the diversity of phenolic (aromatic) compounds in biomass hydrolysates is much greater [46–49]. In this section, the analytical methods used to detect and quantify these three categories of compounds are presented. Furthermore, application of targeted metabolomics approaches on identifying inhibitors in biomass hydrolysates and improving hydrolysate preparation methods is reviewed. 3.1. Analytical Methods for Studying Hydrolysate Composition As many of the targeted studies referred to in this review are focused on specific classes of compounds, analytical methods used to detect and quantify these are discussed separately. However, general aspects of these analytical tools are often not specific for the compound classes. 3.1.1. Small Carboxylic Acids and Furans Several methods have been extensively used to detect and quantify small carboxylic acids and furans in biomass hydrolysates, among which are High-Performance Liquid Chromatography (HPLC), and Capillary Electrophoresis (CE) (Table 1). Table 1. Analytical methods used for detecting compounds in lignocellulosic biomass hydrolysates. Analytical extraction / method derivatization
HPLC
no
Detected compounds formic, acetic acid, levulinic acid, lactic acid, glycolic acid, malic acid, citric acid, succinic acid, oxalic acid
Identification quantification
no
yes
furfural, HMF furfuryl alcohol, 2,5-bis-hydroxymethylfuran
[49– 51,55,58– 62] [49,55,58,6 0,61,63,64]
precipitationfiltration, MTBE / no
formic acid, lactic acid, acetic acid, levulinic acid, furfural, HMF, phenolic compounds
partial
MTBE / no
gallic acid, furfural, HMF, protocatechuic acid, vanillin, coniferyl alcohol, syringaldehyde, sinapic acid
partial /GCMS
no
reference phenolic compounds
GC-MS
RP-HPLC
reference
[52]
yes [51]
[50]
Metabolites 2013, 3
127 Table 1. Cont.
Analytical extraction / method derivatization
CE
GC-MS
Detected compounds
Identification quantification
no
formic acid, acetic acid, levulinic acid, glycolic acid, lactic acid, furfural, HMF
no
yes
[53,63,65]
solvent / no
acetic acid, furfural, acetamide
no
yes
[66]
MTBE / silylation
gallic acid, HMF, vanillin, protocatechuic acid, syringaldehyde
no
[51]
DCM / ECderivatization
levulinic acid, furfural, furfurylalcohol, 2-furanmethanol acetate, HMF, phenolic compounds
SPE / silylation
phenolic compounds
EA / silylation
[67] yes/ partial
yes
furfural, HMF, furfuryl alcohol, 2furoic acid, phenolic compounds phenolic compounds
no / silylation
lignin derived monomer and dimers
precipitationfiltration, MTBE / no
aliphatic acids, furans, phenolic compounds
[60,61] [55]
no
phenolic compounds
LCMS/MS
reference
yes
yes
yes
[49] [57,59] [65]
[54,68]
MTBE: methyl tertiary butyl ether; DCM: dichloromethane; SPE: solid phase extraction; EC: ethylchloroformate; EA: ethylacetate.
HPLC is the most standard method for quantifying monomer sugars, simple small carboxylic acids, furfural and HMF, though the analytical system and column used may vary (Table 1). The method requires little sample work-up and detects a limited range of target compounds, which are quantified by making calibration curves using external standards. RP-HPLC is a variation of HPLC that detects a much larger group of compounds with identification possibility only when followed up by GC-MS [50,51]. RP-HPLC assigns identity to detected compounds mainly by comparing their retention time to and/or spiking samples with reference compounds. In the identification process, no compound structural analysis is involved and the availability of reference compounds is a necessity. Therefore, the identification conducted by RP-HPLC requires prior knowledge [52]. It can also be seen from Table 1 that an extraction step using methyl tertiary butyl ether (MTBE) is often used before analyzing hydrolysate samples with RP-HPLC in combination with detection based on refractive index (RI). This is because hydrolysate samples normally contain high concentrations of sugars, like glucose. These huge sugar peaks appear in RP-HPLC chromatograms interfere with the RI detection of target compounds, like furans. Therefore, to minimize the disturbance, sugars are removed by extracting hydrolysates with organic solvent before conducting analysis. This applies also to GC-MS method, which requires an extraction step before the derivatization step in sample preparation
Metabolites 2013, 3
128
(Table 1). Besides small carboxylic acids and furans, phenolic (aromatic) compounds can also be studied by RP-HPLC. This will be discussed in the next section. CE is yet another method for analyzing the described compounds in hydrolysates. Compared to RP-HPLC, the targets of CE are more specific, mainly small organic acids. Like in HPLC, little sample work-up is needed for CE, and the method cannot be used for identification of novel compounds. When analyzing hydrolysate samples, it is preferred to measure both carboxylic acids and furans with one analytical method. Since HPLC is capable of detecting both acids and furans, the method is often chosen above CE. Recently, it was shown that CE can also separate saccharides and furans in hydrolysate samples, and the quantification results of CE on furfural and HMF are highly comparable to HPLC [53]. Therefore, CE has the potential to become a routine analytical method for measuring hydrolysate samples. 3.1.2. Phenolic (aromatic) Compounds As addressed before, phenolic (aromatic) compounds are mostly the degradation products of lignin, and due to the complexity of lignin structure, the chemical structure of this group of compounds in biomass hydrolysates is very diverse. The potential phenolic compounds in hydrolysates derived from the three basic lignin building blocks, namely para-hydroxyphenyl (H), guaiacyl (G), and syringyl (S) residues, are summarized by Klinke et al. [13] (Table 2). It was estimated that about 60 different phenolic compounds could be found in various hydrolysates, including compounds with unknown structures. Table 2. Phenolic (aromatic) compounds detected in the studies listed in Table 1. p-hydroxyphenyl residue (H)
polymer
Detected in more than one study* phenol 4-hydroxybenzaldehyde 4-hydroxybenzoic acid salicylic acid (2-hydroxybenzoic acid) 3,4-dihydroxybenzaldehyde benzoic acid catechol
OR
(1,2-dihydroxybenzene) p-coumaric acid
Detected in one study
hydrolysate
ref
hydroquinone
spruce-dilute acid
[60]
wheat strawsteam explosion
[55]
willow-acid steam
[57]
corn stoverdilute acid or ammonia fiber expansion
[54]
4-methoxyphenol p-coumaryl alcohol Phloretic acid (3-(4-hydroxyphenyl)propionic acid) o-cresol (2-methylphenol) gentisic acid
(4-hydroxycinnamic acid) piceol
(2,5-dihydroxybenzoic acid) protocatechuic acid (3,4-dihydroxybenzoic acid)
(4-hydroxyacetophenone)
caffeic acid (3,4-dihydroxy cinnamic acid)
Metabolites 2013, 3
129 Table 2. Cont.
p-hydroxyphenyl residue (H)
Detected in more than one study*
Detected in one study
hydrolysate
ref
G-CHOHCOCH3 G-COCOCH3 G-CH2COCH2OH G-COCHOHCH3
spruce-dilute acid
[60]
methoxycinnamic acid) 3-hydroxy-4-methoxycinnamic vanillyl alcohol acid G-CH2CH2COOH coniferyl aldehyde G-CHCHCHO dihydroconiferyl alcohol acetovanillone
wheat strawsteam explosion
[55]
(acetoguaiacone) G-CH2COCH3
trans-isoeugenol
willow-acid steam
[57]
acetosyringone
wheat strawalkaline wet oxidation
[61]
syringol S-CHCHCHO
wheat strawsteam explosion
[55]
biphenyl-type dimer diarylpropane-type dimer pinoresinol-type dimer
Japanese beechhot compressed water corn stoverdilute acid or ammonia fiber expansion
Guaiacyl residue (G)
polymer
guaiacol vanillin vanillic acid homovanillic acid ferulic acid (4-hydroxy-3-
OR
Syringyl residue (S)
polymer syringaldehyde syringic acid
OR
Other structures
4-hydroxycoumarin o-toluic acid p-toluic acid
[65]
[54]
* The compounds listed in this column appeared in two or more studies listed in the “ref” column and the following three references: [49] [52] [67]. The hydrolysates used in these three studies were corn stover-dilute acid, yellow poplar organosolv, and bagasse and oak hydrolysates.
To detect, identify and quantify these phenolic compounds in hydrolysates, several different methods have been applied, including RP-HPLC, Gas Chromatography–Mass Spectrometry (GC-MS) and Liquid Chromatography–Mass Spectrometry2 (LC-MS/MS), see Table 1. A common characteristic of the three techniques is that they all possess the possibility of (partial) identification, which is essential for studying a diverse group of lignin degradation products with many ‘unknowns’. Compound identification with RP-HPLC and LC-MS/MS is mainly done by first constructing chromatograms with a relative large group of reference compounds. The generated chromatograms are then compared with the peaks in the sample chromatogram [52,54]. By comparing the retention time in LC and/or extract mass information provided by MS, identities can be assigned to peaks in hydrolysate
Metabolites 2013, 3
130
samples. Since for each identified compound, its reference is already available, quantification can be directly carried out by generating calibration curves. In contrast to LC methods, GC-MS appears to be more open, as reference compounds are only involved in a later stage of the analysis. The initial identification with GC-MS is often conducted by comparing compound fragment profiles with a mass spectral library [48,55,56]. In some cases, reference compounds are used to confirm the identity of characterized peaks [48]. Even when identity is not assigned, an indication of the category the compound belongs to can be given [57]. Therefore, GC-MS seems to be a preferred method for studying phenolic (aromatic) compounds in biomass hydrolysates. The method has been adopted in multiple studies, resulting in the identification and quantification of a variety of phenolic (aromatic) compounds, see Table 2. It can be seen that most identified phenolic compounds fell into the categories of the three lignin building blocks, primarily aldehyde and acid forms. More derivatives of para-hydroxyphenyl residues (H) were found than guaiacyl derivatives (G) than syringyl derivatives (S) (Table 2). Phenolics dimers and non-phenolic aromatic compound, namely toluic acid, were also detected. These analysis results confirmed that there is a diverse group of phenolic compounds in biomass hydrolysate, indicated that the phenolic compound composition in different hydrolysates vary. 3.2. Application of Targeted Approaches in Studying Biomass Hydrolysates The detection and quantification of the degradation products of sugars and lignin in lignocellulosic biomass hydrolysates not only revealed the presence and level of such compounds, but also provided information to (1) test the toxicity of these compounds towards microbes, (2) study the formation conditions of these compounds, (3) trace their dynamics in a detoxification treatment or during a fermentation process. The applications of targeted metabolomics approaches on studying these aspects of biomass hydrolysates are discussed below. 3.2.1. Inhibitor Identification Biomass hydrolysates generated from different pretreatment methods exhibit inhibitory effects when used as fermentation media. Some elongate lag-phase, some reduce growth rate, some lower product yield, while others abolish growth completely [12,44]. The inhibitory effects are the results of compounds present in hydrolysates, which are formed or released during the pretreatment process. These inhibitory compounds are mostly sugar and lignin degradation products, which can be different in each hydrolysate. To improve the fermentability of biomass hydrolysates, identifying these compounds is crucial. The identification has been carried out by using targeted metabolomics approach. Most studies start with selecting a group of compounds that are potentially inhibitory in biomass hydrolysates. The selection was made based on expert knowledge as well as previous research results. For instance, in the study of Chen et al. [52], aliphatic acids, phenols, aromatic acids and aromatic aldehydes were selected as they were reported as major degradation products in biomass hydrolysates [13]. According to the chemical properties of the selected compounds, analytical methods were established to measure and, in some cases, quantify these compounds. Both RP-HPLC and GC-MS have been used in such studies, and pure reference compounds were used for both identification and quantification purposes [50,52,59]. In some studies, the presence of the selected
Metabolites 2013, 3
131
compounds in the actual hydrolysate was checked [52,58], while in other studies, their inhibitory effects towards one or several microbes were tested by spiking with various concentrations [50,69]. In some other studies, the pre-selection of potential inhibitors was not conducted, hydrolysates were typically analyzed with GC-MS, and the mass spectra of the resulting peaks were used for compound characterization [49]. The characterization was either done by comparing the mass spectra of the detected peaks to a mass spectral library [48,55,56], or comparing them to a series of reference compounds [51,59]. When a mass spectral library is used, a large group of compounds can be characterized [55]. However, instead of exploring the inhibitory effect of each detected compound, the authors decided to focus on vanillin and furfural based on previous research results. This makes such a study targeted from this point on. Compared to approaches using reference compounds, the benefit of directly analyzing hydrolysates with GC-MS is that as soon as the compound is characterized, its presence in the hydrolysate is also confirmed. The concentration of the characterized compound can be determined with its reference compound, and its toxicity can be tested according to its concentration present in the hydrolysate [51,67]. 3.2.2. Pretreatment Condition Optimization It is known that the inhibitory compounds in biomass hydrolysates are mainly formed during pretreatment process, which is in most cases operated under harsh conditions (Figure 1) [9–11]. The fermentability of a specific hydrolysate is, to a great extent, determined by its pretreatment [11]. Thus, studying the relationship between biomass pretreatment and its resulting hydrolysate composition provides valuable information for selecting appropriate pretreatment conditions. A targeted metabolomics approach has been used to study the influence of pretreatment conditions on fermentable sugars and inhibitors formation of a specific pretreatment method [62,63]. The approach started with designing experiments by varying specific pretreatment conditions, such as temperature and residence time, both individually and together. All different pretreatment conditions were quantitatively represented by a series of combined severity factors (CS), and under each CS, a pretreatment experiment was carried out. Samples were taken from the resulting hydrolysates of different CS for analysis. The fermentable sugars and inhibitors to be analyzed were pre-selected based on expert knowledge, which in turn determined the analytical methods. As the inhibitors selected in these studies were small carboxylic acids, furfural and HMF, HPLC and CE were used to quantify these compounds in the hydrolysate samples (Table 1). Based on the analysis results, the authors evaluated the influence of CS on the formation of fermentable sugars, as well as on the release of the selected inhibitors, which provided criteria for choosing the optimal pretreatment conditions. A similar approach has been applied by Klinke et al. to not only determine the optimal pretreatment conditions, but also study the correlation between pretreatment conditions and the degradation products [61]. In such a study, a much larger range of potential inhibitory compounds were selected, which included not only carboxylic acids and furans, but also phenolic compounds. Hydrolysates, prepared at different pretreatment conditions, were analyzed with GC-MS for their phenolic contents. The identification of the phenols was conducted by comparing their MS spectra with a mass spectral library, and standards were used to verify the identity and quantify these compounds in hydrolysates. The correlation between pretreatment conditions and the detected degradation products was studied
Metabolites 2013, 3
132
statistically, using principal component analysis (PCA), revealing the influence of each single pretreatment condition on the formation of degradation products. 3.2.3. Monitoring Compound Dynamics during Detoxification and Fermentation To reduce the toxicity of biomass hydrolysates as fermentation media, detoxification methods have been developed to remove inhibitors in hydrolysates [44,70]. The effects of detoxification were improved fermentability and increased product yield [71–73]. To study beyond the effect of hydrolysate detoxification, the composition change in terms of (potential) inhibitory compounds in hydrolysates needs to be monitored during the detoxification. Such studies were conducted using targeted metabolomics approaches. The most straightforward way of studying a detoxification process was by using the already identified inhibitors as monitoring targets. These inhibitors mainly include small carboxylic acids, furfural and HMF. Typically, the concentration of these compounds was determined before and after the detoxification process, using HPLC [72,74,75]. The targets of each detoxification method can be different, as far as monitored compounds were considered. For instance, it was discovered that the chemical detoxification by overliming was specifically effective to furans [74,76]. In the study of Martinez et al. [76], besides the selected inhibitors, the authors also looked at the unknown peaks in the HPLC chromatogram. Among those unknown peaks, three decreased after overliming, indicating that more compounds could be involved in resulting the detoxification effect of this specific method. When the detoxification targets are neither small carboxylic acids nor furans, a different targeted metabolomics approach than the one discussed above should be applied. In the case of enzymatic detoxification using laccase, phenols were assumed to be the detoxification targets, as laccase is a phenol oxidase. This assumption was verified by Larsson et al. [60] through quantifying small carboxylic acids, furans and total phenols in spruce hydrolysate. To study the detoxification effect of laccase on individual phenolic compounds, both HPLC and GC-MS were adopted [56,57,77]. When HPLC was used, a pre-selection of phenolic compounds was made based on the reported toxicity of these compounds, and their detectability by HPLC [77]. When hydrolysates were analyzed with GC-MS, the compound pre-selection was not done. The phenols detected by GC-MS were characterized either by comparing to a mass spectral library [56] or using reference compounds [57]. The advantage of using GC-MS is that the relative quantity of some unidentified compounds can also be determined to check if they were (partially) removed from the hydrolysate after detoxification. Similar to detoxification, it was observed that during a fermentation process, the hydrolysate toxicity reduces. This is because the fermenting microbe can transform inhibitors to their less toxic form [45,78]. Targeted metabolomics approach also contributed to study the chemical conversion of these compounds. In such studies, the identified inhibitors were taken out of the context of hydrolysates and added into synthetic medium for growth testing. The conversions of these compounds were predicted based on expert knowledge, and analytical methods were selected accordingly. The conversion of furfural and HMF were monitored by analyzing their alcohol forms during fermentation processes with HPLC [64,79,80]. In addition, the conversions of vanillin and coniferyl aldehyde were investigated with RP-HPLC and GC-MS [50]. To examine these conversions in hydrolysates, GC and GC-MS were used to monitor different forms of furan and phenolic
Metabolites 2013, 3
133
compounds, namely aldehydes, alcohols, ketones, and acids [67,81]. Similar trends of conversion from aldehyde to alcohol and acid form were observed in hydrolysates, though their quantitative relationships were not as straightforward as those in synthetic medium. These results suggested that aldehydes are more likely to be the inhibitory forms of furans and phenols in biomass hydrolysates. By monitoring the dynamics of above mentioned compounds during detoxification and the fermentation process, it was shown that all three groups of proposed inhibitors could negatively influence hydrolysate fermentability. Especially for phenolic compounds, their toxicity was confirmed both in the laccase study and by their conversions during fermentation processes. Phenolic compounds have much greater diversity in hydrolysates compared to small carboxylic acids and furans. The overall composition of phenolic compounds was hardly studied in relation to their toxicity in biomass hydrolysates. It seems that besides the identified phenols, more of this kind of compounds are present in hydrolysates exhibiting inhibitory effects [57,59,63]. To investigate these unknown inhibitors, a non-targeted metabolomics approach needs to be carried out. 4. Non-Targeted Approach. Research Case: Applying Non-Targeted Metabolomics Approach to Study Inhibitors and Their Dynamics in Lignocellulosic Biomass Hydrolysates as Fermentation Media As discussed in the sections above, in this area of research true non-targeted metabolomics approaches have not yet been completed. Therefore, we here describe an example case of such study based on our own research, illustrating corresponding and differentiating aspects of such as study compared to targeted approaches. As discussed in the previous section, when used as fermentation media, hydrolysates show toxicity towards fermenting microbes, due to the degradation products of (hemi-) cellulose and lignin. The toxicity varies with different types of hydrolysates, and is mainly determined by the pretreatmenthydrolysis method used, but is also influenced by the biomass type [11,78]. Targeted metabolomics has been used to study the toxicity of biomass hydrolysates in fermentation processes by analyzing the composition of (hemi-) cellulose and lignin degradation products. However, it is believed that besides the identified inhibitors, there are still other non-sugar compounds and their derivatives present in biomass hydrolysates that may show toxicity or influence the toxicity of other compounds by synergistic or antagonistic effects. This is because the identified inhibitors alone do not fully explain the toxicity of biomass hydrolysates [57,59,63]. To explore the identity of these unknown compounds, the composition of biomass hydrolysates needs to be studied in a non-targeted manner, alongside the dynamics of these compounds and their effects during fermentation processes. The metabolomics approach introduced in section 2 is adopted to carry out such a study (Figure 2B). In the following sections, the steps of this study are described in more detail. 4.1. Define Research Question The aim of the study was to identify compounds that (negatively) influence the hydrolysate fermentability through analyzing the composition of different hydrolysates. The corresponding research question was to identify inhibitors in biomass hydrolysates relevant for ethanolic fermentation of S. cerevisiae. This question can be differentiated into an experimental and a statistical research
Metabolites 2013, 3
134
question. The experimental question was to determine which non-sugar compounds in hydrolysates are responsible for the hydrolysate toxicity towards microbes in a fermentation process. The statistical question was to determine which of the variables contribute the most to the fermentation performance phenotype(s) (Figure 2B). The variables are the detectable non-sugar compounds in hydrolysates, while the phenotypes were defined to quantitatively describe the fermentation processes. 4.2. Experimental Design In the next step, experiments were designed to answer the research question. The statistical question was first considered before any wet-lab experiments were designed. The three aspects of the statistical question were (1) selecting statistical model(s), (2) estimating the number of detectable metabolites, and (3) determining how many experiments to be carried out. In our particular case, partial least square (PLS) model was selected, as it provides, as described in section 2, those variables that most closely relate to the phenotypes. To estimate the number of detectable non-sugar compounds present in hydrolysates, the results of previous hydrolysate composition studies were used. As summarized in Tables 1 and 2, there were in total about 10 small carboxylic acids, 5 furans and 60 phenolic compounds identified. We assumed that a similar number of inhibitory compounds in hydrolysates were not yet detected, giving 150 compounds in total. This number was used to determine the number of experiments to be carried out in the experimental design. The non-sugar compounds in biomass hydrolysates are mainly (hemi-) cellulose and lignin degradation products. The formation of these compounds are interrelated, for instance, formic acid is partially formed from HMF, and furfuryl alcohol is the conversion product of furfural [45,79]. As lignocellulosic biomass is consisted of a relatively small number of building-blocks (Figure 1), it was assumed that the above-mentioned 150 detectable compounds present in hydrolysates, represent only 15–20 groups of compounds formed completely independently. For regression models like PLS, the number of experiments is preferred to be larger than the independent variables in the system. Therefore, approximately 20 experiments were to be carried out. Knowing that about 20 different experiments were to be conducted, the wet-lab experiments were designed by resolving the following four aspects: (1) generating different experiments, (2) checking the diversity and reproducibility of these experiments, (3) setting up experimental and sampling procedures, and 4) defining phenotypes. Different experiments were acquired by conducting batch fermentation with different biomass hydrolysates. These hydrolysates were prepared with various biomass types and different pretreatmenthydrolysis methods [82–84]. To obtain about 20 experiments, six biomass types and four pretreatmenthydrolysis methods were selected. The six biomass types were wheat straw, barley straw, corn stover, bagasse, willow wood and oak wood. They represented the most widely used biomass in the category of agriculture residue, sugar industry by-product, and wood [51,62,82,85–87]. Straw is the main agriculture residue in Europe, while corn stover is mostly produced in North and South America. Of the four pretreatment-hydrolysis methods, three used enzymatic hydrolysis, and their pretreatment methods included acid, alkali and oxidative treatment. The fourth method used high concentration of sulfuric acid for both pretreatment and hydrolysis [11].
Metabolites 2013, 3
135
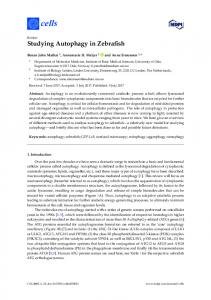
The hydrolysates were first prepared in small volume, i.e., 50 mL, to check their diversity in fermentability by conducting a screen experiment on microtiter plates. This screen experiment confirmed that, as far as growth rate was considered, there was significant diversity among these hydrolysates [11]. Moreover, two hydrolysates were used to examine the reproducibility of batch fermentation. As shown in Figure 3, of both hydrolysates, the fermentation process was clearly presented by both duplicates. Through these pre-experiments, a good basis was formed for the full-scale experiment. The full-scale experiment was carried out by fermenting all these hydrolysates individually. These fermentations had a fixed set-up and the same inoculum, so that the difference in fermentation performance was only caused by different hydrolysates [67]. For each fermentation, samples were taken during the whole fermentation process. With these samples biomass formation, glucose and ethanol concentration were measured. These measurements were used to visualize the fermentation process and calculate phenotypes. Phenotypes are the quantitative description of a fermentation process. In this study, four phenotypes were defined, which were lag-phase, glucose consumption rate, ethanol production rate and ethanol yield (Figure 2B). Lag-phase was a phenotype expressed in hours, which was used to describe the time window before growth starts. Glucose consumption rate and ethanol production rate expressed how quick the microbe grows and how fast the product is produced. Ethanol yield indicated the production efficiency. Each of these phenotypes tackled a different aspect of the fermentation, and together described the whole fermentation process. It should be noted that more phenotypes could be defined, such as growth rate and productivity. However, since the fermentation aspects these phenotypes describe directly relate to one of the four phenotypes defined above, there was little value to include them. 4.3. Sample Selection and Analysis To analyze the hydrolysate composition during a fermentation process, samples representing the fermentation process were selected. The fermentation process was divided into three different phases based on the phenotypes, namely lag phase, growth phase and stationary phase, see Figure 3. Based on these phases, samples were selected for analysis: three at the beginning of each phase, one at the mid-point of growth phase, and one at the end of stationary phase (Figure 3). In our particular case, these five samples represented the whole fermentation process. It was decided to analyze the selected samples with two GC-MS methods for their non-sugar composition, as GC-MS is capable of detecting a broad range of compounds, including several knowns (Table 2). As the compounds of interest in this study are potential inhibitors in biomass hydrolysates, it is important to remove sugars from the fermentation samples. This is mainly because sugars were present in large quantity in those samples, which severely interferes with the detection of non-sugar compounds [49,59]. For this purpose, two sample work-up methods were used, namely, ethyl acetate extraction and ethylchloroformate derivatization. Ethyl acetate extraction GC-MS (EA-GC-MS) was adopted from the method described by Heer et al. [55]. In this method, the hydrolysate samples were extracted with ethyl acetate (EA), compounds that are apolar, e.g. with aromatic rings, dissolved in EA, while polar compounds, like
M Metabolites 2013, 3
1336
ssugars, remaained in thee water phasse. In this way, w sugars were remooved from thhe hydrolyssate samples, a the extrracted comppounds werre concentrated. As th and he solubilityy of differennt compoun nds varies in i E recoverry was a maain issue inn EA-GC-M EA, MS method. Therefore, before anallyzing hydrrolysates, thhe r recovery of EA methodd was assesssed with seeveral refereence compoounds. Thiss allowed th he estimatioon o compound recovery in fermentaation samplees. of Ethylchlooroformate derivatizatiion GC-MS S (EC-GC-M MS) was adapted to thee use for th he analysis of o b biomass hydrolysate samples s [677]. The meethod conveerts acids to t their ethhyl ester form fo througgh d derivatizatio on with ethhylchloroforrmate and extracts th he derivatizzed samplee with dich hloromethanne (DCM). Thiis allowed the t detectionn of carboxxylic acids, amino acids, aromatic compounds and furanns. T main issue The i of EC C-GC-MS method waas the diveerse reactivvity of diffferent comp pounds witth e ethylchlorof formate. Thhis may resuult in deteccting compo ounds preseent at high concentratiion with low w r recovery. Thhe compounnds detectedd by EC-GC C-MS partly y overlappeed but also complemen nted the onees m measured with EA-GC--MS. From theese analysees, “ compoound lists” will be generated foor each meethod. The initial peaak c characteriza ation will bee done by comparing the mass spectra s of thhese peaks with the mass m spectraal r reference libbraries availlable in our lab. Figuree 3. Dupliicate fermeentation results of th he followinng two hyddrolysates: wheat straw-mild alkaline (trianglee) and wheat straw-dillute acid (sstar) (blue: OD, red: glucose g percenntage, greenn: ethanol percentage) p ; and illusttration of thhe three ferrmentation phases and the five selected sample points withh wheat straw w-mild alkaaline fermenntation (triaangle).
4 Data Annalysis and Interpretatiion 4.4. The statistical questtion of our study is, to t determin ne which vaariables conntribute the most to thhe s selected pheenotypes. Too answer thhis questionn, the two data-sets gennerated in thhe previouss step will be b a analyzed byy building statistical s m models. Thee model to be used is partial leaast square (PLS), whicch p provides coompounds that t most closely c relaate to the four f defined phenotyppes. To con nduct modeel b building, thee followingg aspects neeed to be caarefully stu udied (1) daata preproceessing, (2) model m inpuut, a (3) moddel validatioon method. and
Metabolites 2013, 3
137
Based on the property of the acquired data-sets, square-root transformation and autoscaling will be conducted to preprocess the data. These two methods are to reduce the heteroscedasticity and to amplify the variation in the data-sets, respectively [38]. To model lag-phase, a data-set containing the first two time-point samples (Figure 3) can be used as model input. This is because lag-phase ends at the second sampling point, and it is assumed that after growth starts, the hydrolysate composition has no influence on lag-phase anymore. To model the other three phenotypes, all five time-point samples are to be used, since the influence of any of the five sampling points on these phenotypes cannot be excluded. One way to validate the models is to check their ability of predicting the phenotypes of a new data-set. A so-called double cross validation method is preferred to validate the PLS models in this study, as it evaluates the model quality in a more strict manner [28,88]. The modeling results will provide, for each phenotype, a set of compounds that contribute the most to that specific phenotype. The next step will then be to evaluate if these compounds are actually inhibitory to the fermenting microbe. The experimental evaluation of the toxicity of known compounds can be relatively simple. However, to evaluate the toxicity of ‘unknown’ compounds, further compound identification is required. 5. Conclusions This review illustrated the application of exometabolomics approaches, both targeted and nontargeted, in studying lignocellulosic biomass hydrolysates as fermentation media. Through analyzing the composition of hydrolysates, targeted exometabolomics has been applied to identify inhibitory compounds, improve hydrolysate preparation method, and monitor compound dynamics during detoxification and fermentation process. To further reveal the overall non-sugar composition of various hydrolysates and identify fermentation inhibitors in an unbiased manner, a non-targeted approach was introduced. Its application was demonstrated in our research to identify inhibitors in biomass hydrolysates relevant for ethanolic fermentation of S. cerevisiae, emphasizing the essential role of experimental design, phenotype definition, selection of both analytical methods and statistical models in the non-targeted metabolomics approach. Acknowledgments This project was (co) financed by the Netherlands Metabolomics (NMC) which is part of the Netherlands Genomics Initiative / Netherlands Organization for Scientific Research. Conflict of Interest The authors declare no conflict of interest. References 1.
Sun, Y.; Cheng, J. Hydrolysis of lignocellulosic materials for ethanol production: A review. Bioresource Technol. 2002, 83, 1–11.
Metabolites 2013, 3 2. 3. 4. 5.
6. 7.
8. 9. 10.
11.
12. 13.
14. 15. 16. 17. 18.
19.
138
Zhang, Y.H. Reviving the carbohydrate economy via multi-product lignocellulose biorefineries. J. Ind. Microbiol. Biot. 2008, 35, 367–375. Hahn-Hägerdal, B.; Galbe, M.; Gorwa-Grauslund, M.,F; Lidén, G.; Zacchi, G. Bio-ethanol -- the fuel of tomorrow from the residues of today. Trends Biotechnol. 2006, 24, 549–556. Metzger, J.O.; Hüttermann, A. Sustainable global energy supply based on lignocellulosic biomass from afforestation of degraded areas. Naturwissenschaften 2009, 96, 279–288. Carpita, N.C.; Gibeaut, D.M. Structural models of primary cell walls in flowering plants: consistency of molecular structure with the physical properties of the walls during growth. Plant J. 1993, 3, 1–30. Sarkar, P.; Bosneaga, E.; Auer, M. Plant cell walls throughout evolution: Towards a molecular understanding of their design principles. J. Exp. Bot. 2009, 60, 3615–3635. Mosier, N.; Wyman, C.; Dale, B.; Elander, R.; Lee, Y.Y.; Holtzapple, M.; Ladisch, M. Features of promising technologies for pretreatment of lignocellulosic biomass. Bioresource Technol. 2005, 96, 673–686. Agbor, V.B.; Cicek, N.; Sparling, R.; Berlin, A.; Levin, D.B. Biomass pretreatment: Fundamentals toward application. Biotechnol. Adv. 2011, 29, 675–685. Hendriks, A.T.W.M.; Zeeman, G. Pretreatments to enhance the digestibility of lignocellulosic biomass. Bioresource Technol. 2008, 100, 10–18. Alvira, P.; Tomás-Pejó, E.; Ballesteros, M.; Negro, M.J. Pretreatment technologies for an efficient bioethanol production process based on enzymatic hydrolysis: A review. Bioresource Technol. 2010, 101, 4851–4861. Zha, Y.; Slomp, R.; Groenestijn, J.; Punt, P.J. Preparation and Evaluation of Lignocellulosic Biomass Hydrolysates for Growth by Ethanologenic Yeasts. In Microbial Metabolic Engineering: Methods and Protocols; Qiong, C., Ed.; Humana Press: New York, USA, 2012; pp. 245–259. Palmqvist, E.; Hahn-Hägerdal, B. Fermentation of lignocellulosic hydrolysates. II: Inhibitors and mechanisms of inhibition. Bioresource Technol. 2000, 74, 25–33. Klinke, H.B.; Thomsen, A.B.; Ahring, B.K. Inhibition of ethanol-producing yeast and bacteria by degradation products produced during pre-treatment of biomass. Appl. Microbiol. Biot. 2004, 66, 10–26. Fiehn, O. Metabolomics—the link between genotypes and phenotypes. Plant Mol. Biol. 2002, 48, 155–171. Roessner, U.; Bowne, J. What is metabolomics all about? Biotechniques 2009, 46, 363–365. Van der Werf, M.J.; Overkamp, K.M.; Muilwijk, B.; Coulier, L.; Hankemeier, T. Microbial metabolomics: Toward a platform with full metabolome coverage. Anal. Biochem. 2007, 370, 17–25. Fukusaki, E.; Kobayashi, A. Plant metabolomics: potential for practical operation. J. Biosci. Bioeng. 2005, 100, 347–354. Nicolaou, S.A.; Gaida, S.M.; Papoutsakis, E.T. A comparative view of metabolite and substrate stress and tolerance in microbial bioprocessing: From biofuels and chemicals, to biocatalysis and bioremediation. Metab. Eng. 2010, 12, 307–331. Braaksma, M.; Bijlsma, S.; Coulier, L.; Punt, P.J.; van der Werf, M.J. Metabolomics as a tool for target identification in strain improvement: the influence of phenotype definition. Microbiology 2011, 157, 147–159.
Metabolites 2013, 3
139
20. Ding, M.; Tian, H.; Cheng, J.; Yuan, Y. Inoculum size-dependent interactive regulation of metabolism and stress response of Saccharomyces cerevisiae revealed by comparative metabolomics. J. Biotechnol. 2009, 144, 279–286. 21. van Ravenzwaay, B.; Cunha, G.C.; Leibold, E.; Looser, R.; Mellert, W.; Prokoudine, A.; Walk, T.; Wiemer, J. The use of metabolomics for the discovery of new biomarkers of effect. Toxicol. Lett. 2007, 172, 21–28. 22. Gu, H.; Pan, Z.; Xi, B.; Asiago, V.; Musselman, B.; Raftery, D. Principal component directed partial least squares analysis for combining nuclear magnetic resonance and mass spectrometry data in metabolomics: Application to the detection of breast cancer. Anal. Chim. Acta 2011, 686, 57–63. 23. Dunn, W.B.; Ellis, D.I. Metabolomics: Current analytical platforms and methodologies. TRACTrend Anal. Chem. 2005, 24, 285–294. 24. Mashego, M.; Rumbold, K.; De Mey, M.; Vandamme, E.; Soetaert, W.; Heijnen, J. Microbial metabolomics: past, present and future methodologies. Biotechnol. Lett. 2007, 29, 1–16. 25. van der Werf, M.J.; Jellema, R.H.; Hankemeier, T. Microbial metabolomics: replacing trial-anderror by the unbiased selection and ranking of targets. J. Ind. Microbiol. Biot. 2005, 32, 234–252. 26. Villas-Bôas, S.G.; Noel, S.; Lane, G.A.; Attwood, G.; Cookson, A. Extracellular metabolomics: A metabolic footprinting approach to assess fiber degradation in complex media. Anal. Biochem. 2006, 349, 297–305. 27. Bino, R.J.; Hall, R.D.; Fiehn, O.; Kopka, J.; Saito, K.; Draper, J.; Nikolau, B.J.; Mendes, P.; Roessner-Tunali, U.; Beale, M.H.; Trethewey, R.N.; Lange, B.M.; Wurtele, E.S.; Sumner, L.W. Potential of metabolomics as a functional genomics tool. Trends Plant Sci. 2004, 9, 418–425. 28. Westerhuis, J.; Hoefsloot, H.; Smit, S.; Vis, D.; Smilde, A.; van Velzen, E.; van Duijnhoven, J.; van Dorsten, F. Assessment of PLSDA cross validation. Metabolomics 2008, 4, 81–89. 29. Rubingh, C.; Bijlsma, S.; Derks, E.; Bobeldijk, I.; Verheij, E.; Kochhar, S.; Smilde, A. Assessing the performance of statistical validation tools for megavariate metabolomics data. Metabolomics 2006, 2, 53–61. 30. Verouden, M.P.H.; Westerhuis, J.A.; van der Werf, M.J.; Smilde, A.K. Exploring the analysis of structured metabolomics data. Chemometr. Intell. Lab. 2009, 98, 88–96. 31. Gibon, Y.; Rolin, D. Aspects of Experimental Design for Plant Metabolomics Experiments and Guidelines for Growth of Plant Material. In Plant Metabolomics: Methods and Protocols; Hardy, N.W., Hall, R.D., Eds.; Humana Press: New York, USA, 2012; pp. 13–30. 32. Kristal, B.; Shurubor, Y.; Paolucci, U.; Matson, W. Methodological Issues and Experimental Design Considerations in Metabolic Profile-Based Classifications. In Metabolome Analyses: Strategies for Systems Biology; Vaidyanathan, S., Harrigan, G.G., Goodacre, R., Eds.; Springer: New York, USA, 2005; pp. 173–194. 33. Qualley, A.V.; Dudareva, N. Metabolomics of Plant Volatiles. In Plant Systems Biology; Belostotsky, D.A., Ed.; Humana Press: New York, USA, 2009; pp. 329–343. 34. Schauer, N.; Fernie, A.R. Plant metabolomics: towards biological function and mechanism. Trends Plant Sci. 2006, 11, 508–516. 35. Lee, Y.C. Carbohydrate analyses with high-performance anion-exchange chromatography. J. Chromatogr. A 1996, 720, 137–149.
Metabolites 2013, 3
140
36. Bowman, M.J.; Dien, B.S.; Hector, R.E.; Sarath, G.; Cotta, M.A. Liquid chromatography–mass spectrometry investigation of enzyme-resistant xylooligosaccharide structures of switchgrass associated with ammonia pretreatment, enzymatic saccharification, and fermentation. Bioresource Technol. 2012, 110, 437–447. 37. Roessner, U.; Nahid, A.; Chapman, B.; Hunter, A.; Bellgard, M. Metabolomics – The Combination of Analytical Biochemistry, Biology, and Informatics. In Comprehensive Biotechnology, 2nd Edition; Moo-Young, M., Ed.; Academic Press: Burlington, Canada, 2011; pp. 447–459. 38. van den Berg, R.; Hoefsloot, H.C.J.; Westerhuis, J.; Smilde, A.; van der Werf, M.J. Centering, scaling, and transformations: improving the biological information content of metabolomics data. BMC Genomics 2006, 7, 142. 39. Daffertshofer, A.; Lamoth, C.J.C.; Meijer, O.G.; Beek, P.J. PCA in studying coordination and variability: a tutorial. Clin. Biomech. 2004, 19, 415–428. 40. Krishnan, A.; Williams, L.J.; McIntosh, A.R.; Abdi, H. Partial Least Squares (PLS) methods for neuroimaging: A tutorial and review. Neuroimage 2011, 56, 455–475. 41. Lutz, U.; Lutz, R.W.; Lutz, W.K. Metabolic profiling of glucuronides in human urine by LCMS/MS and partial least-squares discriminant analysis for classification and prediction of gender. Anal. Chem. 2006, 78, 4564–4571. 42. Thissen, U.; Coulier, L.; Overkamp, K.M.; Jetten, J.; van der Werff, B.J.C.; van de Ven, T.; van der Werf, M.J. A proper metabolomics strategy supports efficient food quality improvement: A case study on tomato sensory properties. Food Qual. Prefer. 2011, 22, 499–506. 43. Gruben, B.S. General introduction. PhD thesis: Novel transcriptional activators of Aspergillus involved in plant biomass utilization 2012, 3–49. 44. Taherzadeh, M.J.; Karimi, K. Fermentation Inhibitors in Ethanol Processes and Different Strategies to Reduce Their Effects. In Biofuels: Alternative Feedstocks and Conversion Processes; Pandey, A., Larroche, C., Ricke, S.C., Dussap, C.-G., Gnansounou, E., Eds.; Academic Press, Waltham, Massachusetts, USA, 2011; pp. 287–311. 45. Almeida, J.R.M.; Modig, T.; Petersson, A.; Hähn-Hägerdal, B.; Lidén, G.; Gorwa-Grauslund, M.F. Increased tolerance and conversion of inhibitors in lignocellulosic hydrolysates by Saccharomyces cerevisiae. J. Chem. Technol. Biot. 2007, 82, 340–349. 46. Ando, S.; Arai, I.; Kiyoto, K.; Hanai, S. Identification of aromatic monomers in steam-exploded poplar and their influences on ethanol fermentation by Saccharomyces cerevisiae. J. Ferment. Technol. 1986, 64, 567–570. 47. Nichols, N.N.; Sharma, L.N.; Mowery, R.A.; Chambliss, C.K.; Van Walsum, G.P.; Dien, B.S.; Iten, L.B. Fungal metabolism of fermentation inhibitors present in corn stover dilute acid hydrolysate. Enzyme Microb. Tech. 2008, 42, 624–630. 48. Raj, A.; Krishna Reddy, M.M.; Chandra, R. Identification of low molecular weight aromatic compounds by gas chromatography–mass spectrometry (GC–MS) from kraft lignin degradation by three Bacillus sp. Int. Biodeter. Biodegr. 2007, 59, 292–296. 49. Koo, B.W.; Park, N.; Jeong, H.S.; Choi, J.W.; Yeo, H.; Choi, I.G. Characterization of by-products from organosolv pretreatments of yellow poplar wood (Liriodendron tulipifera) in the presence of acid and alkali catalysts. J. Ind. Eng. Chem. 2011, 17, 18–24.
Metabolites 2013, 3
141
50. Larsson, S.; Quintana-Sáinz, A.; Reimann, A.; Nilvebrant, N.O.; Jönsson, L.J. Influence of lignocellulose-derived aromatic compounds on oxygen-limited growth and ethanolic fermentation by Saccharomyces cerevisiae. Appl. Biochem. Biotech. 2000, 84–86, 617–632. 51. Ranatunga, T.D.; Jervis, J.; Helm, R.F.; McMillan, J.D.; Hatzis, C. Identification of inhibitory components toxic toward Zymomonas mobilis CP4(pZB5) xylose fermentation. Appl. Biochem. Biotech. 1997, 67, 185–198. 52. Chen S.F.; Mowery R.A.; Castleberry V.A.; van, W.G.; Chambliss C.K. High-performance liquid chromatography method for simultaneous determination of aliphatic acid, aromatic acid and neutral degradation products in biomass pretreatment hydrolysates. J. Chromatogr. A 2006, 1104, 54–61. 53. Vaher, M.; Helmja, K.; Käsper, A.; Kurašin, M.; Väljamäe, P.; Kudrjašova, M.; Koel, M.; Kaljurand, M. Capillary electrophoretic monitoring of hydrothermal pre-treatment and enzymatic hydrolysis of willow: Comparison with HPLC and NMR. Catal. Today in press. 54. Chundawat, S.P.S.; Vismeh, R.; Sharma, L.N.; Humpula, J.F.; da Costa Sousa, L.; Chambliss, C.K.; Jones, A.D.; Balan, V.; Dale, B.E. Multifaceted characterization of cell wall decomposition products formed during ammonia fiber expansion (AFEX) and dilute acid based pretreatments. Bioresource Technol. 2010, 101, 8429–8438. 55. Heer, D.; Sauer, U. Identification of furfural as a key toxin in lignocellulosic hydrolysates and evolution of a tolerant yeast strain. Microbial Biotechnology 2008, 1, 497–506. 56. Kolb, M.; Sieber, V.; Amann, M.; Faulstich, M.; Schieder, D. Removal of monomer delignification products by laccase from Trametes versicolor. Bioresource Technol. 2012, 104, 298–304. 57. Jönsson, L.J.; Palmqvist, E.; Nilvebrant, N.-O.; Hahn-Hägerdal, B. Detoxification of wood hydrolysates with laccase and peroxidase from the white-rot fungus Trametes versicolor. Appl. Microbiol. Biotechnol. 1998, 49, 691–697. 58. Huang, H.; Guo, X.; Li, D.; Liu, M.; Wu, J.; Ren, H. Identification of crucial yeast inhibitors in bio-ethanol and improvement of fermentation at high pH and high total solids. Bioresource Technol. 2011, 102, 7486–7493. 59. Klinke, H.B.; Olsson, L.; Thomsen, A.B.; Ahring, B.K. Potential inhibitors from wet oxidation of wheat straw and their effect on ethanol production of Saccharomyces cerevisiae: Wet oxidation and fermentation by yeast. Biotechnol. Bioeng. 2003, 81, 738–747. 60. Larsson, S.; Reimann, A.; Nilvebrant, N.-.; Jönsson, L.J. Comparison of different methods for the detoxification of lignocellulose hydrolyzates of spruce. Appl. Biochem. Biotech. 1999, 77, 91–103. 61. Klinke, H.B.; Ahring, B.K.; Schmidt, A.S.; Thomsen, A.B. Characterization of degradation products from alkaline wet oxidation of wheat straw. Bioresource Technol. 2002, 82, 15–26. 62. Panagiotopoulos, I.A.; Bakker, R.R.; de Vrije, T.; Koukios, E.G. Effect of pretreatment severity on the conversion of barley straw to fermentable substrates and the release of inhibitory compounds. Bioresource Technol. 2011, 102, 11204–11211. 63. Larsson, S.; Palmqvist, E.; Hahn-Hägerdal, B.; Tengborg, C.; Stenberg, K.; Zacchi, G.; Nilvebrant, N.-O. The generation of fermentation inhibitors during dilute acid hydrolysis of softwood. Enzyme Microb. Technol. 1999, 24, 151–159.
Metabolites 2013, 3
142
64. Liu, Z.L.; Slininger, P.J.; Dien, B.S.; Berhow, M.A.; Kurtzman, C.P.; Gorsich, S.W. Adaptive response of yeasts to furfural and 5-hydroxymethylfurfural and new chemical evidence for HMF conversion to 2,5-bis-hydroxymethylfuran. J. Ind. Microbiol. Biot. 2004, 31, 345–352. 65. Lu, X.; Yamauchi, K.; Phaiboonsilpa, N.; Saka, S. Two-step hydrolysis of Japanese beech as treated by semi-flow hot-compressed water. J. Wood Sci. 2009, 55, 367–375. 66. Humpula, J.F.; Chundawat, S.P.S.; Vismeh, R.; Jones, A.D.; Balan, V.; Dale, B.E. Rapid quantification of major reaction products formed during thermochemical pretreatment of lignocellulosic biomass using GC–MS. J. Chromatogr. B 2011, 879, 1018–1022. 67. Zha, Y.; Muilwijk, B.; Coulier, L.; Punt, P. Inhibitory Compounds in Lignocellulosic Biomass Hydrolysates during Hydrolysate Fermentation Processes. J. Bioprocess Biotechniq. 2012, 2, doi: 10.4172/2155–9821.1000112. 68. Sharma, L.N.; Becker, C.; Chambliss, K.C. Analytical Characterization of Fermentation Inhibitors in Biomass Pretreatment Samples Using Liquid Chromatography, UV-Visible Spectroscopy, and Tandem Mass Spectrometry. In Biofuels: Methods and Protocols; Mielenz, J.R., Ed.; Humana Press: New York, USA, 2009; pp. 125–143. 69. Delgenes, J.P.; Moletta, R.; Navarro, J.M. Effects of lignocellulose degradation products on ethanol fermentations of glucose and xylose by Saccharomyces cerevisiae, Zymomonas mobilis, Pichia stipitis, and Candida shehatae. Enzyme Microb. Technol. 1996, 19, 220–225. 70. Palmqvist, E.; Hahn-Hägerdal, B. Fermentation of lignocellulosic hydrolysates. I: inhibition and detoxification. Bioresource Technol. 2000, 74, 17–24. 71. Alriksson, B.; Cavka, A.; Jönsson, L.J. Improving the fermentability of enzymatic hydrolysates of lignocellulose through chemical in-situ detoxification with reducing agents. Bioresource Technol. 2011, 102, 1254–1263. 72. Huang, X.; Wang, Y.; Liu, W.; Bao, J. Biological removal of inhibitors leads to the improved lipid production in the lipid fermentation of corn stover hydrolysate by Trichosporon cutaneum. Bioresource Technol. 2011, 102, 9705–9709. 73. Miyafuji, H.; Danner, H.; Neureiter, M.; Thomasser, C.; Bvochora, J.; Szolar, O.; Braun, R. Detoxification of wood hydrolysates with wood charcoal for increasing the fermentability of hydrolysates. Enzyme Microb. Technol. 2003, 32, 396–400. 74. Millati, R.; Niklasson, C.; Taherzadeh, M.J. Effect of pH, time and temperature of overliming on detoxification of dilute-acid hydrolyzates for fermentation by Saccharomyces cerevisiae. Process Biochem. 2002, 38, 515–522. 75. Zhu, J.; Yong, Q.; Xu, Y.; Yu, S. Detoxification of corn stover prehydrolyzate by trialkylamine extraction to improve the ethanol production with Pichia stipitis CBS 5776. Bioresource Technol. 2011, 102, 1663–1668. 76. Martinez, A.; Rodriguez, M.E.; York, S.W.; Preston, J.F.; Ingram, L.O. Effects of Ca(OH)2 treatments (“overliming”) on the composition and toxicity of bagasse hemicellulose hydrolysates. Biotechnol. Bioeng. 2000, 69, 526–536. 77. Moreno, A.D.; Ibarra, D.; Fernández, J.L.; Ballesteros, M. Different laccase detoxification strategies for ethanol production from lignocellulosic biomass by the thermotolerant yeast Kluyveromyces marxianus CECT 10875. Bioresource Technol. 2012, 106, 101–109.
Metabolites 2013, 3
143
78. Pienkos, P.T.; Zhang, M. Role of pretreatment and conditioning processes on toxicity of lignocellulosic biomass hydrolysates. Cellulose 2009, 16, 743–762. 79. Taherzadeh, M.J.; Gustafsson, L.; Niklasson, C.; Lidén, G. Conversion of furfural in aerobic and anaerobic batch fermentation of glucose by Saccharomyces cerevisiae. J. Biosci. Bioeng. 1999, 87, 169–174. 80. Rumbold, K.; van Buijsen, H.J.J.; Gray, V.M.; van Groenestijn, J.W.; Overkamp, K.M.; Slomp, R.S.; van, d.W.; Punt, P.J. Microbial renewable feedstock utilization: A substrate-oriented approach. Bioengineered Bugs 2010, 1, 359–366. 81. Thomsen, M.H.; Thygesen, A.; Thomsen, A.B. Identification and characterization of fermentation inhibitors formed during hydrothermal treatment and following SSF of wheat straw. Appl. Microbiol. Biotechnol. 2009, 83, 447–455. 82. Chen, M.; Zhao, J.; Xia, L. Comparison of four different chemical pretreatments of corn stover for enhancing enzymatic digestibility. Biomass Bioenergy 2009, 33, 1381–1385. 83. Laser, M.; Schulman, D.; Allen, S.G.; Lichwa, J.; Antal, M.J.; Lynd, L.R. A comparison of liquid hot water and steam pretreatments of sugar cane bagasse for bioconversion to ethanol. Bioresource Technol. 2002, 81, 33–44. 84. Rabelo, S.C.; Filho, R.M.; Costa, A.C. A comparison between lime and alkaline hydrogen peroxide pretreatments of sugarcane bagasse for ethanol production. Appl. Biochem. Biotechnol. 2008, 148, 45–58. 85. Talebnia, F.; Karakashev, D.; Angelidaki, I. Production of bioethanol from wheat straw: An overview on pretreatment, hydrolysis and fermentation. Bioresource Technol. 2010, 101, 4744–4753. 86. Cardona, C.A.; Quintero, J.A.; Paz, I.C. Production of bioethanol from sugarcane bagasse: Status and perspectives. Bioresource Technol. 2010, 101, 4754–4766. 87. Hashaikeh, R.; Fang, Z.; Butler, I.S.; Hawari, J.; Kozinski, J.A. Hydrothermal dissolution of willow in hot compressed water as a model for biomass conversion. Fuel 2007, 86, 1614–1622. 88. Smit, S.; van Breemen, M.J.; Hoefsloot, H.C.J.; Smilde, A.K.; Aerts, J.M.F.G.; de Koster, C.G. Assessing the statistical validity of proteomics based biomarkers. Anal. Chim. Acta 2007, 592, 210–217. © 2013 by the authors; licensee MDPI, Basel, Switzerland. This article is an open access article distributed under the terms and conditions of the Creative Commons Attribution license (http://creativecommons.org/licenses/by/3.0/).