Experience of Online Partial Discharge Monitoring on a Wide-Area Medium Voltage Network Ravish P.Y. Mehairjan1, 2, Dhiradj Djairam1, Sander Meijer1, Peter Zonneveld2, Johan J. Smit1 1) High Voltage Technology & Asset Management Delft University of Technology, Delft, the Netherlands 2) Asset Management Stedin B.V. Rotterdam, the Netherlands
[email protected]/
[email protected] Abstract— Partial discharge (PD) activities in cables and switchgears provide an indication of weak spots in insulation systems. The business drivers for carrying out asset condition assessments such as PD measurements on network assets vary from the type of electricity network (high voltage, HV or medium voltage, MV), the location in the grid and purpose of the assets and the network owner’s operational and maintenance process requirements. In MV distribution networks, the application of (periodic) online PD monitoring is gradually gaining more interest worldwide. The main reason for this is the ability to identify possible risks with the assets in-service, allowing the assets to be assessed under normal operating condition. This paper presents the recent experience of the application of a low cost online handheld PD screening measurement in a wide-area MV network (ring structured MV distribution network, which is radially operated and consists of a number of medium/low voltage (MV/LV) secondary substations and intermediate cable circuits). The measurement outcomes revealed traces of possible degradation on different location in MV switchgears. These traces may directly or indirectly be due to the measured PD activity, however, this is not yet confirmed because of the exceptional nature of these traces of which the utility had no prior experiences. Altogether, the handheld PD screening led to the detection of potential assets with a high risk of failure, which would otherwise not be known to the utility. Such a wide-area approach of handheld PD screening technology has provided the asset managers with a fast and low cost method to measure PD activity and assess potential high risk assets. Keywords- online partial discharge; distribution network; asset management.
I.
medium
traditional time based maintenance regime. However, the business drivers for a certain maintenance strategy (in favour of large scale deployment of condition monitoring) depend on the network type, asset type, risk levels and risk management policy and may vary from one utility to another [1, 2, 4]. Generally speaking, the following business drivers for carrying out condition monitoring on assets, apply to both transmission and distribution network as well as other commercial and industrial power networks:
voltage;
INTRODUCTION
-
Risks related to health, safety and environment: e.g. apply condition monitoring to detect faults which may cause explosions and thus ensure safety to staff or public and minimise risk of failures.
-
Extend lifetime of assets: e.g. to support and justify certain asset replacement plans or replacement deferrals, condition assessments are required for reliable life extension of network assets.
-
Mitigate unplanned outages and downtime: e.g. carry out condition monitoring to mitigate the effect of asset failure induced downtime.
-
Asset and maintenance management: e.g. carry out condition monitoring as a type of maintenance inspection and analyse the obtained data to detect signs of degradation, diagnose cause of faults, and predict the remaining asset operational and economical lifetime. Furthermore, to provide health indices of the populations of assets to the regulator.
In this contribution, we will focus on the recent experience of the application of a low cost online handheld PD screening measurement in a wide-area MV network (ring structured MV distribution network, which is radially operated and consists of a number of medium/ low voltage (MV/LV) secondary substations and intermediate cable circuits). The main driver behind this case study was to prevent and mitigate possible unplanned outages and downtime as results of an earlier occurring and long lasting earth fault in an un-earthed MV distribution cable network. It was argued that the long lasting earth fault, which typically results in elevated voltage levels on the healthy phases, might have stressed surrounding assets and
In recent years condition monitoring and diagnostic devices and systems have become more available and more widespread in their application in electricity transmission and distribution networks worldwide [1, 2]. The work published by [3, 9] as early as 1988 already recognized the importance of (online) predictive maintenance systems, improving sensing and condition monitoring technology and expert systems. Nowadays, on one hand, a wide range of less sophisticated and low cost systems are available, whilst, on the other hand, highly complex multi-device systems with high initial costs are available. It has been found in a number of publications [1] that condition based maintenance have advantages over a
This research has been performed in collaboration with Stedin B.V. (a Dutch Distribution Network Operator, DNO).
430
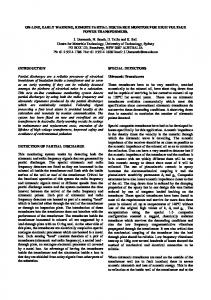
TABLE 1: Schematic overview handheld device connection and different sensors for the detection of different sources of PD activity in MV equipment. [5, 6].
caused them to come into a critical state. To investigate this possibility, an online PD screening was performed. The use of PD measurements is an accepted method for insulation diagnosis. Insulation defects produce, in many cases, discharging activity and can be diagnosed by different PD measurement techniques/methods in order to draw conclusions of the actual insulation status [8].
Schematic overview
Transient Earth Voltage (TEV): built-in capacitive sensor which can be held or pressed directly against metal-clad housing, gaskets and cable terminations. Detects electromagnetic radiation from local PD source.
In section II, the handheld PD screening device and sensors will be discussed briefly. In section III, the experiences of the application of this system on a wide-area distribution network and the results are given. In section IV, a number of concluding remarks are given together with implications for a condition monitoring strategy. II.
Sensor/ Attachment Point/ PD Detection
High Frequency Current Transformer (HFCT): clipped around the MV cable earth wire or power cable with earth wire brought back through sensor. This sensor detects PD induced current impulses in cables, cable terminations and switchgear the cables are terminated into.
HANDHELD PD SCREENING TECHNOLOGY
A. Background There are a number of handheld PD screening technologies available on the market nowadays. We will not discuss the different technologies here, as the focus of this paper is to share a recent experience with one of these technologies. However, the availability of different handheld PD screening technologies (e.g. products from HVPD, EA Technology, SebaKMT) shows the gradual increase in development and upcoming role of condition monitoring for the purpose of predictive asset and maintenance management of network assets. It is also the request from utilities for a simple, low cost and easy to use PD detection tool that has led to the development of such methods. In general, the handheld PD screening technology can be seen as a tool which provides a “first line in defence” [5] for early PD activity in different MV assets (cables, switchgears, terminations, etc.). Moreover, such a tool can be part of a comprehensive condition monitoring strategy (consisting of a screening stage, offline diagnostic stage, permanent condition monitoring stage, etc.) for maintenance management purposes.
Airborne Acoustic (AA): built-in acoustic sensor which can be placed directly over air vents and other openings (line of sight detection). Detects ultrasonic radiation through air from corona and surface discharges in air insulated switchgears and other equipment.
C. Application of handheld PD device As said earlier, the handheld PD device is meant to be used as an easy and fast tool for initial screening for (suspected) MV switchgears and cables. With the application of such a handheld PD screening technology, large numbers of MV assets can be scanned for PD activity. Based on the findings from this quick identification of potential insulation defects, a more detailed and in-depth diagnosis can be decided upon. Amongst others, such further investigation can be permanent online PD measurements, conventional offline PD diagnostics or complete replacement or maintenance of the suspected component. As with many other online measurements, noise signals originating from switching power supplies and other low frequency noise can obscure the PD signals which we want to detect. In MV networks, noise signals can play a role and therefore a high-pass filter can be attached to the handheld device. In our case study, a high-pass 100 kHz filter was used, because the measurements were influenced by noise. The high-pass filter removes high levels of background noise (below 100 kHz) without affecting PD measurements.
B. Handheld PD device and sensors For the online detection of PD activity in assets (cables, switchgears, etc.) sensors are required that can detect the electromagnetic and acoustic energies that are radiated from the possible PD location. For this purpose, non-intrusive sensors should be utilised. According to [5] the PD induced signals can be detected by using non-intrusive sensors usually attached to the outer earthed surfaces of the equipment under investigation. Basically, the handheld PD device used in our application has three PD sensor connection possibilities for detection of different sources of PD activity in MV cables and equipment (voltage range from 3.3 kV to 45 kV). In table 1 a brief overview is given.
431
C. Stage 1: Primary substation level PD handheld screening At the primary HV/MV (25 kV/ 10 kV) substation, from where the feeder that had the previously described earth fault was energized, a quick PD screening measurement was carried out. In total, 27 single cable sections have been diagnosed with the PD handheld system. At the first stage, the PD activity has been measured by installation of the HFCT sensor on the cable screen wire which is connected to the main earth point of the substation. These measurement take about 1 to 2 minutes per single feeder. The PD amplitude is presented in form of active LEDs with different colours related to particular PD amplitude range. Secondly, the TEV sensor was used to screen the overall condition of the 10 kV switchgear. Colour coded criticality was indicated (LEDs) and digital dB signal on the display. To reduce background noise level, a 100kHz filter was used with HFCT sensor. In table 2 the combined results from the HFCT and TEV sensors for 4 out of the 27 measured cable sections are given. Cable section A, for instance, had high PD magnitudes in both cases, namely with and without high-pass filter. However, this cable is a feeder to a local metro station and the level of high frequency noise at this location substantially influenced the measurement results, making it very difficult to draw conclusions from these. Cable section C showed, with filter, no significant PD activity and was therefore classified as “no action required”. It was found that cable sections B and D have moderate PD magnitudes and also relatively high levels for local (switchgear) dB value (TEV sensor).
III. EXPERIENCE OF ONLINE PARTIAL DISCHARGE MONITORING ON A WIDE-AREA MEDIUM VOLTAGE NETWORK A. Case study and experiences with handheld device At Stedin, the third largest Dutch Distribution Network Operator (DNO), parts of the MV network have been designed with the principles of un-earthed star-point grounding (floating system). An advantage of such a design is that the voltage between the phases themselves, in case of a phase to ground fault, is hardly influenced. Consequently, the loads are not changed and the system remains in operation. However, the downside to this is that the absolute voltages of the healthy phases are increased by a factor √3 in the case of a phase-toearth fault [7]. Recently, as result of a dormant fault in an unearthed 10 kV network of Stedin, a long lasting earth fault (> 6 hours) occurred. After this dormant fault was finally isolated by the protection system, it was also found from the failure investigation later on that the earth fault was the cause and had been present for approximately 6 hours, if not longer. The asset managers then argued that this long lasting earth fault, which resulted in elevated voltage levels on the healthy phases, might have stressed surrounding assets and caused them to come into a critical state. As “first line in defence”, without time consuming or costly investigations, the asset managers decided to carry out measurements to get a rough initial result whether this long lasting earth fault might had stressed the nearby assets. A quick, low cost PD screening was selected. There were especially concerns about possible higher levels of PD activities in surrounding cable joints, terminations and cables. Besides this, Stedin also wanted to gain hands-on experience with such handheld PD screening technologies. Thus, the drivers for the application of a handheld PD screening tool were manifold.
TABLE 2: Results from stage 1 measurements for 4 out of 27 measured single cable sections and switchgears (combination of HFCT and TEV sensors) .
HFCT (LED) b - blink (not constant)
B. Stages of application A two stages approach was set up. 1.
Secti on
Stage 1: A quick PD scan was performed at the primary HV/MV substation assessing the outgoing cables and local switchgear assets.
A
The quick scan was performed by the PD handheld device, which comprises of a combination of inductive High Frequency Current Transformer (HFCT) and capacitive Transient Earth Voltage (TEV) sensors. On the basis of the results of stage 1, Stedin would decide on one or combinations of the following stages: 2.
Stage 2: Perform offline PD detection and localization measurement of suspected feeders (from stage 1).
3.
Stage 2: Perform permanent PD monitoring measurements on suspected feeders (from stage 1).
Measu red phases L1 L2 L3
B
All
C
All
D
L1 L2 L3
PD signal (no filters)
TEV (aver age dB)
Overall PD index
HI
High
19
Moderate/ High
17
No action
21
High
PD signal (100kHz filter)
b b b
High PD activity: Need to be checked from both sides or another method as soon as possible Moderate to High: Need to be re-checked with PD handheld or another method within 1 year
4.
Moderate: No action necessary within 2 years No PD (no action necessary): No action necessary within 5 years
Stage 2: Perform a wide-area PD handheld screening on both sides of the cable and all Ring Main Units (RMU’s) in the between the circuit.
Based on the measurement results from the PD handheld screening, the service provider recommended the asset manager to perform another set of PD handheld screenings on sections B and D, in particular, from the far end side of the cable and at all RMU’s in the circuit between both ends of the
432
cable (wide-area network). For stage 2, Stedin decided to continue with item 4: carry out a wide-area (far end and multiple RMU) network PD handheld measurement for sections B and D.
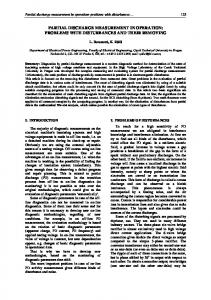
the inspection of these MV switchgears (RMU’s) suspect traces were found, which may be a possible source of the higher HFCT and TEV results. However, this was not confirmed.
D. Stage 2: Monitoring on a Wide-Area Medium Voltage Network In stage 1 it was found that the outgoing feeders of cable sections B and D (see table 2) were suspected to have PD activity present (indicating a possible risk of failure) and therefore required further measurements. In stage 2, the cable sections B and D were measured from the far end. Section B is an outgoing feeder with multiple MV/LV secondary stations in between. In total, 12 secondary MV/LV substations and all intermediate cable sections connecting these MV/LV (behind cable section B) were measured with the PD handheld device. From these online measurements, it was found that two MV/LV locations had high local PD activity. Finally, in collaboration with the maintenance department and the service provider, it was decided to investigate these two switchgears (RMU) of these MV/ LV locations by means of in-depth visual inspections. Under controlled conditions, in order to continue the electricity supply, they were taken out of service and inspected. In figure 1, a one-line diagram schematic representation is given of the 12 locations. Location 1 (L1) corresponds to cable section B (in table 2) and location 2 (L2) to cable sections D (table 2). Locations 3 till 12 (L3-L12) are the MV/LV secondary substations behind cable section B.
Because of the high number of wide variety of assets in the distribution grid. Stedin was looking for a fast and uniform measurement method to determine the condition of these assets. The wide-area approach of handheld PD screening technology has provided Stedin with a fast and low cost method to measure the PD activity and assess potential high risk assets. It was found that the assets, with high PD activity, had traces of possible degradation on different locations in the asset of which, as far as known, the utility had no experience. Thus, the utility, on the basis of these findings, decided to reach out to the manufacturer of these switching equipment to further investigate the suspected traces and its possible causes and mitigating actions. Overall, the application of online PD handheld screening, led to the revelation of possible indications of defective or weak insulation systems in a fast and low cost way. Nonetheless, the correlation between measurements from stage 1 and stage 2 is not yet clear enough. If the measurement results of stage 1 would not have been threatening, it would not automatically have meant that location L8 and L10 were free of suspect defects. This might imply that measurements with the PD screening tool, solely, at the far ends are not sufficient enough and justifies measurements at all adjacent MV/LV locations. This may be attributed to the attenuation of PD signals and disturbance of noise signals in wide-area distribution networks.
IV.
CONCLUSIONS
REFERENCES [1] [2]
[3] [4]
[5]
[6] [7] [8] [9] Fig.1: Results of PD measurements for 12 locations. Locations L8 and L10 were taken out of service for in-depth inspections. L8 and L10 had a higher TEV (capacitive) and HFCT (inductive) results of PD activity locally. During
433
Cigre, “Obtaining value from on-line substation condition monitoring”, Cigre Working Group B3.12, Technical Brochure 462, June 2013. L. Renforth, M. Seltzer-Grant, R. Mackinlay, D. Clark, R. Shuttleworth, “Experience from 15 yeard of on-line partial discharge (OLPD) testing of in-service MV and HV cables, switchgears, transformers and rotating machines”, HVPD & University of Manchester. Kawada, Yamagiwa & Endo “Predictive maintenance systems for substations” Hitachi Review Vol.40, No.2, 1991. Ravish P.Y. Mehairjan, Q. Zhuang, D. Djairam, J.J. Smit, “Upcoming Role of Condition Monitoring in Risk-Based Asset Management for the Power Sector”, World Congress on Engineering Asset Management (WCEAM) 2013, Hong Kong, Nov 2013. Malcolm Seltzer-Grant, Lee Renforth, Ross Mackinlay, “On-line partial discharge detection, location and monitoring on MV networks”, HVPD Ltd, Cigre/Cired Malaysia T&D Management workshop, Dec 2010. SebaKMT, “User Manual: Handheld on-line partial discharge (PD) surveying tool PDS Air”, Issue 1 (02/2012). Phase to Phase, “Netten voor distributie van elektriciteit” (in Dutch), Phase to Phase, Arnhem, 2011. Cigre, “Guidelines for unconventional partial discharge measurements”. Cigre Working Group D1.33, December 2010. B. F. Hampton, R. J. Meats, “Diagnostic measurements at UHF in gas insulated substations” IEE Proceedings, Vol. 135, No. 2, March 1988.