Experience with a Combined Approach to Attribute-Matching Across Heterogeneous Databases Chris Clifton +1-781-271-2390,
[email protected] Ed Housman +1-781-377-7204,
[email protected] Arnon Rosenthal +1-781-271-7577,
[email protected] The MITRE Corporation 202 Burlington Road, Bedford, MA, USA, Fax: +1-781-271-2352
Abstract Determining attribute correspondences is a difficult, time-consuming, knowledgeintensive part of database integration. We report on experiences with tools that identified candidate correspondences, as a step in a large scale effort to improve communication among Air Force systems. First, we describe a new method that was both simple and surprisingly successful: Data dictionary and catalog information were dumped to unformatted text; then off-the-shelf information retrieval software estimated string similarity, generated candidate matches, and provided the interface. The second method used a different set of clues, such as statistics on database populations, to compute separate similarity metrics (using neural network techniques). We report on substantial use of the first tool, and then report some limited initial experiments that examine the two techniques’ accuracy, consistency and complementarity. Keywords correspondence investigation, data mining
1 INTRODUCTION Perhaps the most basic problem in database integration is determining attribute correspondences: what attributes (e.g., columns in a relational table) in two databases reflect the same kind of real-world information. Relatively little information is available on the true scope, magnitude, and difficulty of the problem (one exception is c
IFIP 1997. Published by Chapman & Hall
2
Experience with Attribute-Matching Across Heterogeneous Databases
Premerlani and Blaha (1994)). The MITRE Corporation has been performing such a task for the U.S. Air Force over a period of several years. This paper reports on this analysis effort, and on two forms of automated support for this integration problem. The first tool used, Data Element Tool-Based Analysis (DELTA) (Benkley, Fandozzi, Housman and Woodhouse, 1995), is a methodology developed at MITRE that uses textual similarities between data element definitions to find candidate attribute correspondences. The second, SemInt (Li and Clifton, 1994), uses fields from the database schema along with statistics describing the data element values. Techniques that assume a well-documented environment seem inapplicable. Semantic descriptions are not actively used by running applications, so naturally developers give little emphasis to their quality and up-to-dateness. The task MITRE faced exhibited several of these problems. For example, in one system, many data dictionary entries simply paraphrased the attribute name; in another, the dictionary was inconsistent with the running database. We will begin with a description of the particular database integration problem that MITRE was asked to perform. We will then describe briefly the systems used to provide automated support to this task. The primary emphasis of the paper is on the pragmatics, the text-similarity technique (which appears to be new) and on the complementarity of the two techniques. The pragmatic questions include: What information was really available to support the search for correspondences? How much time did the effort consume? How much did automated support help? What skills were used, and for how long? How did we cope with limitations on access to domain experts? Our goal was to perform integration, not experiments, so many of the observations here are retrospective, or report very limited tests. Also, we needed to define ‘ground truth’ as correspondences confirmed by knowledgeable Air Force users; however, until the various systems have really shared data, it is difficult to be certain that the semantic matches were satisfactory. A prototype has been built that does demonstrate sharing using a subset of the correspondences identified in this work.
2 PROBLEM BACKGROUND This section describes the systems and metadata environments, and formulates the integration task. We then carve the task into pieces, scoping it to clarify the roles of the tools. In the future, it is hoped that information sharing will be driven by a conceptual schema, either a global schema (covering all information in the relevant systems) or an interchange schema (covering anticipated sharing, but requiring less capture of metadata). In addition, one eventually needs validated mappings from the conceptual schema to each of the systems involved. We will describe why correspondences are sought. First, we explain our operational definition of ‘correspondence’, and tell the kinds of correspondences that are sought. Later we describe the ‘ugly details’. Next, we define two categories of inte-
PROBLEM BACKGROUND
3
gration tasks, involving database schemas versus conceptual schemas unattached to any database.
2.1 The systems environment Dozens of application systems assist in planning and control of U. S. Air Force flight operations. They were developed as semi-independent islands of automation, by a variety of contractors, over decades. Many of the development teams no longer exist; others are quite remote, e.g., Korea. The situation has led to familiar problems – redundant data capture, inconsistency, and costly hand-crafted information-sharing software. Greater integration is obviously needed. Several data models play a role in Air Force data administration: relational, extended entity-relationship, and hierarchical. Most of the operational databases are relational. Conceptual schemas tend to be documented in IDEF1X, an entity-relationship model that includes inheritance but not methods. In addition, various electronic data interchange (EDI) formatted messages are used to interchange information among systems; we consider these to be hierarchical databases. Our experiment involved schemas that were relational or extended-ER.∗ Some correspondences have been identified between old systems, mostly for data that they already communicate. These correspondences had only been documented in the complex logic of programs that extract, convert, ship, and upload the data. Metadata for some databases was reasonably rich, but for others it was very sketchy. Metadata came at two levels of breadth. The schemas described attributes of tables. The data dictionaries described data elements, essentially attributes that could be reused within one or more tables. In an object or extended entity relationship model, the data element might have been an attribute of a supertype, to be inherited where it was needed. For confidentiality and operational reasons, we were not allowed to connect to live data to examine database populations. Specimen populations were available for some databases, but some tables were empty. We had access to source code of some of the programs used to transmit information to other databases. Below we list the databases used. For each, we tell specifically what information was available to the integration effort. Advanced Planning System (APS) The APS relational schema consisted of a total of 884 attributes in a total of 107 tables; the dictionary had entries for 739 data elements (44 data elements appeared as attributes in more than one table; one in as many as 14). A typical dictionary entry included one or two lines of descriptive prose. We also had the SQL data definition language (create table) statements, as well as access to a sample database copy. Computer Aided Force Management System (CAFMS) The CAFMS schema con∗ We
omitted the hierarchical message formats because they reflect information already in other systems. In any case, we have software that can convert them to relations, so a separate methodology is not needed.
4
Experience with Attribute-Matching Across Heterogeneous Databases
sisted of a total of 1056 attributes in 162 tables, with 637 distinct data elements. We did not have a data dictionary available for CAFMS; we had to work with only the SQL data definition language statements and access to a sample database. Wing Command and Control System (WCCS) The WCCS schema consisted of a total of 2578 attributes in 293 tables, with 1760 data elements. As with APS, we had both data dictionary (data element descriptions) and SQL data definition language, as well as one-time access to a sample database. Air Force Air Operations Data Model (AirOps) This is an in-progress global conceptual schema being built for air operations, a product of committees. Its initial version was created as an entity-relationship mapping of the ‘Air Tasking Order’ formatted message that currently carries much of the information exchanged among these systems. Additional attributes were suggested by known omissions from the Air Tasking Order (e.g., Date is implicit!) and by our integration process. None of the application systems implement the AirOps data model directly, so it has no population.
2.2 Integration scenarios in which correspondences were sought Our techniques apply to three different scenarios. Correspondence to conceptual schema: Find correspondences that tie an attribute in a proposed conceptual schema to an attribute in an implemented system. This ‘centralized’ approach minimizes the number of correspondences to be obtained, and is suitable for moderate-sized systems (where there is hope of agreeing on it). However, as a paper product whose attribute semantics are described in words, it is not really validated until data-sharing has occurred. Anecdotes (not just from the Air Force) report impassioned debates over the ‘right’ definition to be tied to a conceptual attribute, when actually there are separate concepts. In other cases, participants acquiesce too casually to vague or redundant definitions (e.g., there are now reputedly seven ‘standard’ elements for aircraft call signs.) Correspondences between implemented systems: Find correspondences between attributes in a pair of implemented systems. This can be a step toward establishing direct data transfers between that pair, or toward finding concepts that belong in an interchange schema. Intra-schema correspondences (among attributes in one schema): Finding such correspondences enables one to form clusters that may be treated as a single attribute, and may aid in converting relational schemas to objects. Our detection techniques also work in this case. For large-scale interoperability, the first scenario seems preferable due to the support provided for application development based on the conceptual schema. The second approach, however, is simpler. The dichotomy is not strict, since once a conceptual schema has been mapped to implemented systems, their definitions and pop-
TECHNIQUES
5
ulations can provide a virtual database conforming to that conceptual schema. We will report experiences with the first two tasks; the third task was carried out only casually, as part of attribute clustering in our neural net experiment. Several significant factors were excluded from our problem formulation, and were resolved in ad hoc manner. First, the schemas contained some structural mismatches (e.g., a distinct attribute in one table corresponding to instances in two or more tables, or two attributes in one table corresponding to one attribute in another. We had a problem with latitude and longitude being incorporated in a single field in some databases, and separated in others.) Second, in addition to attribute correspondences, it is sometimes possible to find mappings between entities. Third, while tables of attribute correspondences aid programmers in developing applications that interchange data, a real integrated data resource requires executable view definitions to and from the conceptual schema.
3 TECHNIQUES 3.1 Overview Our approach was driven partly by the available people and metadata, partly by task priorities. We were researchers expert in data integration and prototyping, but with incomplete knowledge of Air Force practices. We had occasional access to domain experts such as Air Force pilots and planners who were not software professionals; they might be in either operational settings or managing software acquisitions. Each application system had its own community of experts, dispersed geographically. Our goal was to provide a small set of selected correspondences for each attribute, for review by the domain experts. The purpose of our automated tools was to help us identify this set quickly, and to keep it small. In some cases, the choice among multiple options required domain knowledge that was not accessible in either metadata or data populations, and was left to the domain experts. In one case, we chose by reading the code of an existing transfer program.
3.2 What is a correspondence? Many sorts of attribute correspondences have been described in the literature. However, these taxonomies did not quite fit our needs. We need to focus on ‘what does the correspondence mean’ and ‘for what uses is the assertion sufficiently certain’. Hence, we consider two axes: certainty of the assertion (described in Section 3.1) and meaning of the asserted correspondence. Along the certainty axis, we used three categories: suggested initially (by an automated tool), selected (by the human integrator, who believes it enough to take it to the review committee), and accepted (by the review committee). For meaning, the literature provides some useful taxonomies, such as in Sheth
6
Experience with Attribute-Matching Across Heterogeneous Databases
and Kashyap (1992). However, only the ‘means the same’ category seemed directly relevant to our goal. (Categories like ‘is somehow related’ are used only within the identification process; they do not permit data values to be passed among systems, and were not shown to domain experts.) Both domain experts and integrators found it tricky to answer whether two attributes mean the same, or (worse) ‘do they refer to the same real world concept’.∗ We needed a more concrete formulation that would be more natural to administrators, and more immediately connected to data interchange. We therefore used a criterion that might be described as ‘usability’. We might actually ask a data administrator for one system: ‘If this other system sends you information about a mission, would it be reasonable to use their ‘Mission.StartTime’ to meet your system’s need for ‘Mission.TakeOffTime’? (The responder would be asked to ignore differences in representation (e.g., datatype, units). Two subtleties deserve mention. First, the basic usability question masks representation details, acting as if each value is an abstract semantic object (Goh, 1997). Second, we posit that it is appropriate to send this mission instance, i.e., that entity correspondence has been established. The phrasing masks this issue and just asks about attribute correspondences.
3.3 DELTA After a brief overview of the DELTA (Benkley et al., 1995) process, we discuss input, process, and detailed adaptations. The goal of the tools was to reduce the labor of generating the selected candidates. DELTA converts available metadata about an attribute into a simple text string, and presents that text as a ‘document’ to a commercial full-text information retrieval tool (Personal Librarian (Per, n.d.)). The documents describing each database’s attributes form a document base. The (human) integrator then sequences the tasks: selecting what attribute to investigate, and against which databases. (For a sketch of requirements for semiautomated task sequencing, see Rosenthal and Siegel (1991)). To find plausible matches within foreign database D for the reference database’s attribute A, the integrator creates a search pattern for A and issues it against the document base for D. The tool returns a ranked list of matches. The integrator examines the highest-ranked results, perhaps declaring some to be ‘selected’. If necessary, the integrator can use the results to create a new pattern for further investigation.
(a) Input information For each attribute, we construct a document from available documentation for that attribute. This information includes the attribute name, data type, and any available narrative description of the attribute. ∗ Indeed,
‘same concept’ is meaningful only if one has an agreed, exhaustively documented ontology. (For telecommunications integration, MCC researchers reported some success with Cyc in this role.)
TECHNIQUES
7
-APSDEFrecreq.requesting_agency Delivery address of requesting agency. CHAR 24 -END-WCCS93DELIVERY_ADDRESS TBD. -END-
CHAR 24
Figure 1 Sample data element records, ready for Personal Librarian.
Two examples are given in Figure 1. The first line contains the database (document base to Personal Librarian) name the element belongs to (e.g., -WCCS93-). The following lines contain the document text, terminated by an end tag (-END-). The attribute name should be in the first two lines, as these are what are presented in the ranked list summary of candidates (see the upper right corner of Figures 2 and 3.) In an ideal world, this information would all be contained in DBMS system catalogs or a standard metadata repository. In practice the data varied in format, quantity, and quality, but text is a very forgiving target format. The example in Figure 1 shows this: the textual description for the APS database is much more complete than for the WCCS database. Some individual work was required for each database, such as a script to translate the data dictionary into the proper format. Writing the scripts was relatively easy, requiring approximately one hour per system. As one specific data point, performing such a translation for one dictionary (of approximately 700 entries) took 30 minutes using editor macros.
(b) Process The basic method for finding an attribute in DELTA is to fashion a search pattern describing the desired attribute as a Personal Librarian query. The query returns documents ranked using a weighted similarity of the terms (See the upper right window in Figure 2.) This list is manually searched for corresponding attributes (the complete entry for any attribute can be displayed during this process, as shown in the upper left of Figure 2.) Note that there is no guarantee that a corresponding attribute will be in this list; at some point the user may want to ‘give up’. This decision is assisted by a similarity bar chart (directly beneath the ranked result list). At some point the similarities ‘flatten out’, which typically means that the remaining documents only match on a few common words in the search pattern. The tool is quite versatile in the type of queries supported. It will accept a natural language query, a string of disconnected phrases, a full boolean query, a few relevant words, or an entire document. The default search pattern is the full text of a metadata document in one of the databases. A user’s knowledge of the domain can be used
8
Experience with Attribute-Matching Across Heterogeneous Databases
Figure 2 Finding corresponding data element in WCCS from data element in APS.
to refine the query. Examples may include wild cards (e.g. elec*), or terms from documents in other databases. The tool’s heuristics estimate the similarity between a search pattern (e.g., a set of search terms) and contents of a document base, and return a ranked list of documents that it considers similar. The heuristics rely on natural language techniques (e.g., rare or repeated words are more important), and possess no special knowledge of terminology for relational databases or for Air Force operations. Note that the query searches are applied to all the words in a document. This allows finding matches even where the attribute names are very different but there are similarities in the definition, a common occurrence that has been reported elsewhere as well (Premerlani and Blaha, 1994). For example, searching for delivery address found the proper attribute from the APS and WCCS data dictionaries (shown in Figure 1), even though the attribute names were quite different (due to the presence of Delivery address in the narrative description in the APS data dictionary). Even the data type (e.g., CHAR24) in the query will help – especially if it is a rare type (due to the higher weighting of a match on rare terms). This describes the process of finding a single correspondence between metadata items in two different databases. To find all correspondences, it is useful to first group the items by subject, and attack the problem one subject at a time. This provides greater synergy between investigations of neighboring attributes (e.g. by refining a
TECHNIQUES
9
query using terms from a discovered correspondence), and facilitates incremental release and review of the results (since it is easier to assemble the subject-matter experts).∗ Note that control over the order of tasks is manual. This lets us prioritize, which is vital. It also lets us do a partial job. Some of the literature gives an impression that it is feasible to integrate entire schemas. In contrast, we have not heard of any successful efforts to integrate giant schemas. In our experience, work proceeds in much smaller chunks, driven by more immediate needs. For a description of the requirements for flexible ordering, and a sketch of how the work might be supported, see Rosenthal and Siegel (1991).
(c) Use of DELTA on this problem In the particular integration task discussed in Section 2, we generally found two types of information available: data dictionaries and table definitions. The data dictionaries give general definitions of the data elements, however the same entry in the dictionary (e.g. an aircraft identifier) could apply to multiple tables. To determine the proper table we had table descriptions taken from the data definition language for the databases (e.g. SQL create table statements). In addition to relating a data dictionary entry to a specific table, they are more likely to be current than the data dictionary entries. One could combine tables and data dictionary items into one document base, but we found it less confusing to keep them separate and use the tables to provide clues to the context of a data element. This led us to use a two-step process to generate candidate correspondences. We first generated a list of candidate corresponding data elements (as shown in Figure 2), and selected one (or a few) most likely candidates from the list. We then searched the tables containing that data element (as shown in Figure 3), to find the table containing the corresponding attribute.
3.4 SemInt SemInt is an automated system for determining candidate attribute correspondences. It was developed at Northwestern University, and is described in Li and Clifton (1994). It is particularly valuable when other techniques are ineffective because documentation and domain knowledge are lacking. For each attribute, SemInt derives 20 numeric properties from the metadata and population. Then, using machine learning techniques (specifically, a back-propagation neural network), it determines which properties are most useful for discriminating among attributes, and produces a classifier function. Requiring neither domain knowledge nor text analysis, it was intended to complement such methods. ∗ Of course,
any grouping into subjects is a matter of the grouper’s viewpoint, but any reasonable grouping helps. Example: Subjects might divide by nature of task (weapons, mission routing, ...), but logistics viewpoint includes part of the data from every line organization’s subject.
10
Experience with Attribute-Matching Across Heterogeneous Databases
Figure 3 Finding correct table for corresponding data element.
(a) Input SemInt uses evidence from both schemas and database population. The schema information used includes data types, length, keys, foreign keys,value and range constraints, and access restrictions. Population statistics for numeric data include average, maximum, variance; we have found that fields with different meaning but similar datatypes (e.g., Acct# and AcctBalance might both be Integer) often have very different statistics. For textual fields, we use statistics of string length (omitting padding characters); this is particularly effective at distinguishing coded values from natural text (e.g. personal names). We refer to each of these items as a discriminator. This gives a discriminator vector for each attribute, a small vector (≈ 100 bytes) that is easily manipulated. All the discriminators are numeric (nonlinearly normalized to values between 0 and 1), and most can be computed in one pass through the database, or through ¨ a sample from the database (Ozsoyoglu, Du, Tjahjana, Hou and Rowland, 1991; Rowe, 1983). The result is a ‘description’ of each attribute in the database. All of the discriminators can be computed automatically from a relational database. SemInt includes a parser that can connect to any Oracle database∗ and generate the ∗ Developing
parsers for other DBMS products is straightforward
TECHNIQUES
Reference
Schema Data contents
database
DBMS specific
Normalized characteristics and statistics
11 Training
Cluster
data
Train classifier
parser Trained network
Foreign
Schema Data contents
database
DBMS specific parser
Normalized characteristics and statistics
Classify attributes
Candidate correspondences and User similarity selects results
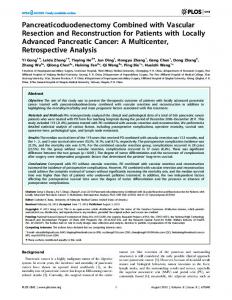
Figure 4 Semantic integration process in SemInt. discriminator vectors for all attributes in the database. The user needs to provide only a path to the database (e.g., database name, login information).
(b) Process An overview of the SemInt process is given in Figure 4. Integration using SemInt proceeds in two phases. The first phase trains a neural network to recognize attributes of one database based on their discriminator vectors (shown along the upper half of Figure 4.) The second phase uses this neural network to map attributes of another database onto attributes of the first (lower half of the figure). We will give a brief overview of this process; for more details see Scheuermann, Li and Clifton (1998) or Li and Clifton (1994). The first phase is shown along the upper half of Figure 4. One database is chosen as the reference database (We refer to the others as foreign databases.) We prefer this database to be familiar to the integrator, and to have good documentation; also, to compute good discriminators, we would like population information to be available. The discriminator vectors are computed, as described in Subsection a. The attributes are then clustered based on the similarity of their discriminator vectors. We desire that the clustering respect intra-schema correspondences. The clusters produced by this step give major clues about intra-schema correspondences and domain-sharing. This task is of interest in its own right. Such correspondences are also essential if one wishes to create an IS-A hierarchy from a relational schema (but naming conventions were not uniform). Clustering is done using a Self-Organizing Map (Kohonen, 1990), which groups attributes based on the Euclidean distance between their discriminator vectors. The key parameter is the distance threshold within which attributes are deemed to correspond (too high gives ‘false hits’: noncorresponding attributes grouped together; too low and it fails to capture intra-schema correspondences). This threshold is determined either by interaction with the user, or by behavior of a classifier-creation algorithm, as described in the next paragraph. For large numbers of attributes (as in our experiments), the next step’s training algorithm fails to converge with a low clustering threshold – it is too hard to produce a classifier with the required sensitivity. The lowest threshold at which classifier creation succeeded was in the region where false hits exceeded false negatives. We therefore detected and used that lowest threshold.
12
Experience with Attribute-Matching Across Heterogeneous Databases
PACKAGE.PKG_REF_POINT_NAME RECCE_REQUEST.RECREQ_REQUESTING_AGENCY REQUEST.REQ_OBJECTIVE AIRBASE.AB_AIRFIELD_NAME: 0.9617: RECDATA.DELIVERY_ADDRESS RECDATA_ORIG.DELIVERY_ADDRESS 0.9206: MSN_CONTROL.REPORT_POINT
Figure 5 Sample of SemInt output from mission planning comparison.
The actual classifier is a 3-layer neural network, trained using back-propagation (specifically, quick back-propagation (Fahlman, 1988).) The input nodes correspond to the 20 items in the discriminator vector, and each output node corresponds to a cluster as determined in the previous step. The classifier is trained to recognize the attributes in each cluster based on their discriminator vectors. Since the training data consists of the reference database discriminator vectors (input) and clusters (desired output), producing the classifier is a completely automated batch process (although it is CPU intensive, and may take hours to days of CPU time for databases with a large number of attributes). This produces a classification function that runs in milliseconds. Given an input discriminator vector, the classifier returns a similarity measure for each of the clusters (for a discriminator vector from the training set, it returns a value close to 1 for the cluster that the vector belongs to, and close to 0 for all other clusters). The second phase compares attributes of the foreign database(s) with those in the reference database. First one computes discriminators for the foreign attributes (an automated process, as described above for the reference database). The classifier is then applied to a discriminator vector, and returns a similarity metric between the vector and each cluster in the reference database. Repeating this for all attributes in the foreign database gives a list of similarities; the highly-ranked attributes for each cluster are the suggested correspondences for that cluster. A sample of SemInt output is given in Figure 5. The first line gives a category from the reference database (APS); the following lines give similar attributes from the foreign database (WCCS). Note that there are two attributes tied for the top position; these two actually had identical discriminator vectors. The final step is for the user to evaluate the suggested correspondences and prune the list to the selected ones. As with DELTA, the user reads textual documentation and can use all available information, not just the information used in discriminators.
4 RESULTS As mentioned before, we dealt with two different integration scenarios. One is to identify attributes in real databases that correspond to those in a conceptual schema. The other is given a database, to find corresponding attributes in another database. DELTA can be used to support both of these tasks; SemInt’s use of database statistics applies in the second. We will first report on the two problems, in turn.
RESULTS
13
Table 1 Rank of correct entry in conceptual schema integration test Search pattern
altitude elevation station mission identifier number msn station stn call sign callsign last time information value recce reconnaissance electronic combat station location elec*
Selected APS data element
Rank of correct result
Total above cutoff
MSN ID
1 8
1 9
STN CALL SIGN
3
16
RECREQ LAST TIME OF VALUE
1
2
STN LOCATION
1
1
STN ALTITUDE
4.1 Finding correspondences with a conceptual schema As a small test of how effective DELTA is in finding attributes given a concept, we searched in the ‘document set’ created from the APS data dictionary (which has 739 entries) for five randomly chosen mission planning attributes from the completed mission planning correlation shown in Table 3. We issued a query using a human generated search pattern (see Table 1 column 1), and recorded the rank of the correct data element in the returned list. We also recorded the number of elements above a subjective cutoff based on the similarity bar chart. For example, in Figure 2, 19 looks like an appropriate cutoff. Table 1 gives the query used and result of the data dictionary search in the APS document base for the five elements chosen. The next step, which we did not analyze in detail, would be to find which table contains the desired data, given the particular data element. Of these five elements, all but MSN ID appear in only one table (making this step trivial). MSN ID appeared in 14 of the 110 APS tables; half of these appear inappropriate, but manual investigation would be required to select the appropriate table. We do give an example of this twostep process in Section 4.2(a).
4.2 Finding correspondences in existing databases We tested both SemInt and DELTA as tools to find correspondences between existing databases. We started with the APS database, and looked for corresponding attributes in the CAFMS and WCCS databases. We will first report on experiences with DELTA, then SemInt. We will then discuss combining the two methods.
14
Experience with Attribute-Matching Across Heterogeneous Databases
Table 2 Rank of correct entry in test of DELTA wccs dictionary (1760 entries) rank count station altitude mission ID station callsign last time information of value station location
6 4 1 1 1
6 4 8 21 5
wccs table (293 tables) rank count 12 29 2 1 1
12 29 6 2 8
cafms table (162 tables) rank count 9 1 8 1 17
9 12 19 3 43
(a) DELTA We tested a fully automated search for suggested correspondences using the five data elements in Table 1. We used APS as the reference database, and generated suggested correspondences between APS and WCCS, and between APS and CAFMS. Specifically, instead of relying on human generated queries, we used the entire document describing the item in APS (i.e., the entry created from the APS data dictionary, as shown in Figure 1) as a search pattern to discover the corresponding attribute in WCCS and CAFMS. For WCCS, we had both data dictionary and table information. For this case, we used the two-step process described in Section 3.3(c). The results of each step are described below: 1. Search for the item in the document set from the WCCS data dictionary using the complete APS entry as the set of query terms. The rank of the correct (validated) result is shown in the first numeric column of Table 2. The total number of ranked items up to a subjective ‘cutoff’ based on the similarity bar chart, is given in the next column (count). 2. Search for the correct table in the document set constructed from the WCCS table create statements using the concatenation of the ‘correct’ (as noted above) WCCS data dictionary entry and the APS data dictionary entry as a search pattern (rank of the correct result given in column wccs table). We were not able to do this for the CAFMS integration, as we did not have the data dictionary available. In this case, we used the APS data dictionary entry as a query string on the document set constructed from the CAFMS table definitions (SQL DDL). The rankings, given in column cafms table, reflect the ranking of the correct table; manual searching would be needed to identify the correct attribute in the table. Note that because of this, more human ‘scanning time’ was needed, even if the rankings appear equivalent. Perhaps a more realistic measure would be to multiply the ranking of the correct table by the number of attributes in each table (average seven).
RESULTS
15
We selected the best attributes from the suggested candidates. Most were found quite easily, although there were several attributes where we selected multiple candidate correspondences. Manual investigation of these would be required (e.g., talking with database administrators, or in one case inspecting an existing program that transferred some data between two of the databases). The complete process took approximately 15 minutes per attribute. It is also worth noting that half of this experiment was performed by one of the authors who had no previous experience with DELTA, the ‘learning curve’ consisted of watching one of the other authors perform the first half of the experiment.
(b) SemInt SemInt was used to determine candidate correspondences after the completion of the integration using DELTA. Its utility can be evaluated in two ways: 1. How well did SemInt discover candidates (discussed here); and 2. How well did SemInt complement DELTA? (discussed in Section 4.3). Since SemInt can operate as a batch process, we ran it on the complete databases. Table 3 shows the results of SemInt on the mission planning subset of the databases (for which we have a ‘baseline’ for correct integration). The average of the number of candidate correspondences found for each attribute, along with the recall percentages (correspondences found divided by total correspondences identified), is given in Table 4. This shows, not surprisingly, that as precision decreases, recall increases. However, the recall is generally in the 20% range. This shows that SemInt would not be adequate as the sole integration technique, however due to the low human effort required it could be a useful adjunct to a technique such as DELTA. Data type and other representation differences greatly affected SemInt’s success. We found no correspondences involving items of completely different data types (e.g. char and date). In cases where two of the databases used a common data for an attribute, and the third used a different type, the correspondence between the two sharing a data type was often found. If attributes had been declared over semantic domains, e.g. date, that had default representations, then mining over such default representations would probably have been more successful. DOD standard 8320 defines 17 such semantic domains, but our documentation preceded enforcement of the standards. The average number of candidates varied depending on the databases, but was typically in the range of 20-50. This was primarily due to our inability to train a network based on a very tight clustering – generally if a match was found, it was found in the first two clusters, however the average cluster size was large (≈ 30). The results would probably improve if we had been able to produce classifiers that recognized each distinct vector as an independent cluster.∗ ∗ On
average there were two attributes that mapped to each distinct discriminator vector. This seems primarily due to attributes of empty tables producing identical vectors.
16
Experience with Attribute-Matching Across Heterogeneous Databases
Table 3 Correspondences determined by SemInt
APS reference 4 5 TASKUNIT FF_UNIT_ID PLANNED_MISSION AB_ICAO PLANNED_MISSION MSNDAT MSN_ID PLANNED_MISSION PKG_IDENTIFIER PLANNED_MISSION MSN_CALLSIGN PLANNED_MISSION MSN_CS_NUMBER PLANNED_MISSION MSN_NUMBER_OF_AIRCRAFT PLANNED_MISSION ACTYPE_AC_TYPE PLANNED_MISSION MSN_MISSION_TYPE PLANNED_MISSION MSN_ALERT_STATUS PLANNED_MISSION SCL_IDENTIFIER FIGHTER SCL_IDENTIFIER_SEC FIGHTER MSN_MODE1 PLANNED_MISSION MSN_MODE2 PLANNED_MISSION MSN_MODE3 PLANNED_MISSION MSNLOC MSN_ID PLANNED_MISSION MSN_TOT PLANNED_MISSION MSN_TFT PLANNED_MISSION STN_RPT_IN_POINT_NAME STATION STN_ALTITUDE STATION STN_FLIGHT_LEVEL STATION REQ_ID PLANNED_MISSION STN_RPT_IN_POINT_LAT, LONG STATION TGTLOC MSN_ID PLANNED_MISSION MSN_TOT PLANNED_MISSION MSN_TFT PLANNED_MISSION REQRECREQ_TARGET_NUMBER PLANNED_MISSION TARGET_TYPE RAAP_TARGET DMPI_LATITUDE RAAP_TARGET DMPI_LONGITUDE RAAP_TARGET CONTROL MSN_ID PLANNED_MISSION STN_TYPE_OF_CONTROL STATION STN_CALL_SIGN STATION STN_PRIMARY_FREQ_MGAHTZ STATION STN_SECONDARY_FREQ_MGAHTZ STATION STN_RPT_IN_POINT_NAME STATION FACINFO MSN_ID PLANNED_MISSION STN_CALL_SIGN STATION STN_PRIMARY_FREQ_MGAHTZ STATION STN_SECONDARY_FREQ_MGAHTZ STATION STN_RPT_IN_POINT_NAME STATION FF_UNIT_ID STATION ELECMBT MSN_ID STATION STN_CALL_SIGN STATION MSN_PRIORITY PLANNED_MISSION STN_LOCATION STATION STN_ALTITUDE STATION MSN_TOT PLANNED_MISSION MSN_TFT PLANNED_MISSION STN_PRIMARY_FREQ_MGAHTZ STATION STN_SECONDARY_FREQ_MGAHTZ STATION RECDATA MSN_ID RECCE REQ_ID RECCE_REQUEST RECREQ_PRIORITY_OF_COVERAGERECCE_REQUEST MSN_TOT PLANNED_MISSION RECREQ_LAST_TIME_OF_VALUE RECCE_REQUEST RECREQ_RECCE_MISSION_TYPE RECCE_REQUEST RECC_COVERAGE_TYPE RECCE RECC_IMAGE_TYPE RECCE RECC_IMAGE_QUALIFIER RECCE RECC_COVERAGE_MODE RECCE RECREQ_TARGET_CAT_EEI RECCE_REQUEST RECC_PRINT_SCALE RECCE RECREQ_REQUESTING_AGENCY RECCE_REQUEST REFUEL MSN_ID TANKER STN_CALL_SIGN STATION STN_CALL_SIGN STATION MSN_REQ_MISSION_FUEL PLANNED_MISSION STN_TACAN_CHANNEL STATION STN_LOCATION STATION STN_ALTITUDE STATION REND_RENDEZVOUS_TIME RENDEZVOUS TKR_TOTAL_OFF_SCHEDULED TANKER STN_PRIMARY_FREQ_MGAHTZ STATION STN_SECONDARY_FREQ_MGAHTZ STATION MSN_ID TARGET_NUM
FIGHTER RAAP_TARGET
CAFMS reference WCCS reference CAFMS WCCS
√
√ √ √ √ √
√
√
√
√ √
√ √
√
6 17 √
15 49
11 29 6 17 19 7 7 √ 4 4 4 17 17 17
26 67 5 49 20 10 10 13 13 13 49 49 49
11 26 6 7 6 7 4 5 19 √ 20 26 135 0 0 29 67 11 6 6 0 0 0 0
26 7 7 0 0 0 0
11 4 4 √ 29 29 4
26 13 3 67 67 5
11 4 √ 29 29 4 29
26 3 67 67 5 67
11 4 29 4 19 6 6 29 29
26 3 67 12 20 7 7 67 67
21 21 26 6 18 18 29 29 29 29 6 5 1
√ √
√ √
√
39 39 135 7 41 41 67 67 67 67 5 49 2
21 √ 4 4 5 5 4 19 6 2 29 29
39 3 3 49 49 12 20 7 4 67 67
11 0
√ √ √ √
11 1 2 APS TASKUNIT UNIT PLANS_MSN_TAB 4 BASE_ID PLANS_MSN_TAB √ 29 MSNDAT MSNNO PLANS_MSN_TAB 9 PKG PLANS_MSN_TAB 1 CALLSIGN PLANS_MSN_TAB 8 CS_NUM PLANS_MSN_TAB √ 16 NUM_AC_SCHD PLANS_MSN_TAB 1 ACTYPE PLANS_MSN_TAB 8 AMSN PLANS_MSN_TAB 6 ALERT PLANS_MSN_TAB √ 6 PRI_SCL PLANS_MSN_TAB √ 6 SCNDRY_SCL PLANS_MSN_TAB 6 √ 29 PRI_SIF PLANS_MSN_TAB √ 29 SCNDRY_SIF PLANS_MSN_TAB MSNLOC MSNNO PLANS_MSN_STATION_TAB 9 TOS PLANS_MSN_STATION_TAB 1 3 TFS PLANS_MSN_STATION_TAB 1 3 STATION_LOC PLANS_MSN_STATION_TAB 0 ALTITUDE PLANS_MSN_STATION_TAB 3 3 REQNO PLANS_MSN_STATION_TAB 2 6 TGTLOC MSNNO TGT_ACT_TAB 21 TOS PLANS_MSN_STATION_TAB 1 3 TFS PLANS_MSN_STATION_TAB 1 3 TGT_ID TGT_ACT_TAB 0 TGT_TYPE TGT_ACT_TAB 8 DMPI TGT_ACT_TAB 0 DMPI TGT_ACT_TAB 0 CONTROL MSNNO PLANS_CNTRL_TAB 12 CNTRL_TYPE PLANS_CNTRL_TAB 12 CNTRL_CALLSIGN PLANS_CNTRL_TAB 1 CNTRL_PRI_FREQ PLANS_CNTRL_TAB 0 CNTRL_SEC_FREQ PLANS_CNTRL_TAB 29 RPT_PNT PLANS_CNTRL_TAB 8 FACINFO MSNNO PLANS_FACINFO_TAB 12 FACINFO_CALLSIGN PLANS_FACINFO_TAB 0 FACINFO_PRI_FREQ PLANS_FACINFO_TAB 9 FACINFO_SEC_FREQ PLANS_FACINFO_TAB 29 RPT_PNT PLANS_FACINFO_TAB 1 SPRT_UNIT PLANS_FACINFO_TAB √ 28 ELECMBT MSNNO PLANS_ELECMBT_TAB 12 ELECMBT_CALLSIGN PLANS_ELECMBT_TAB 1 ELECMBT_PRY PLANS_ELECMBT_TAB 13 MSN_LOC PLANS_ELECMBT_TAB 0 ALTITUDE PLANS_ELECMBT_TAB 33 TOS PLANS_ELECMBT_TAB √ 2 6 TFS PLANS_ELECMBT_TAB √ 2 6 ELECMBT_PRI_FREQ PLANS_ELECMBT_TAB √ 2 8 ELECMBT_SEC_FREQ PLANS_ELECMBT_TAB √ 2 8 RECDATA MSNNO TGT_ACT_TAB 21 TGT_NUM TGT_ACT_TAB 19 PRY TGT_ACT_TAB 33 TOS PLANS_MSN_STATION_TAB 1 3 LTIOV TGT_ACT_TAB 0 REC_MSN_TYPE TGT_ACT_TAB 6 8 TYPE_RECON_COVERA TGT_ACT_TAB IMAGE_TYPE TGT_ACT_TAB √ 16 IMAGE_QUAL TGT_ACT_TAB 6 COVER_MODE TGT_ACT_TAB √ 16 REC_TGT_CODE TGT_ACT_TAB 3 SCALE_OF_PRINTS TGT_ACT_TAB 8 DEL_ADD TGT_ACT_TAB 6 REFUEL CALLSIGN PLANS_MSN_TAB 8 CS_NUM PLANS_MSN_TAB 16 RFL_MSNNO PLANS_MSN_RFL_TAB 9 ALTITUDE PLANS_MSN_STATION_TAB 3 3 ARCT PLANS_MSN_RFL_TAB 0 FUREQ PLANS_MSN_RFL_TAB 5 PRI_TKR_FREQ PLANS_MSN_TAB 29 SCNDRY_TKR_FREQ PLANS_MSN_TAB 29
WCCS
√
√ √ √
√ √
√
√
√
√ √
√
√
√ √
√ √
√
24 TASKUNIT 4 TASK_UNIT 5 6 DEPARTURE_BASE_ICAO MSNDAT 9 MSN_NBR 4 PKG_ID 4 CALL_SIGN 2 8 CALL_SIGN 4 NBR_AC 1 0 ACFT_MDS 7 MSN_TYPE 7 ALERT_STATUS 7 PRI_CONFIG_CODE 7 SEC_CONFIG_CODE IFF_SIF_CODE 5 6 IFF_SIF_CODE 5 6 IFF_SIF_CODE MSNLOC 9 MSN_NBR 6 6 MSTART 6 6 MSTOP 1 LOC_NAME 4 9 ALT 2 4 REQ_NBR TGTLOC 4 7 MSN_NBR 6 6 TIME_ON_TARGET 6 6 TIME_OFF_TARGET 2 TARGET_ID 1 0 TARGET_TYPE 2 DMPI 2 DMPI CONTROL 3 8 MSN_NBR 3 8 CONTROL_TYPE 0 CALL_SIGN 9 PRI_FREQ 5 6 SEC_FREQ 1 7 REPORT_POINT FACINFO 3 8 MSN_NBR 2 CALL_SIGN 9 PRI_FREQ 5 6 SEC_FREQ 3 REPORT_POINT 5 3 ELECMBT 3 8 MSN_NBR 0 CALL_SIGN 3 0 PRIORITY 6 LOCATION 4 9 ALT 2 4 TIME_ON_STATION 2 4 TIME_OFF_STATION 5 3 PRI_FREQ 5 3 SEC_FREQ RECDATA 4 7 MSN_NBR 3 1 REQ_NBR 4 9 PRY 6 6 TIME_ON_TARGET 2 LTIOV 7 MSN_TYPE 1 0 COVERAGE_TYPE 2 8 IMAGERY_TYPE 7 IMQ 2 8 CM 1 TGTCOD 1 0 PRINT_SCALE 2 DELIVERY_ADDRESS REFUEL MSN_NBR 4 TNKR_CALL_SIGN 2 8 TNKR_CALL_SIGN 9 TNKR_ID ARCP 4 9 ALT 1 6 ARCT 1 6 TOTAL_OFFLOAD_FUEL 5 6 PRI_FREQ 5 6 SEC_FREQ
2 5 APS MSNDAT_ORIG FLIGHT √
5 28
√ √ √
32 29 12 12 35 29 29 28 29 148 8 8 8
MSNDAT_ORIG 20 MSNDAT_ORIG 46 MSNDAT_ORIG √ 23 MSNDAT_ORIG 23 37 MSNDAT_ORIG √ MSNDAT_ORIG √ 46 MSNDAT_ORIG √ 46 MSNDAT_ORIG 47 MSNDAT_ORIG √ 46 MSNDAT_ORIG 137 MSN_IFF_SIF_CODE 6 MSN_IFF_SIF_CODE 6 MSN_IFF_SIF_CODE 6 MSNLOC_ORIG MSNLOC_ORIG MSNLOC_ORIG MSNLOC_ORIG MSNLOC_ORIG
√
CAFMS
0 47 √
√ √ √ √
47 10 10 √ 15 37 √
28 10 10 9 35
MSNLOC_ORIG
137
TGTLOC_ORIG TGTLOC_ORIG TGTLOC_ORIG TGTLOC_ORIG TGTLOC_ORIG TGTLOC_ORIG TGTLOC_ORIG
20 10 10 14 10 2 2
√ √ √
32 10 10 13 13 3 3
MSN_CONTROL MSN_CONTROL MSN_CONTROL MSN_CONTROL MSN_CONTROL MSN_CONTROL
20 √ 47 23 46 47 √ 16
32 28 12 29 28 18
MSN_CONTROL MSN_CONTROL MSN_CONTROL MSN_CONTROL MSN_CONTROL
20 √ 23 46 47 √ 16 √
32 12 29 28 18
√
32 18 148 12 84 10 10 148 148
ELECMBT_SUP 20 ELECMBT_SUP 28 ELECMBT_SUP 137 ELECMBT_SUP 23 ELECMBT_SUP √ 1 0 0 ELECMBT_SUP 10 ELECMBT_SUP 10 ELECMBT_SUP √ 1 3 7 ELECMBT_SUP √ 1 3 7 RECDATA_ORIG RECDATA_ORIG RECDATA_ORIG RECDATA_ORIG RECDATA_ORIG RECDATA_ORIG RECDATA_ORIG RECDATA_ORIG RECDATA_ORIG RECDATA_ORIG RECDATA_ORIG RECDATA_ORIG RECDATA_ORIG
√ √ √ √
47 10 37 3 3 47 46 137 137 137 47 137 16
MSN_REFUEL MSN_REFUEL MSN_REFUEL MSN_REFUEL
√
MSN_REFUEL MSN_REFUEL MSN_REFUEL MSN_REFUEL MSN_REFUEL MSN_REFUEL
√ 28 √ 100 0 100 47 47
148
√ √
√
√ √
√
√ √ √
20 28 28 47
28 13 35 5 5 28 29 148 148 148 28 148 18 32 18 18 28
√ √ √ √
18 84 4 84 28 28
0 0
The numbers after each attribute indicate √ the count of candidates found for the attribute in each of the other databases, a indicates one of these was correct. Note that we did this in three ways, using each of the databases as the reference database (the first set, under APS, corresponds to the experiment performed in Section 4.2(a).
RESULTS
17
Table 4 Summary of correspondences determined by SemInt APS as reference database Candidates in CAFMS Candidates in WCCS Avg. candidates % Recall Avg. candidates % Recall 13 18 31 19 CAFMS as reference database Candidates in APS Candidates in WCCS Avg. candidates % Recall Avg. candidates % Recall 13 19 26 26 WCCS as reference database Candidates in APS Candidates in CAFMS Avg. candidates % Recall Avg. candidates % Recall 43 24 39 44
4.3 Combining results We now examine the complementarity of the two techniques. A key question is how to integrate these methods. One idea would be to use SemInt as a component in the information retrieval: candidates found using SemInt would be displayed along with candidates found using information retrieval, and the similarity measure of SemInt would be used as a component in the ranking. To test the possibility of combining the results in this way, we directly compared the rankings from DELTA and SemInt on the items in Table 2. Comparative relative rankings are shown in Tables 5 and 6. Table 5 gives cases where the same data element was found by both SemInt and DELTA in the first and second columns; the second and third show the table correspondences for the tables containing the corresponding data element. In Table 6; the last column notes cases where SemInt suggested the corresponding data element, but in the wrong table. Multiple entries in column 2 note multiple attributes suggested by SemInt in the given table (a repeated number indicates a tie). Given the two-stage nature used with DELTA on the WCCS integration (first find the corresponding data element definition, then find the correct table containing that data element), and the ‘table only’ CAFMS integration using DELTA, we have three cases where we may investigate combining results to aid the correspondence identification process: 1. Finding the correct dictionary entry; 2. Finding the correct table given only tables containing the item found in the data dictionary; and 3. Finding the correct table and item when no data dictionary is available.
18
Experience with Attribute-Matching Across Heterogeneous Databases
Table 5 Relative rankings for the five data elements in Section 4.2(a) where DELTA and SemInt both suggest correspondences: APS/WCCS Selected correspondence boldfaced. Station altitude DELTA Data Element Rank SemInt Rank 17 1 6 10 7 18 15 12
DELTA Table Rank 12 11 1
Mission ID (no joint suggestions) Station callsign DELTA Data Element Rank SemInt Rank 1 2
DELTA Table Rank 1
Last time information of value DELTA Data Element Rank SemInt Rank DELTA Table Rank 9 19 Station location DELTA Data Element Rank SemInt Rank 2 5
DELTA Table Rank
In case 1, if we were to start with items found by both methods (ranked using the average of the rankings), then moving to the items returned using DELTA, we would improve our average rank from 2.6 to 2. Using the same combination technique in case 2 would improve the average from 9 to 7.2 (due to improving the rank of the correct table for station altitude to 3rd from 12th.) Case 3 is a bit more difficult, as the ranks given for DELTA are for finding the correct table, which may contain many items. However, if we just concentrate on pointing to the correct table we would do worse using the same combination technique (7.8 average rank of correct table, vs. 7.2 for DELTA alone). However, a more sophisticated combination may help: Using SemInt to highlight candidates in the table would point out station altitude, and in the other cases (where SemInt found incorrect matches, the names often clearly distinguished these as different values).
5 CONCLUSIONS We first discuss detailed observations about this experience. We then identify general areas where further research is needed, or where general conclusions can be drawn.
CONCLUSIONS
19
Table 6 Relative rankings where DELTA and SemInt both suggest correspondences: APS/CAFMS Selected correspondence boldfaced. Station altitude DELTA Table Rank SemInt Rank 6 8 7 8 12 14 15 12,15,19 2 10 2 16 9 17 1 11 1 13 16 7 19 3,3,3
(also altitude)
(also altitude)
Mission ID (no joint suggestions) Station callsign (no joint suggestions) Last time information of value DELTA Table Rank SemInt Rank 19 13,11,5,18,7 11 7,13 4 13 9 3 Station location DELTA Table Rank SemInt Rank 1 6 6 1 8 1 4 1,4
20
Experience with Attribute-Matching Across Heterogeneous Databases
5.1 Discussion We will now discuss successes, failures, and provide general comments on the techniques used and the specific integration task we faced. In Section 5.2 we provide more general lessons learned and suggestions for future work. As discussed before, the notion of corresponding attribute is somewhat flexible. We worked with respect to a rather tight standard: two-way transferability between databases. As an example, for some applications we might want to combine all missions using MISSION ID as a key; in such an application all occurrences of MISSION ID would correspond. However, we discriminated between uses: if the reference database and foreign database both had separate attributes for MISSION ID for refueling and reconnaissance missions, we would only select the closest correspondence (refueling to refueling and reconnaissance to reconnaissance). The test in the preceding section evaluated the tools with respect to this standard; suggested correspondences that would be selected for many applications were recorded as ‘false hits’. The methods were intended to capture correspondences at a variety of levels (to provide support for various types of integration efforts), so this strict evaluation criteria perhaps unfairly lowers the precision of the methods. A complete list of correspondences for mission planning is shown in Table 3. The correspondences in Table 3 were originally developed using the DELTA process, and no metrics were gathered during this to evaluate the process. We have some experiences, such as one analyst correlating 200 data elements in a week, that point to the efficacy of this method. This ‘200 in a week’ figure corresponds well to the 15 minutes per attribute figure from the tests in Section 4.2(a). These results were used to produce a prototype application for transmitting information from one database to another. Header information from the application was generated automatically from the table. This prototype was successful; in demonstrations the results were believed. The databases were realistic in their lack of good documentation. But we were aided by the fact that they came from one culture, the U.S. Air Force. If the effort had included British RAF or the U.S. Navy, terminology and even the units of conceptualization might have had greater differences. But even in the U.S. Air Force, different size unit (theater level versus pilot level) or different functions (intelligence, operations, logistics) tended to vary rather radically. Had it been necessary to integrate with non-English databases, DELTA probably would have done much worse; SemInt might be more robust in such cases. One advantage of both techniques is the ability to discriminate between attribute name homonyms, and to detect attribute name synonyms. With SemInt, this is obvious, as the attribute names are not used to determine similarity. DELTA does use attribute names, however the use of additional documentation provides redundancy. For example, the APS attribute RECREQ REQUESTING AGENCY (near the bottom of Table 3) seems to have nothing in common with he corresponding attributes DEL ADD and DELIVERY ADDRESS. However, the data element description for RECREQ REQUESTING AGENCY included the words “delivery address”. This redundancy enabled DELTA to find the appropriate attributes. As another check, they
CONCLUSIONS
21
all have the same data type (char 24), giving additional matching words to use in DELTA’s ranking (and assisting SemInt in finding the match). Use of an information retrieval system in DELTA gives a number of practical advantages.
• •
• •
Personal Librarian interprets a multi-word query as a string of independent search words. It then fashions a weighted parallel query using information about how often each word occurs in the entire document base. All words are ‘stemmed’, that is the search word ‘bomber’ would also find ‘bombing’ (and of course ‘bomb’). Rankings use rather sophisticated techniques. It is routine in the information retrieval community for similarity measures to include factors like a word’s rarity (greater value for matching an uncommon word), detection of synonymous concepts, and a word’s apparent importance in a document (based on position and number of appearances). In some tools, the weight given to each factor may be customizable, to suit the needs of attribute matching. Considerable support for manual analysis of the results is provided. For example, matching entries can be displayed side by side for comparison, or viewed as a list of summaries (as shown in Figure 2). If it is necessary to refine the pattern, the user can employ boolean operators, fuzzy matches, concept-based querying, etc. Lists of synonyms can be supplied (either from general knowledge of the domain, or to use terms suggested by corresponding attributes in other databases)
This is the largest realistic test of SemInt to date for which we have even a partially reliable baseline for the results. SemInt tends to fare better with smaller databases. The databases in this example posed difficulties for the neural network training algorithms. This required clustering large numbers of similar attribute discriminator vectors together. The result was that SemInt was searching for attributes similar to the average of a group, rather than similar to the specific attribute in question. Better training algorithms could improve this; this is one area for future work. Combining these methods is likely to have the most impact in cases where the databases have little or no textual documentation (other than what can be automatically extracted from the database, i.e., the data definition language). Personal or departmental databases are one example where minimal textual documentation is likely. The owner of a small database who wished to find similar information in an enterprise database would benefit from a combined technique. SemInt would use automatically extracted information to generate an initial candidate list; the user could then apply knowledge of the personal database and use DELTA to refine the search in the textual descriptions associated with the (hopefully better documented) enterprise database. One concern is the amount of time required to prepare data for the automated tools. For each of SemInt and DELTA, some time (up to a few hours of programmer and running time) was required. This was quite tolerable for us, indeed, small compared to many other tasks. However, it would be unacceptable for information
22
Experience with Attribute-Matching Across Heterogeneous Databases
discovery over the Web, or for an organization where the DBAs had business rather than programming skills. Having a standard format for metadata would ease this task considerably. Large relational systems already include fields in their database catalogs designed to store all of the information describe in this paper. In both cases, this time was overshadowed by the effort required to get access to the desired information. This typically ran to several hours of ‘human time’ making phone calls and writing letters, and several weeks of ‘wait time’. As a result, the technical concerns of data collection and transformation (and even correspondence discovery) are relatively unimportant; although this may change as networked accessibility of databases improves. However, without the automated tools finding the correlations is the most significant factor. Premerlani and Blaha (1994) reported four hours per data element for integration. Experiences in the domain of military planning databases, such as those represented here, are comparable: Discussions have suggested times on the order of a day per data element. The methods presented here reduce this substantially; generating a list of candidate correspondences for a given attribute took only seconds (after the preparation given above). Using DELTA, the evaluation of these correspondences took on the order of 15 minutes per match.
5.2 Additional observations
•
•
• •
When should we say two attributes correspond? We needed a criterion that could be applied by Air Force personnel. ‘Are they the same real world concept’ confused both domain experts and integrators.∗ Questions like ‘Could TakeOffTime value from APS’s Mission be used as MissionStartTime for MSN table in WCCS’ seemed clearer, and more immediately connected to the purpose – data interchange. Clarifying connections between relational attributes and data dictionary entries. We felt unclear on whether an attribute’s meaning defines its role globally, or with respect to the entity? Recon.MSN ID and Transport.MSN ID both identify their enclosing mission; does that make them the same? The usage in various dictionaries seemed inconsistent. Correspondence-identification techniques are valuable for identifying intraschema as well as inter-schema correspondences. A major application is in creation of subtype hierarchies, even where attribute names and perhaps datatypes do not match. It is best to resolve intra-schema correspondences first, so as to pull attributes up in inheritance hierarchies. Our relational schemas included separate tables for various flavors of Mission. This greatly increased the number of attribute pairs to be compared.
∗ Indeed,
it is meaningful only after development of an agreed, exhaustively documented ontology. (For communications work, MCC researchers reported some success with Cyc in this role.)
BIOGRAPHY
23
REFERENCES Benkley, S. S., Fandozzi, J. F., Housman, E. M. and Woodhouse, G. M. (1995) Data element tool-based analysis (DELTA), Technical Report MTR 95B0000147, The MITRE Corporation, Bedford, MA. Fahlman, S. (1988) Fast-learning variations on back-propagation: An empirical study, in Proceedings of the 1988 Connectionist Models Summer School, pp. 38–51. Goh, C. H. (1997) Representing and Reasoning about Semantic Conflicts in Heterogenous Information Systems, PhD thesis, Massachusetts Institute of Technology. Kohonen, T. (1990) The self organizing map. IEEE Transactions on Computers 78(9): 1464–1480. Li, W.-S. and Clifton, C. (1994) Semantic integration in heterogeneous databases using neural networks, in Proceedings of the 20th International Conference on Very Large Data Bases, VLDB, Santiago, Chile, pp. 1–12. ¨ Ozsoyoglu, G., Du, K., Tjahjana, A., Hou, W.-C. and Rowland, D. (1991) On estimating COUNT, SUM, and AVERAGE relational algebra queries, in Proceedings of the 2nd International Conference on Database and Expert Systems Applications, IEEE. Per (n.d.) Personal librarian 4.15. URL: http://www.pls.com/products/pl/ Premerlani, W. J. and Blaha, M. R. (1994) An approach for reverse engineering of relational databases. Communications of the ACM 37(5): 42–49. Rosenthal, A. and Siegel, M. (1991) Toward flexible, extensible tools for metadata integration, in Workshop on Information Technology Systems. Rowe, N. (1983) An expert system for statistical estimates on databases, in Proceedings of AAAI. Scheuermann, P., Li, W.-S. and Clifton, C. (1998) Multidatabase query processing with uncertainty in global keys and attribute values. Journal of the American Society for Information Science 49(3). Sheth, A. and Kashyap, V. (1992) So far (schematically) yet so near (semantically), in Proceedings of the IFIP TC2/WG2.6 Conference on Semantics of Interoperable Database Systems, Victoria, Australia.
6 BIOGRAPHY Chris Clifton is a Lead Scientist in the National Intelligence Division of The MITRE Corporation. His research interests include heterogeneous database, data mining, and database support for text. Before coming to MITRE, he was an Assistant Professor in the Department of Electrical Engineering and Computer Science at Northwestern University. Chris has a Ph.D. from Princeton University, and Bachelor’s and Master’s degrees from the Massachusetts Institute of Technology. He can be reached at The MITRE Corporation M/S K308, 202 Burlington Road, Bedford, MA 01730-1420, or by email at
[email protected].
24
Experience with Attribute-Matching Across Heterogeneous Databases
Arnon Rosenthal has done database research in numerous areas. Recent work at the MITRE Corporation has focused on data administration, mediation, distributed object management, migration of legacy systems, and database security. During previous employment at Xerox, Computer Corporation of America, ETH Zurich, Sperry Research, and on the faculty of the University of Michigan, his interests included database design systems, active databases, query processing, discrete algorithms, and computational complexity. He holds a Ph.D. from the University of California, Berkeley. Ed Housman is a Senior Information Systems Engineer in the Defense Information Infrastructure Group of The MITRE Corporation. His research interests include information retrieval, data element correlation, data mining, and data interoperability. Before coming to MITRE, he was manager of information retrieval research at GTE Laboratories, Inc., Waltham, Mass. He has a Master’s Degree from Columbia University.