Experience with Building a Commodity Intel-Based ccNUMA System B. Brock, G. Carpenter, E. Chiprout, M. Dean, P. De Backer, E. Elnozahy, H. Franke, M. Giampapa, D. Glasco, J. Peterson, R. Rajamony, R. Ravindran, F. Rawson, R. Rockhold, J. Rubio 1
IBM Austin Research Laboratory 11501 Burnet Road Austin, TX 78758 Contact Information:
[email protected] Abstract Commercial Cache-Coherent Non-Uniform Memory Access (ccNUMA) systems often require extensive investments in hardware design and operating system support. A different approach to building these systems is to use Standard High Volume (SHV) hardware and stock software components as building blocks and assemble them together with minimal investments in hardware and software. This design approach trades the performance advantages of specialized hardware design for simplicity and implementation speed., and relies on application-level tuning for scalability and performance. We present our experience with this approach in this article. We built a 16-way ccNUMA Intel system consisting of four commodity 4-processor Fujitsu Teamserver SMPs connected by a Synfinity™ cache-coherent switch. The system features a total of sixteen 350MHz Intel Xeon™ processors and 4GBytes of physical memory, and runs the shrink-wrapped Microsoft Windows NT operating system. The system can be partitioned statically or dynamically, and uses an innovative, combined hardware/software approach to support application-level performance tuning. On the hardware side, a programmable performance monitor card measures the frequency of remote memory accesses, which constitute the predominant source of performance overhead. The monitor does not cause any performance overhead and can be deployed in production mode, providing the possibility for dynamic performance tuning if an application's workload changes over time. On the software side, the Resource Set abstraction allows application-level threads to improve performance and scalability by specifying their execution and memory affinity across the ccNUMA system. Results from a performance evaluation study confirm the success of the combined hardware/software approach for performance tuning in compute-intensive workloads. The results also show that the poor local memory bandwidth in commodity Intel-based systems, rather than the latency of remote memory access, is often the contributor to poor scalability and performance. The contributions of this work can be summarized as follows: Ÿ
The Resource Set abstraction which allows control over resource allocation in a portable manner across ccNUMA architectures, and how it was implemented without modifying the operating system.
Ÿ
An innovative hardware design for a programmable performance monitor board that is designed specifically for a ccNUMA environment and allows dynamic, adaptive performance optimizations.
1
All authors were with IBM during their participation in the project. D. Glasco and E. Chiprout are now with Intel, R. Rockhold has retired, and J. Rubio is with the University of Texas at Austin.
Ÿ
A performance study showing that performance and scalability are often limited by the local memory bandwidth rather than by the effects of remote memory access in an Intel-based architecture.
1. Introduction There is an increasing need for powerful servers to meet the processing demands of modern transaction processing systems and Internet data providers. Several technologies are available to meet these demands, the most popular of which are clusters and Symmetric Multiprocessor Machines (SMP) [1]. Clusters are in widespread use due to their cost, reliability and scalability advantages, but they also require substantial overhead in system management and maintenance. In contrast, SMP systems, offer better performance, a simple programming model, and a single system image which simplifies system management and maintenance. However, SMP’s, cannot scale beyond a limited number of processors due to technology limitations . Both cluster and SMP technologies are now entrenched in the mainstream of computing, with commercial pressures emphasizing commodity, off-the-shelf processors and components. In particular, symmetric-multiprocessor systems (SMP) that use Intel’s x86 processors and run Windows NT [2] are in increasing favor due to their low cost, application software availability, and success in the personal computer and workstation markets. Cache-Coherent Non-Uniform Memory Access (ccNUMA) systems are a third approach that overcome the scalability limits of SMP systems while still providing a single system image which simplifies management and maintenance [3]. A typical design in such systems uses several SMPs as computing nodes and connects them with a cache-coherent switch that supports shared memory across all processors. Special care is necessary to tune the hardware system for optimal performance. Several commercial systems use this technology [4, 5, 6, 7, 8, 9]. There are many advantages to ccNUMA systems, including scalability, ease of management, and workload consolidation leading to reduced maintenance costs. ccNUMA systems also offer the option of partitioning the machine for failure containment, workload isolation, and management. However, ccNUMA systems pose several performance challenges due to the non-uniform memory access times. Inter-node memory accesses occur when a processor on one computing node requests a cache line that resides on a different node. Such memory transactions span two memory busses and a switch, unlike the case of an SMP where all accesses occur over a single shared bus taking the same time to
complete. Cache hierarchies can reduce the impact on performance by keeping the data close to the processors which use them. Commercial ccNUMA systems typically deploy a “remote” cache in each computing node, containing the recent references made by the processors in a node to memory banks in others. Caching techniques can reduce the performance impact on ccNUMA systems only up to a point. There are situations where an application may be simultaneously writing to two independent regions within a cache line. Such false sharing within a cache line causes the coherence mechanism to move it back and forth between different computing nodes. Additionally, some workloads can exhaust the capacity of the caches and the directory tables that manage coherence. Solving these performance problems is not trivial, and requires substantial investment in hardware and operating system tuning. This article describes our experience with an alternative approach that simplifies the design and improves implementation turnaround time. It uses commodity hardware and software components as building blocks with minimal additional investments in hardware and software. To mitigate the performance problems, our approach relies on application-level tuning. This article describes the design and evaluation of a system built using this approach. We used a cache-coherent interconnect to connect four 4-processor SMP nodes [9]. Each node contains four 350MHz Intel Xeon™ processors and 1GByte of main memory. The resulting system is a 16-way machine that supports shared memory across all processors and aggregates the nodes’ memories into a single system image of 4 GBytes. Our design builds on top of the individual node design, which includes an additional “processor slot” in the memory bus for hosting a Mesh Coherence Unit (MCU). The MCU module supports memory coherence across a switch. The nodes’ design thus allows extension and scalability, but without any system-level tuning. In particular, it is not possible to add a remote cache or extend the cache hierarchy beyond what is available at the processor level. Also, some arcane instructions that access data across cache lines are not supported. We relied on tuning the application software to overcome these problems. Toward this goal, we have implemented a programmable performance monitor card to assist programmers in understanding application behavior in the ccNUMA platform. The monitor2 tracks only remote accesses to application-specified regions of main memory. This 2
The card name is Opium, an acronym based on Olifant, the internal code name for the project. It is unrelated to recreational
allows the programmer to detect access patterns that cause performance problems. It does not impose any overhead in performance, and is different from traditional analysis tools based on tracing. While the monitor allows sophisticated dynamic performance adaptation, we have not exploited that feature in this article. We ported three operating systems to the prototype: Microsoft’s Windows NT 4.0, SCO’s Unixware 7.0, and Linux. We focus in this paper on the Windows port. This work was challenging because we had to work around the scalability limitations of Windows NT without having access to its source code. We used the device driver model for kernel extensions that NT supports, and added several abstractions at the application-level to overcome the performance limits of the system. We also extended the Basic Input Output System (BIOS) and NT’s Hardware Abstraction Layer (HAL) to present the operating system with a single system image. These extensions do not require any modifications to the NT source code, and allow Windows NT to treat the system as a single 16-way SMP. The second major component of our enhancement is an implementation of a Resource Set abstraction (RSet), which allows application programs to control resource allocation to improve performance. The current implementation of RSets consists of a collection of Application Program Interfaces (APIs), Dynamic Link Libraries (DLLs), and a kernel-mode device driver that allows applications to control where memory is allocated. We used RSets to tune a suite of six parallel programs, and studied the scalability of the applications under different system configurations. Our results also suggest that the poor local memory bandwidth of the current generation of Intel-based SMPs often has more of a detrimental effect on performance than the latency of accessing remote memory across the interconnect. This result is somewhat surprising since one would expect the latency of the NUMA interconnect to be the major source of overhead in a ccNUMA system. The paper outline is as follows: Sections 2 through 4 describe the basic implementation effort including hardware, performance monitor, operating system support, and the Resource Set abstraction. Section 5 describes the support for partitioning, and Section 6 presents the performance evaluation. The paper concludes with a discussion of related work in Section 7, and concluding remarks in Section 8.
drugs.
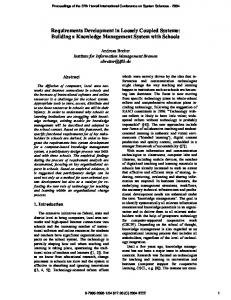
2. Basic Hardware Overview 2.1. Basic Hardware Description We used a Synfinity™ interconnect switch [9] to connect four Pentium II-based, Fujitsu teamserver SMP nodes, resulting in a 16-way ccNUMA system. Each node contains four 350 MHz Intel Xeon™ processors, each with a 1 MB L2 cache, 1 GByte of RAM, a standard set of I/O peripherals, and a Mesh Coherence Unit (MCU). The MCU provides coherent access to the memory and I/O devices that exist on other nodes. We designed a hardware card to attach the MCU to the Synfinity™ switch, which connects the four nodes together to form the 16-processor system. We configured the switch to provide a bandwidth of 720 MB per second per link per direction in the prototype. The original Fujitsu configuration supports a 2-node ccNUMA system, wherein the MCUs of the two nodes are directly connected to each other. The MCU in each node snoops the node's local memory bus and uses a directory-based cache coherence protocol to extend memory coherence across nodes. The MCUs exchange point-to-point messages over the
P
P
Mem Node 0
P
P
MCU Opium
P
P
Mem Node 1
P
P
MCU Opium
P
P
Mem Node 2
P
P
MCU Opium
P
P
Mem Node 3
P
P
MCU Opium
Synfinity Switch Figure 1. Hardware diagram for the ccNUMA system. switch to access remote memory and to maintain cache coherence over the entire system. The MCU defines a 4-node memory map that effectively partitions a standard 4 GByte physical address space into 4 areas of 1 GByte each, one for each of the nodes in a 4-node system. In addition to memory, memory-mapped I/O and I/O port addresses are also remapped to be accessible globally from any processor in the system. Figure 1 shows a descriptive diagram of the hardware architecture. 2.2. The Opium Performance Monitor Card 2.2.1. Description
PCI Interface
512K x 36bit
Control Unit
Primary Filter
SRAM
To switch
To MCU
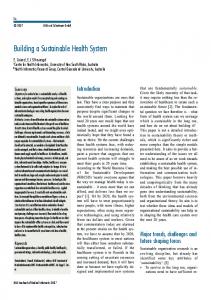
Figure 2. Block diagram of the Opium performance monitor board. The Opium performance monitor card consists of field-programmable gate arrays (FPGAs) and a 512Kx36-bit SRAM memory. Figure 2 shows a simplified block diagram of the performance card. The FPGA contains the necessary logic to capture information about the desired memory transactions on the ccNUMA interconnect, which is then stored into the SRAM memory. The card has two interfaces. The first monitors the packets that go through the MCU by tapping into the ccNUMA interconnect. The second conforms to the PCI standard and plugs into the PCI bus of a host node. Packet monitoring is non-intrusive and does not affect packet timing. Hence the card monitors the remote memory accesses that occur among the system's nodes without affecting their performance. The card does not, however, monitor the memory transactions on the local memory bus on the node it resides. Incorporating local accesses would have required a more powerful card with substantially more resources, and it was not clear during the design if adding this complexity would have been useful in achieving our aims of reducing remote memory accesses. The PCI interface serves several purposes, important among which are mapping the Opium card's memory into the main memory of the host node, and issuing interrupts to a local host processor whenever the FPGA logic detects the occurrence of a programmable set of events. The card is also programmed through the PCI interface to identify the memory access transactions of interest that should be monitored, whether in-bound into the SMP node, out-bound, or both.
The FPGA on the card has 32 programmable filters that allow it to monitor memory references made to specific ranges of physical addresses. An application or the operating system programs a filter by setting five registers within the filter. The registers contain (1) the starting address of the region to be monitored, (2) its size, (3) the granularity of the measurement, (4) a bit mask of the transaction types to be monitored, and (5) the starting counter within the card's memory. Each filter receives a copy of each memory transaction that travels on the ccNUMA interconnect. If a transaction has a type and memory address that match the filter, then the latter increments a corresponding counter within the card's memory. The base counter for the region specified within the filter and the measurement granularity determine the counter to be incremented. Thus, the programmable granularity within a filter allows the application to count references to multiple page-size memory regions or multiple cache-line-size memory regions. Each of the 512K counters can be programmed to generate an interrupt when a specific number of references occur. The interrupt is issued as a regular PCI interrupt and given to the host processor. This feature allows the operating system or the application to obtain dynamic feedback about the hot spots within the monitored regions on the fly. We do not discuss this feature or its use further in this paper. In addition to the region filters, there are 16 secondary counters, each of which contains a similar filter. These counters are programmed such that they shadow a set of the region counters, and are co-incremented whenever any such counter is incremented because of a given memory transaction. These counters reflect the cumulative counts of accesses to an area of virtual memory that may be allocated to scattered physical pages by the operating system. Moreover, the secondary counters can be programmed to count only a subset of the transaction types that are monitored by the region counters. This way, one can differentiate between read versus write accesses to a particular memory region by setting different secondary counters to track each type of memory accesses. 2.2.2. Optimization Methodology A programmer can use the Opium board to isolate performance problems caused by non-local memory accesses and accordingly control the relative placement of threads and heap memory. The software interface consists of libraries that control access to the Opium card through a regular device driver interface. During initialization, an application must make an initialization call to the library. As the library allocates memory, it captures the virtual-to-physical mappings (see Section 3) and writes a file that associates application data with
its associated physical address (this is also saved in memory.) Once the application has completed its initialization, it makes another library call to start the monitoring, specifying the regions to be monitored and the granularity at which the monitoring is to be done. When the application wants to stop monitoring, it makes a corresponding library call. The result, along with the virtual to physical address mappings, is then input to a post-processing program whose output is a table listing each application data area with the number of references from each node. The ability to specify variable-sized ranges readily suggests a measurement methodology based on successive refinements. First, start with coarse-grained memory regions such that the granularity of measurement in each region is large, say at the page level. Then, hone in on the most frequently referenced pages by reducing the number of regions to be monitored and granularity of the memory areas being monitored while collecting counts on the various parts of the pages. If necessary, we can continue this process down to individual cache lines. This successive refinement approach is meant for the common situation where access hot spots are not clearly defined making it difficult to determine where to initially focus the performance optimization effort. 2.2.3. Analysis Unlike many performance optimization techniques that are used to guide the design of the hardware and the operating system, our focus is on optimizing application software performance after the system is designed. Thus, the performance debugging methodology we advocate here is different from traditional techniques based on tracing or program annotations. A trace of an application's memory references can identify data placement problems and hot performance spots [10]. To generate a trace, the application is run and trace records are generated and stored for each memory reference of interest. Tracing can be done by hardware, e.g. using a logic analyzer, giving rise to no performance perturbation [11]. Alternatively, it can be done in software by instrumenting the application, but the perturbation introduced by the tracing code must be compensated for during post-mortem analysis. Either way, tracing memory references generates voluminous quantities of data that are difficult to reduce and complex to map back to changes on the program's behavior. Furthermore, the management and engineering of these traces are not trivial. A alternative solution to tracing is to use program annotation. This technique provides affinity in memory access through a combination of compiler analysis and operating system support for data placement. Often, source-level annotations may also be added to provide hints that aid the analysis. This technique tends to be
useful when the code is well understood or is amenable to automatic analysis. However, in practice, the application complexity makes it difficult to add the appropriate annotations, or makes compiler analysis intractable. In contrast to tracing and annotation, our solution stresses flexibility. We achieve flexibility through the programmable interface of the Opium monitor. The application or operating system sets the granularity of monitoring within each region, with the granularity ranging from 2MB to a 32-byte cache line. Each filter has a range of counters on the board, such that there is a counter for each monitoring unit within the region. The output of the board is a list of the frequencies of remote memory references that occur during monitoring, such that hot spots could be identified by high counts, while “local” memory accesses or those that are fielded by the local caches are identified by low counts. To summarize, the novel aspects of our work which distinguish it from previous research are: Ÿ
Flexibility in monitoring through a fully programmable card that can be put under operating system or application control. This contrasts with approaches where the monitoring granularity of is fixed. Our approach also lends itself to a systematic performance tuning process based on successive refinements.
Ÿ
Ease of use by avoiding the complex engineering tasks of collecting and maintaining traces, or annotating programs. The histograms we provide can be easily projected on a spreadsheet to reveal access patterns and to guide performance tuning.
Ÿ
A non-intrusive technique, and one that can be applied to production systems without affecting performance.
Ÿ
Focus on ccNUMA systems and limiting monitoring to remote memory references. We believe that this choice allows us to concentrate on the most pressing problem in ccNUMA systems.
Ÿ
Ability to generate performance-related interrupts to enable future research in dynamic performance tuning and adaptation.
These advantages come at some cost. The monitoring system cannot capture temporal changes in the remote access references. Furthermore, since the board resides on the interconnect side of the MCU, it cannot identify the actual processor within a node that is responsible for an access. Nevertheless, we have found in our
experience that these problems do not prevent the successful application of the approach. Section 6 contains a performance evaluation using this approach.
3. Basic Software Support The independent SMP nodes forming the ccNUMA systems were designed to function as independent nodes. Thus each node has its own independent boot program with no preexisting coordination to bring the system as one unit instead of four independent ones. Additionally, none of the operating systems available to us were designed for this mode of operation, or for supporting ccNUMA. In particular, the operating systems were not designed to handle remote IO devices, remote memory, or the special mechanisms for sending processor interrupts across the Interconnect. We have ported three operating systems to our platform with varying degrees of success. These are Microsoft’s Windows NT, SCO’s Unixware, and the Linux operating system from the open source community. We describe here how we handled the problems and our experience in porting the various operating systems. 3.1. Extending BIOS, NT Support and Unixware We enhanced the Basic Input Output System (BIOS) and the NT Hardware Abstraction Layer (HAL) supplied by Fujitsu in order to enable Windows NT to run on the 16-processor system (the Fujitsu implementation could support a maximum of two nodes). When powered on, the system starts booting as four separate SMP systems. After the BIOS code on each node is executed, the system executes our BIOS extension (eBIOS) before booting the operating system. The eBIOS reconfigures the four SMP nodes into one 16-way ccNUMA system. Our modifications to the NT HAL support remote inter-processor interrupts, and provide access to remote I/O devices and I/O ports by remapping them as necessary. The combination of the HAL and eBIOS code presents Windows NT with a machine that appears to be a 16-processor SMP with 4 gigabytes of physical memory. The eBIOS allows the system to be partitioned at boot time into smaller NUMA systems. For example, the eBIOS can partition the system into two 2-node systems, each with 8 processors and 2 GBytes of physical memory. Each partition runs a distinct copy of Windows NT. Other configurations for partitioning the 16-way system into separate systems are also possible. The eBIOS can also “deactivate” processors in a node at boot time allowing us to create nodes with fewer processors for configuration benchmarking purposes.
Porting Windows NT took one team member about two months to complete without any serious problems. We also ported Unixware with comparable effort. Both ports were stable and enabled many benchmarking runs and demonstrations. This is remarkable given the lack of source code for Windows NT save for the HAL. For Unixware, we had access to the source code, and the modularity of the operating system and the strict layering of software modules greatly simplified the port. 3.2. Porting Linux Porting Linux to our ccNUMA system was attractive because of its popularity, free availability of the source code, and the existence of a large base of users and expertise. However, our experience in porting Linux was not a positive one. It took about 3 team members working in excess of 6 months, and we admit that the resulting port is not stable enough to run industry-standard benchmarks. The problems lie in the poor modularity of the operating system, its outdated technology, and the development process of the open source community. Linux remains a workstation operating system developed and tested primarily on individual user workstations. By virtue of the large number of CPUs, IO devices, and memory present in our system, our hardware stressed many areas of the operating system that were not usually tested. The initial porting efforts concentrated on extending the basic Symmetric Multi Processor (SMP) capabilities and the large memory support of the Linux kernel itself. At the time we started the Linux port, Linux on the Intel x86 family only supported one 1GB of RAM. Later, the Linux community removed this restriction and added limited support for ccNUMA operation. Our progress was slowed by having to keep up to date and cope with the rapid evolution of the Linux kernel. There were two kinds of changes which affected us directly. The first consists of frequent and significant changes introducing a major new functionality or structural change. The second consists of changes which are primarily cosmetic in nature but often are difficult to deal with. For these reasons, we have focussed our benchmarking studies and performance evaluation on the Windows NT platform.
4. The Resource Set Abstraction and its Implementation Operating systems on SMP architectures try (when other constraints permit) to schedule threads on the same processor on which they have previously executed. Creating an affinity between a thread and its cache footprint in this manner results in good cache hit ratios. If the performance of a ccNUMA system is to scale as more nodes are added, the operating system must accommodate the variability in memory access times across the
system. In particular, a thread's memory allocation requests must be satisfied such that the majority of its memory accesses are served by the node on which it executes. Affinitizing memory allocations in this manner enables applications to take full advantage of the system hardware by reducing interconnect traffic. Indeed, an application may suffer in performance if most of its accesses are to memory residing on remote nodes. NUMA-aware applications thus require information about the underlying architecture to optimize performance. Applications could, for instance, use this information to co-locate threads with the data structures they most often use, thereby reducing the frequency of costly remote memory accesses. But this requirement poses two problems, namely how to represent the information about the underlying architecture, and how to avoid creating platform-specific dependencies in the software that compromise the application portability to other ccNUMA systems, including future generations of the current platform. The Resource Set (RSet) abstraction solves these two problems. In a nutshell, it intuitively captures the most common characteristics of ccNUMA machines, and presents the application programmer with a high-level, portable abstraction. Applications written to this model do not need low-level information about the underlying architecture, and can be easily ported to other ccNUMA platforms. To implement this model, the operating system or application libraries must provide an efficient mapping from the RSet model to the actual architecture. 4.1. Description Intuitively, an RSet groups several resources in such a way that a thread that is bound to a resource set consumes resources exclusively from that set. For example, one could specify an RSet containing the processors and physical memory available to one node. A thread that is bound to such an RSet will execute only on processors in that node, and have its memory allocations backed only by physical memory on that node. RSets are flexible. They can combine resources in two different nodes, include resources spanning different nodes, contain a partial set of the resources on one node, or any other combination that suits the application needs. Furthermore, they can be manipulated using union and intersection operations and can also form hierarchies, whereby one large RSet is made to contain several smaller RSets. To simplify the interface, our library provides a global RSet that contains all resources in the system. Thus, an application can build additional RSets by specifying subsets of the global one. An implementation must provide the RSet implementation with a mechanism to identify the resources available in the system. For instance, such support can be implemented in Windows NT 4.0 using an additional call in the Hardware Abstraction Layer (HAL).
Ÿ
Determining the system configuration.
Ÿ
Creating and manipulating RSets.
Ÿ
Allocating virtual memory that is backed by the physical memory contained in an RSet.
Ÿ
Binding processes and threads to the processors in an RSet.
We have implemented the RSet abstraction using a combination of DLLs, backed by an NT kernel-mode device driver. Furthermore, we also provide a higher level API that provides a simplified interface to the RSet abstraction similar to traditional thread packages. Thus, an application programmer can use the RSet facility indirectly through the familiar interface of a thread library, or can access it directly to exercise greater control. 4.2. Implementation We implemented support for RSets in Windows NT 4.0, which already has processor affinity support which allows an application to bind threads to particular processors. The RSet implementation uses this feature to provide control over thread placement. Windows NT 4.0, however, assumes that memory is equidistant to all processors in a system, and therefore does not supply any primitives to control memory placement. Adding such support directly into the operating system requires source code access, so we resorted to using a device driver and Dynamically Linked Libraries (DLL) to provide control over memory affinity. The device driver implements the mechanism to control where data could be placed in physical memory, while the DLL implements the allocation policies and a high-level, machine-independent abstraction to enhance application portability. This way, the application can organize its data structures such that they would be close to the threads that use them the most. The device driver is supported by a modified Hardware Adaptation Layer (HAL) which “hides” a portion of the physical memory on each node from the operating system. The HAL modifies the tables that the hardware
constructs at boot time to describe the available memory. The modified tables are then passed to the Windows NT memory management initialization code. The device driver manages this “hidden” memory as though it were a memory-mapped device. More specifically, the device driver uses Windows NT’s support routines that map physical memory into ranges of virtual memory. Figure 3 is a diagram of the implementation.
The DLL implements the RSet interface, and additionally, export an API for redirecting standard memory allocation calls such as malloc. Applications use the DLL to issue normal memory allocation requests, which in turn are redirected by the DLL into the device driver interface. According to the policy specified by the RSet,
OS-Controlled Memory
Windows NT DLL
Hidden Memory
Application
Device Driver
Figure 3. Memory affinity support. Application uses DLL and device driver to bypass operating system and the control memory allocation and placement. DL L translates the request to the device driver, which in turn carries out the request. Thus the application or middleware embedded in the library itself can allocate memory from a specific node to create affinity between threads and data structures. The “hidden” memory is not subject to paging or movement since the Windows NT memory manager does not control it. Once memory is allocated, the pages remain locked in physical memory and the virtual-to-physical translation does not change. Additionally, the device driver ensures that the virtual memory allocated during an application request will be backed by physically contiguous memory. As seen in Section 4, this feature reduces the resources required on the performance monitor board.
4.3. Memory Allocation Policies We have implemented several memory affinity policies that, along with thread affinity, fix a particular relationship between the processor doing the computation and the memory being referenced. Several policies were implemented for the purpose of experimentation. A complete list of all implemented policies is not relevant to this discussion, so we focus on the most important ones. The first two policies enforce thread affinity, and the remainder, memory affinity. An application specifies one of each. [1] Fill. In this policy, as many threads are bound to a node as there are processors before we continue to the next node. [2] Round Robin. In this policy, threads are bound such that the first thread is assigned to the first node, the second thread to the second node, and so on in a round robin fashion [3] Float. With Float memory allocation, there is no enforced affinity. This allocation bypasses the driver-based memory allocator and uses the standard Windows NT memory allocation primitives. [4] Local. With the Local memory allocation, memory is physically located on the node where the allocating thread is running. This establishes an affinity between the calling thread and the allocated memory. [5] Remote. With the Remote memory allocation, memory is allocated on some node other than the one where the calling thread is active. This policy is useful in performance debugging and experimentation. [6] Striped (with stride). With the Striped memory allocation, each successive page of memory (or a specified number of pages - a “stride”) is allocated from the logically next node in sequential order, so that the first “stride” pages are from node 0, the second “stride” from node 1 and so forth in a round-robin fashion. Many programs have the property that their threads use different sections of a common data structure. Striped memory allocation is appropriate for such structures although to make the best use of them, it may be necessary to pad or insert fill into the data structures to ensure that the threads access disjoint subsets of the pages that the data structure occupies. Also, this policy could be used as a default when the relationship between threads and memory cannot be described.
5. Partitioning Support A principal advantage of a ccNUMA machine is that it offers a single system image across a large number of processors. It is often desirable, however, to partition a large ccNUMA machine into smaller, isolated configurations. Such partitioning is useful for isolating workloads, containing faults, providing high availability, and supporting different operating systems on the same machine [12]. Partitioning thus adds a high degree of flexibility. For example, a banking system may designate a portion of the resources in a ccNUMA machine to serve requests incoming via the Web, while the rest of the machine runs the bank’s database. By strictly isolating these two workloads, the configuration eliminates the interference in performance between the two applications, and enables them to use two different operating systems if required. Partitioning has two flavors. On one hand, static partitioning draws the boundaries between partitions at boot time. The boundaries can be changed only if the machine is restarted. On the other hand, dynamic partitioning can change the boundaries between partitions while the machine is running. The second form is a more powerful abstraction than the first, as it provides greater flexibility without affecting the availability of the machine. However, it requires nontrivial support. 5.1. Static Partitioning We introduced extensions to the Basic Input Output System (BIOS) to enable the user to control how the machine is partitioned at boot time. To simplify the implementation, the unit of partitioning was chosen to be an SMP node. Thus, it is possible to partition the machine into 4 independent 4-way SMP’s, two 8-way ccNUMA systems, one SMP and one 12-way ccNUMA system, or one 8-way ccNUMA and two independent 4-way SMP’s, in addition of course to running the entire machine as one 16-way ccNUMA system. Each SMP starts independently and proceeds until it finishes most BIOS startup functions. At that point, the BIOS stops and prompts the user to select a partitioning scheme from the configurations described above. After the selection, the various partitions proceed to boot their respective operating systems. It is important to note that it is possible to reboot a partition or more without affecting the others. Thus, this solution provides a reasonable degree of isolation between partitions.
In retrospect, the advantage of this scheme was its simplicity and practicality. On the other hand, it requires each SMP node to have its own console, and thus negates the “single-system image” advantage of the ccNUMA system. One may argue, however, that a single system image is incompatible with the notion of running multiple partitions. Our experience in this regard revealed a serious problem. Windows NT identifies file systems by drive letters. This proved very cumbersome, because the drive letters must be managed so that they appear identical over all various configurations. For example, a disk on SMP 2 may be drive “C” for the configuration that contains only this SMP node as an independent partition. This same disk will have a different letter in a configuration where the entire system forms a 16-way partition. Given that each SMP can belong to different partitions under different configurations, then some disks will have to be accessible to applications under different drive letters without careful management. Unfortunately, Windows applications do not handle this situation very well! Worse yet, Windows NT insists that there be a drive “C” to store the operating system and boot information. The situation is even more complicated if one attempts to do software striping or exploit the logical volume features of NT over disks that belong to multiple SMP’s. Our conclusion is that Windows NT is not the appropriate platform for supporting partitioned ccNUMA systems, because of its legacy requirement of using drive letters to represent file systems, and its inability to mount these file systems in a portable manner as in UNIX. The problem seems to be fundamental, and it suggests either using UNIX variants when partitioning is required, or to expend considerable resources in managing the drives in a NT system and limiting the possible configurations. 5.2. Dynamic Partitioning Dynamic partitioning is more attractive than static partitioning, since the boundaries for the partitions can change while the system is running without rebooting any of the partitions. For example, consider the banking example that we described before. The bank may wish to devote a large portion of its resources to serving user requests at times when demand is high, at the expense of the resources devoted to running the database. At night, it may be useful to move some of these resources back to the database partition when the user demand is low. Thus, the additional resources can enable the database to provide more resources for nightly system audits and
backups. In the morning, the resources could be shifted in the opposite direction, without shutting down either partition or affecting the availability of the services. We have selected Linux as the operating system to support dynamic partitioning. This decision was motivated by the availability of the operating system’s source code, and our earlier experience with Windows NT. It was also necessary to have access to the source code to enable the partition boundaries to move at run time without shutting down the affected operating systems. To simplify the implementation, the partition boundaries are still along the SMP node boundaries as described in Section 5.1. Thus, one can move one SMP at a time between configurations. Adding a node requires modifying the cache coherency control registers within the Mesh Coherence Unit (MCU) to include the added node in the coherence domain of the receiving configuration. The next step is to search the memory of the added node for the configuration tables that identify its associated resources (CPUs, memory, I/O busses). The kernel data structures of the receiving configuration are then modified to reflect the additional resources, while the CPUs in the added node run through the boot phase during which the local timers of the added CPUs are synchronized with those of the receiving nodes. The added CPUs then enter the scheduling loop to start executing application processes. When a node is de-configured we first eliminate its CPUs from the affinity masks of all existing processes and force a reschedule. This step is necessary to prevent an application process from being scheduled on a CPU that will no longer be available to the system. The next step is to disassociate the memory to be de-configured from the coherency domain of the existing configuration. Thus, future accesses to the de-configured memory will not interfere with the existing configuration. Some restrictions to the above scheme are necessary because of the Linux operating system. De-configuring the memory of a node requires that all the usage of the memory on that node be eliminated. Since the Linux operating system requires zero-based addressing of the physical memory, and it places many of its kernel’s data structures in the low address range, removing the “first” node is very difficult. Removing a different node from the memory point of view is accomplished by first ensuring that no further memory is allocated from that node. Then all process page tables are scanned to identify whether any of the pages mapped fall into the memory range to be de-configured. If so, the relevant pages are unmapped and their contents are copied into pages that will continue to belong with the existing partition. The newly allocated pages are mapped to replace the de-configured pages. If a new page cannot be allocated at that point due to memory pressure, the target page is
paged out. Removing memory would be substantially more difficult to accomplish if it resides in the first node. Since such memory can be assigned anywhere in the kernel, e.g. device driver usage, internal data structures for process table etc., one would need to track the usage of each page and require a callback for the memory to be freed, which at this point is not provided in Linux. The overall dynamic resource migration capabilities of an operating system are an integral part of an overall system, where a Global Resource Manager (GRM) monitors resource utilization, determines how resources should be assigned to the various partitions (dependent on goals set forth for the entire cluster), and when resources need to be migrated. Figure 4 shows this architecture.
Cluster Management Capabilities - resource monitoring - resource management - workload management
OS-Capabilites: - CPU varying - memory varying - I/O varying Configuration Capabilies: - switch and coherence management - fault containment - device management - firmware interaction
Global Resource Management
OS-x
OS-y
Node-1
Node-2
OS-z
Node-3
Node-4
Switch
Figure 4. Architecture for global resource migration.
6. Performance Evaluation The performance evaluation consists of three parts. First, we report the component costs of simple operations using synthetic tests. The results of these tests provide a foundation for understanding the results of more
complex applications. Second, we report on the performance of several applications from the Splash-II benchmark [13], a computationally-intensive benchmark widely used to test the scalability of shared-memory systems. We used the Opium board to tune applications, resulting in generally good scaling. Finally, we report on the performance of Web-oriented benchmarks. This result shows that the poor local memory access performance of Intel-based SMPs limits the performance of larger ccNUMA configurations. 6.1. Synthetic Tests The synthetic tests measure the ratios of local to remote memory access latencies and bandwidth. We ported and instrumented several benchmark programs from the Hbench-OS and Lmbench suites [14, 15], using native Win32 calls to replace C library routines on the paths being measured. Additionally, we extended the benchmarks adding control for memory and thread affinities and report on the performance of memory accesses under different NUMA configurations. 6.1.1. Local vs. Remote Memory Latency We used three single-threaded C applications to measure memory latency: Ÿ
BwMemCp uses the Win32 MemoryCopy() call to copy an area of memory to another.
Ÿ
BwMemRd reads and sums an area of memory.
Ÿ
BwMemWr writes to an area of memory.
The programs were compiled with Microsoft Visual Studio 6.0 (SP3), with all optimizations available to the “release” configuration. Each program was executed in two modes. In the local mode, the thread is bound to a specific processor and all data structures are allocated using the local memory allocation policy. The remote mode uses the remote memory allocation policy. We tested two different NUMA configurations. The four-node configuration uses all four nodes and the switch. The two-node configuration uses two nodes with a direct connection between their MCUs.
7 6 5 4 3 2 1 0 BwMemCp
BwMemRd
ratio, 2-nodes
BwMemWr
ratio, 4-nodes
Figure 5. Local vs. remote memory access for two configurations. Figure 5 shows the ratios of remote to local memory access times (determined using the Intel processor performance counters) for the three benchmark programs. In the two-node system with a direct connection between the MCUs, remote memory accesses take about 2-to-3 times more to complete than local accesses. Introducing the switch to scale the system to 16 processors almost doubles the latency of remote memory accesses. In the worst case that we measured, a factor of 6 slowdown was observed. These results quantify the penalty of careless or uncontrolled memory placement in our architecture and confirm the necessity of software tuning in the absence of a remote memory cache. 6.1.2. Local Memory Bandwidth During our measurements, we noticed several anomalies where some programs would perform better if executed with a small number of threads (4 to 8) that were spread over the NUMA system, than they did on an SMP [16]. We report on some memory bandwidth tests on the basic SMP to quantify the performance of the basic nodes. For this purpose, we used multithreaded versions of the programs BwMTMemCp, BwMTMemRd and BwMTMemWr described in Section 6.1.1. All programs were run on a single SMP node, with versions that used one, two and four threads with the threads bound to different processors. We
measured the rate at which each version was able to perform the various operations, as measured by the Intel performance counters.
Local memory bandwidth (normalized)
2.5 1-thread 2 threads 4 threads
2
1.5
1
0.5
0 BwMTMemCp
BwMTMemWr BwMTMemRd
Figure 6. Local memory bandwidth for three programs. Figure 6 shows the results. We measured the number of bytes/sec processed by each program and normalize the operation bandwidth with respect to the single thread case to show a speedup factor. Our measurements show that the performance does not scale with the number of processors on the bus. Contention for the local memory banks is the main reason for this problem. We expect this problem to last for a while, as the planned increases in bus and memory bandwidth for SMPs do not match the projected increases in processor speed. 6.1.3. Local vs. Remote Memory Bandwidth We also used the programs described in Section 6.1.2 to test the ratios of local versus remote memory bandwidth, to measure the penalties associated with the additional hardware and coherence protocol in the four-node case. We used the four-thread versions where the threads are bound to different processors in one node. We tested two memory allocation configurations: local allocation and remote allocation.
1.2 1 0.8 0.6 0.4 0.2 0 BwMTMemCp
BwMTMemRd Local
BwMTMemWr
Remote
Figure 7. Local versus remote memory bandwidth for three programs.
Figure 7 shows the results, where the operation bandwidth is normalized to the local memory allocation policy. The measurements show that for these benchmarks, the operation bandwidth is reduced by up to 40% if memory is allocated remotely. For one program, namely BwMTMemWr, there was no noticeable difference between the two cases. Now, recall from Section 6.1.2 that this program saturates the local memory and does not allow for any scaling within one node. The same behavior dominates in this case, and even when memory is allocated remotely, the bandwidth is effectively dominated by the local bus contention for memory, and for the contention on the local busses of the remote memory bank. This result shows that the lack of scalability within a node may often mask the performance penalty of remote memory access. This calls for ccNUMA designs with
a smaller number of processors per node and a switch capable of connecting a large number of nodes to obtain good scalability. 6.2. The Splash-II Benchmark We conducted a detailed study of six applications, five of which are from the Splash-II benchmark suite [17]. The purpose of this study is to understand the effectiveness of the RSet implementation when used along with the information that the performance monitor board provides. The methodology instruments the application to profile important data structures and uses the Opium board to determine how they are accessed by its threads. The information is analyzed and an RSet is then used to enforce affinity policies that locate the threads near the data structures that they use most. 6.2.1. The Application Suite The study presented here uses five applications from the Splash-II benchmark and a legacy implementation of the three-dimensional Fast Fourier Transform (3DFFT). The applications from the Splash-II benchmark are Water-nsquared, Water-spatial, Ocean-contiguous, Barnes-Hut and FMM (a preliminary version of this study has been published elsewhere [16]). All applications were compiled using the Microsoft Visual C++ 6.0 compiler. A detailed description of the applications follows: 3DFFT: This application implements a 3-dimensional FFT. There are several large arrays that are shared by various threads and passed by reference. This program appears to have been originally written in Fortran and converted to C at a later date. Consequently, the sharing patterns and the program logic are obscure. Ocean-contiguous: Ocean studies large-scale ocean movements based on eddy and boundary currents. The contiguous version implements the grids as 3-dimensional arrays. This data structure allows partitions to be allocated contiguously and entirely in the local memory of processors that “own” them, enabling data locality to be enhanced. Water-nsquared: Water-nsquared simulates molecular dynamics. The threads within this application allocate many small objects that are scattered throughout the address space and are linked with each other through complex data structures.
Water-Spatial: Water-spatial also simulates molecular dynamics. While the nsquared implementation uses an O(n2 ) algorithm, the spatial version imposes a three dimensional grid on the problem domain, resulting in an O(n) algorithm that is more efficient for larger numbers of molecules. From a performance debugging perspective, the two versions use different data structures and are fundamentally different applications. Barnes-Hut: The application simulates the interaction of a system of bodies in three dimensions using a hierarchical N-body method. The main data structure is an Oct-tree representation of the computational domain. The leaves of the tree contain the bodies while the internal nodes represent cells in space. FMM: The fast multipole method (FMM) simulates a system of bodies in three dimensions over a number of time steps. FMM uses the same major data structures as Barnes, but operates on them differently. In particular, the tree representing the computational domain is traversed only once up and down per time step independent of the number of bodies, and the accuracy is controlled by how accurately each interaction is modeled. 6.2.1. Performance Debugging and Methodology Our generic performance debugging methodology was to first set up the Opium board to collect information about the entire address space of the application. We programmed Opium to monitor all outgoing accesses from each node and refined this process based on the collected information. We provide additional details on our methodology below. For applications with array based data structures (3DFFT and Ocean), we started with a fairly coarse monitoring granularity, and then zoomed down to the level of cache lines when required. In general, this is the preferred mode for performance debugging applications with regular access patterns. For instance, in 3DFFT, we programmed only one Opium filter to match all remote memory references (read or write) starting from the beginning of the heap, with a granularity of one memory page. Figure 8 shows the results from 3DFFT initial phase, with two threads working on the program (we show the pattern for two threads for simplicity and clarity. The discussion covers the cases of four, eight and sixteen threads that we obtained). As can be seen in the figure, the data structures are laid out in a uniform manner even though the program structure did not reveal this pattern easily.
The results suggest that the address range consists of six sub ranges, where the first and fifth are predominantly accessed by thread 1, and the second and sixth are predominantly accessed by thread 2. The third and fourth ranges are shared by the two threads and contain many hot spots. According to the measurement methodology that we outlined earlier, we then zoomed on the contested area to identify the level of sharing that is taking place.
Thread 1
Thread 2
50000
Accesses
40000
30000
20000
10000
0xe90000
0xe80000
0xe70000
0xe60000
0xe50000
0xe40000
0xe30000
0xe20000
0xe10000
0xe00000
0xdf0000
0xde0000
0xdd0000
0xdc0000
0xdb0000
0xda0000
0xd90000
0xd80000
0xd70000
0xd60000
0xd50000
0xd40000
0xd30000
0xd20000
0xd10000
0
Virtual Address Figure 8. Access patterns for 3DFFT with 4K monitoring granularity.
Figure 9 shows the results of the second phase of measurements where the granularity was set to a 32-byte cache line size, with focus on the fourth area. The results identify a level of sharing in which thread 2 is dominating the accesses. Combining the results of this phase with the initial results, the Opium card created the case for an allocation pattern that matched the application. Thus, instead of modifying the application, we
modified the way memory was allocated to match the application’s need. The only alternative was to substantially restructure the application, which was undesirable. We were able to use a similar process to ascertain the data access patterns in Ocean. The contiguous version of Ocean has a large number of arrays that are accessed by the different threads during execution. The Opium card showed that these data structures are divided among the threads in bands of rows and that inter-thread sharing occurred at the edges of the bands. With this information, we were able to redistribute the data structures so that each band was allocated with memory local to the node on which the corresponding thread was executing.
Thread 2
0xdda6e
0xdda02
0xdd996
0xdd92a
0xdd8be
0xdd852
0xdd7e6
0xdd77a
0xdd70e
0xdd6a2
0xdd636
0xdd5ca
0xdd55e
0xdd4f2
0xdd486
0xdd41a
0xdd3ae
500 450 400 350 300 250 200 150 100 50 0 0xdd342
Accesses
Thread 1
Virtual Address Figure 9: Refined monitoring for 3DFFT at a 32-byte cache line size
For applications with complex data structures (Water-spatial, FMM, Water-nsquared, and Barnes-Hut), our initial performance debugging attempts revealed that the data structures were being uniformly accessed by all the threads. To obtain further information, we therefore padded the structure elements to cache line boundaries, permitting us to correlate the Opium information to specific data structure elements. This method of performance
debugging is well suited to applications with irregular access patterns. We illustrate our approach in greater detail using Water-spatial as an example. In Water-spatial, the computational threads make a large number of small memory allocation requests. This pattern results in the fragmentation of the virtual (and physical) address space among the various threads in the application. By analyzing the data (not shown here for space limitations), we quickly found that it was necessary to map the actual virtual addresses to the data structures being monitored in order to determine the best way of optimizing the applications. To do so, for each memory allocation request, we recorded the calling thread identifier and the location in the program where it was made. This information is then used in addition to the Opium performance counter results to define the identities of the dynamic data structures allocated. The study quickly revealed that most of the water molecules would remain within the zone “assigned” to the thread that created it. Thus, by simply adjusting the memory allocation policy to use the local allocation (i.e. the data comes from the node on which the calling thread is running), we were able to improve data access locality. We used a similar technique for Water-nsquared. In Barnes-Hut, using Opium, we were able to quickly discover a set of arrays that were being accessed by the threads in a partitioned manner even though all of the arrays were allocated by the master thread during initialization. We partitioned these arrays between the threads, allocating each partition from the memory that was local to the executing thread. We used a similar technique for FMM. For Barnes-Hut, subsequent analysis using Opium revealed that accesses to the main particle data structure were distributed irregularly among the various threads. In order to obtain more information, we padded the data structure elements so that each element occupied a single cache line. Opium then revealed that the data structure elements could be divided into two sets – a heavily accessed set and one for which there were substantially fewer accesses. At this point, we were unable to obtain further information without examining the program. However, we examined the program solely with respect to the “important” data structure elements as identified by Opium. We were then able to ascertain a grouping for the structure elements that minimized the number of cache line transfers. 6.2.3. Performance Impact
We discuss the performance impact of our data restructuring in this section. Table 1 shows the parameters for each program execution. The program parameters were chosen such that the total data sets would not fit in the L2 caches of all 16 processors. Application 3DFFT Ocean-contiguous Water-spatial FMM Water-nsquared Barnes-Hut
Parameters 128x128x128 array 514 x 514 grid 32K molecules, 5 timesteps 64K particles, 10 iterations 9261 particles, 5 timesteps 128K particles, 4 timesteps
Sequential Exec. Time (sec) 170.58 17.44 178.96 52.06 1269.9 160.82
Table 1: Program parameters Figure 10 shows the speedup of each application, before and after the data structure reorganization derived using Opium. All speedup numbers were measured with respect to a single-threaded execution executed using the local memory allocation policy. With the exception of Barnes-Hut, there are two bars for each application. The “orig” bar shows the speedup for a 16-thread execution with the striped memory allocation policy with a stride of one page. With the lack of affinity information, this allocation is reasonable as a base case. The “reorg” bar also shows the speedup for a 16-thread execution, but with the data structures allocation reorganized as recommended by the Opium analysis. For Barnes-Hut, we show an additional bar named “extra”, in which we examined the program source armed with the Opium findings to regroup the program data structure elements.
16
Speedup
12 Orig 8
Reorg ExtraInfo
4 0 3DFFT
Ocean
Waterspatial
FMM
Waternsquared
Barnes-Hut
Figure 10: Application speedups before and after data reorganization
The first point to note about the speedup figure is that for some applications, data restructuring has a radical impact on performance. For 3DFFT and Ocean, performance is more than doubled as a result of allocating memory locally. For FMM and Water-spatial, the performance improvement is much less dramatic. The improvements are negligible for Barnes-Hut and Water-nsquared. To explain the variance in performance improvement, we present the distribution of memory accesses observed during program execution in Table 2. The first two columns show the number of accesses made by the 16 processors (Processor à L1 cache) and that made by all the L2 caches in the system (L2 cache à Memory). The next three columns show the total number of request packets, response packets and total packets in the network interconnecting the nodes. The next column shows the number of network packets in terms of memory transactions placed on the bus by the L2 cache. This is a measure of the locality of memory accesses. The last column presents the total amount of network traffic in bytes per second of application execution time3 . This is the average interconnect bandwidth consumed by the application. The “orig” and “reorg” versions show these characteristics for the original and the reorganized version of the application. As discussed earlier, Barnes alone has an “extra” row. The number of accesses made by the processors varies among the different versions of the applications. We implemented synchronization operations through user-level spin locks. The NT-provided synchronization constructs are highly inefficient and also make it difficult to understand application performance. Due to the sub-optimal data structure layout for the “orig” versions, the processors reach the barrier synchronization points in the program at different times. This causes the early processors that reach a barrier first to execute substantially more spin operations than the later ones. In the “reorg” versions of the application, the processors reach barriers at more or less the same time, leading to a small number of barrier spin operations. Spin-waiting at the barriers is particularly high in the case of Water-nsquared, where some threads take much longer to reach the barriers than others. Our NUMA system uses a directory based cache coherence protocol. In a 4-node system such as ours, a memory transaction placed on the bus by a processor can give rise to multiple network packets. For example, when a memory location is invalidated by a processor that is not on it’s home node, up to 5 network packets 3 Request packets take up 16 bytes while response packets take up 48 bytes.
could be generated. This is why in some cases, the number of network packets exceeds the number of memory transactions placed on the buses by the 16 processors.
Memory accesses (in 106 transactions)
Application
P à L1 L2 à Mem 3DFFT
Ocean Water spatial FMM Water nsquared Barnes Hut
Network accesses (in 106 packets) Req
Resp
Total
Nw bw usage in Mbytes/s
Orig
41967
408.46
497.89
308.42 806.31
494.11
Reorg
31867
374.33
76.38
59.2 135.58
216.95
Orig
6339
31.73
36.98
23.64
60.62
435.03
Reorg
6016
28.11
3.58
1.33
4.91
67.85
Orig
34952
29.96
28.16
20.60
48.77
112.11
Reorg
35024
17.56
3.83
2.27
6.10
14.61
Orig
19916
18.96
19.83
13.86
33.69
237.07
Reorg
19044
18.50
12.27
8.24
20.51
152.59
Orig
219836
31.88
26.79
19.50
46.29
14.36
Reorg
219816
31.95
17.56
13.54
31.09
9.83
Orig
29534
24.75
26.62
18.19
44.80
109.32
Reorg
29488
24.92
21.25
14.70
35.95
86.90
Extra
29195
22.40
17.87
12.04
29.92
75.99
Table 2: Execution characteristics for all applications For all the applications, the “reorg” version sends and receives fewer network packets than the “orig” version, illustrating the usefulness of the Opium performance monitor information. For 3DFFT, Ocean, and Water-spatial, the reduction is dramatic. The reduction is more modest for FMM, and Barnes-Hut. Note that a reduction in the network traffic does not by itself result in a lower execution time. For 3DFFT and Ocean, the substantial network traffic reductions are matched by corresponding reductions in execution time for the “reorg” version. However, this is not the case for Water-spatial. We need to examine two factors to
understand this behavior. First, we need to examine the impact of the network traffic on the execution time. Second, we need to examine the computation to communication ratio. It is reasonable to expect that an application with a small ratio of network traffic to memory transactions will not be affected much by a reduction in the (already small) network traffic component. Similarly, it is reasonable to expect that an application that performs a significant amount of computation per network packet will only improve modestly in performance when the network traffic is reduced. Table 3 illustrates these factors for the applications under study. The first column shows the number of network packets per memory bus transaction. This metric captures the first factor outlined above. The closer this number is to zero for an original application, the less performance improvement we can expect from reducing network traffic. The next column shows the MFLOPs executed per second (as opposed to retired per second) by the application. The last two columns show the computation to communication ratio for each application. Since all of our applications are floating point intensive, we use a FLOP as the basic unit of computation. We measured these quantities using the processor performance counters. Since the Pentium II processors in our system carry out speculative execution, the number of floating point operations retired is smaller than those executed by the processor.
Application
3DFFT
Ocean Water spatial FMM Water nsquared
Network pkts per MFLOPs per Memory Trans. second
MFLOPs per 106 Memory Trans.
MFLOPs per 106 Network Pkts
Orig
1.97
9.01
1.07
0.54
Reorg
0.36
20.65
1.16
3.21
Orig
1.91
4.49
0.75
0.39
Reorg
0.17
7.01
0.84
4.81
Orig
1.63
52.27
32.10
19.72
Reorg
0.35
57.64
54.77
157.67
Orig
1.78
42.72
18.66
10.50
Reorg
1.11
46.12
19.12
17.25
Orig
1.45
55.74
151.41
104.27
Reorg
0.97
55.86
151.07
155.25
Barnes Hut
Orig
1.81
19.96
11.37
6.28
Reorg
1.44
20.17
11.29
7.83
Extra
1.34
20.69
12.56
9.41
Table 3: Interconnect vs. memory bus traffic and computation vs. communication ratios Table 3 clearly explains the modest performance improvement for Water-spatial in spite of the dramatic reduction in network traffic. While the reduction in network traffic is several factors more than that for 3DFFT, and the number of network packets per memory transaction are comparable, Water-spatial executes substantially more floating point operations per network packet and memory transaction. Thus, even though we were able to reduce the network traffic using the Opium performance monitor, the bottleneck for this application is the computation overhead and not the communication overhead. The lack of any performance improvement for Water-nsquared is also explained by the measured data. Water-nsquared executes such a large number of floating point operations per memory transaction (or network packet), that the reduction in network traffic brings out no change in performance. 6.2.4. Effects of Local Memory Contention on Application Performance We ran several applications with a limited number of threads (four) using different configurations. In one configuration, all threads are placed in the same node. In a second configuration, the threads are distributed over two nodes, such that each node has two threads. And in the third configuration, the threads are distributed over four nodes, such that each node has one thread running. For some applications, the local memory bandwidth limited the performance of the versions where all threads were colocated in the same node. A detailed study of the experiments is available elsewhere [16]. The general conclusion that we drew from this study is that when the applications are modified to intelligently use RSets and the information collected from the performance board, remote memory accesses on the ccNUMA configurations have less of an effect. Therefore, the individual threads benefit from having less contention for local memory in configurations where there are one or two threads per node. This result confirms the earlier conclusion that we had about the need for having a smaller number of processors per node, with more nodes connected over the interconnecting switch. 6.3. Web Serving Performance
We used an industry standard benchmark to measure the performance of the ccNUMA prototype when operating as a Web server. The benchmark consists of a mix of static and dynamic data requests with the ratio being 7 to 3, respectively. During the tests each SMP node was equipped with four 100Mb/sec Ethernet network cards and four local 9GB SCSI disks. We used the software striping facility of Windows NT to provide better bandwidth for the benchmark logging. Logging was performed on a file system that is striped over two disks, while the benchmark data were stored in a file system that is striped over the other two disks. Throughout the test, the network load was observed, and in all measurements, it never reached saturation nor was the performance network bound. The experimental setup consists of a 100Mb/sec switched Ethernet network, and 48 workstations serving as the clients for the purpose of the benchmark. Each client was equipped with a 400MHz Intel Pentium II processor and 128MB of main memory. All clients ran Windows NT 4.0, the Terminal Server Edition with Service Pack 3, build 1381. The Web server benchmark used the Internet Information Server, Microsoft’s built-in Web server. We incorporated all optimizations into the system’s registry, as recommended by Microsoft.
Figure 11. Web performance in HTTP connections/seconds Figure 11 shows the performance of the Web serving benchmark, measured in the number of HTTP connections/second. The results are shown for four points, representing one node (SMP basic performance), two nodes (8 processors and 2GB of RAM only), three nodes (12 processors and 3GB of RAM), and four nodes (the fully configured NUMA system with 16 processors and 4GB of RAM).
1000
HTTP Connections/sec
900 800 700
Connections/seconds
600 500 400 300 1 Node 2 Node
3 Nodes 4 Nodes
Number of nodes in a ccNUMA configuration
Figure 12. Web performance of the basic SMP.
The results show that the scalability of the system with respect to the Web benchmark is adequate, but not compelling. In particular, increasing the number of processors from 8 to 12 results in only an increase of 100 connections, and a similar increase in performance occurs when the number of processors goes from 12 to 16. We then analyzed the performance by running the same benchmark with different configurations, to understand the causes of these problems. Figure 12 shows the results of running the benchmark for the basic SMP but with different number of processors. The results show that the performance of the basic SMP does not scale, and we attribute this problem to the poor local memory bandwidth and the resulting contention that occurs when the number of processors increases on the same local bus. As can be seen from the figure, the basic configuration scales only from one to two processors. This is similar to the results of the synthetic benchmarks showing the scalability of the memory bandwidth of the basic architecture. To confirm that the performance is limited by the local memory bandwidth, we conducted an experiment in which the number of processors per node is reduced. As expected, the reduction in local memory contention improved performance for the same number of processors. That is, a ccNUMA architecture containing one
Web Performance of a basic SMP
HTTP connections/sec
350
300
HTTP Connections
250
200
150 1
2
3
4
Number of processors
processor per node (for a total of 4 processors) outperforms an SMP, despite having processors sharing data
across the ccNUMA switch. We ran similar experiments for two ccNUMA systems containing 8 processors, where in one configuration all 8 processors come from the two nodes, and in the other they come from four nodes. The results confirm the superiority of the configuration with fewer processors per node, despite the fact that more remote memory access occurs. These results are in line with those of the synthetic benchmarks and the Splash-II benchmarks. They certainly suggest a fresh look at how Intel-based ccNUMA systems should be constructed. Note that throughout the performance evaluation for the Web workloads, the main memory was never saturated, and in fact it never reached more than 300MB per node, in any configuration.
7. Related Work Commercial interest in ccNUMA increased with the demonstration of the practicality of cache coherence through an interconnect, and the performance limitations of SMP systems. Several research projects contributed to this interest, including the Stanford DASH [18] and FLASH [19] machines, the MIT Alewife [20] machine, University of Toronto’s NUMAchine [21]. Chapter 8 of Hennessey and Patterson’s famous text on computer architecture [3] provides a general discussion of cache-coherent architecture while the book by Pfister is a survey of a variety of architectures including NUMA and various types of clusters [1]. The recent text by Culler, et al, offers the most detailed textbook coverage of the topic of which we are aware, including not only the hardware and software aspects of SMP and ccNUMA systems but also the performance evaluation techniques that are applied to them [22]. The research efforts have been accompanied by extensive commercialization of ccNUMA machines including systems such as the Silicon Graphics Origin [7], the IBM NUMA-Q [5], the Data General Aviion 2500 and NUMALiiNE [4], HP’s nuSMP series, and the Unisys ES7000 Series [8]. Our hardware prototype is based on an extension of the Fujitsu Synfinity interconnect used in Fujitsu’s team-server [9]. It is worth observing that our work began prior to IBM’s acquisition of Sequent and, unlike Sequent’s product line, is based on the extension of standard high-volume server hardware rather than the engineering of a NUMA-specific system. Our hardware includes the Opium board in each node of our prototype. At a high level the measurement facilities of the Opium are similar to those of the Princeton SurfBoard although the overall environments are quite
different. In particular, the Princeton board was developed for the SHRIMP project, which implements an abstraction of distributed shared memory over a cluster system rather than a ccNUMA system [23, 26]. However, both share the overall goal of understanding the communication pattern between the nodes of the system using data gathered during program execution by a noninvasive hardware probe. Unlike most studies of ccNUMA machines, we use Windows NT 4 as one of the operating systems, and indeed, as the primary focus of our work. While UNIX still is the most commonly studied operating system on such machines, a number of recent systems including the Sequent NUMA-Q and the Fujitsu system that our hardware extends both support Windows NT. However, Windows NT lacks some of the affinity support that we find to be necessary for good application scalability on a ccNUMA, and our work demonstrates the general need for affinity scheduling for processes and memory. The programs that we study and whose performance we attempt to improve are taken from the Splash-2 parallel processing benchmark [17], which is commonly used in both experimental and simulation studies. However, these are by no means the only types of applications of interest, and recently, there have been a number of studies undertaken that use more commercially oriented benchmarks [27, 28] such as those from the Transaction Processing Performance Council [24]. This study uses the data collected using our instrumentation hardware to improve the overall locality of the programs being run through optimization of the source code. In this it parallels some of the research on profile-based optimization. Our work relies on manually using the data to improve the source code of the application unlike the Morph environment [25]. The synthetic benchmark study reported here uses a subset of a suite of programs developed as a derivative of the Hbench-OS suite of programs from Harvard, which were used in a decompositional study of system performance by Aaron Brown [29] . These, in turn, were based on a predecessor suite of programs, Lmbench [15]. However, all of the previous work was done on UNIX or UNIX-like systems, and all of it was restricted to single stream and single-threaded tests. Our work includes a port to the native Win32 interfaces of Windows NT, the use of our affinity support, and the introduction of multi-stream tests to measure the effects of contention.
8. Conclusions We have described our experience with building an Intel-based ccNUMA system using commodity hardware and software components, with a small add-on to scale a system that was built for an 8-way configuration to a 16-way ccNUMA one. Our results point out that the local memory bandwidth often limits the scalability in performance; one would expect the effects of remote memory accesses to dominate. Based on our study, a good design point for future systems is to reduce the number of processors connected directly by a bus within a node, but to increase the number of nodes connected by the switch. Our design included an innovative hardware-software approach for application tuning, based on a hardware assist in the form of a performance monitoring board, and a software library implementing a new abstraction called the RSet. The board provides a non-intrusive means for collecting performance data about applications, and we have shown that its use has been successful in optimizing several applications. The RSet abstraction, on the other hand, allows the programmer to specify affinity and express control over resource allocation in a hardware-independent manner. The implementation of the concept on top of Windows NT used a device driver interface along with concealing the true amount of memory from the system. This combination allowed applications to directly control the data placement without having to modify the operating system source code. We have also implemented basic support for partitioning, both static and dynamic, and ported two other operating systems to the hardware. In retrospect, the simplicity of the design and building on top of existing hardware and software components allowed a team of a relatively small size to conduct the work described in this paper for a period of about two years. The resulting performance was not ideal, but was more than adequate for several applications, including commercially-oriented Web serving. Ultimately, such machines are desirable for the ease of system management, workload consolidation and isolation, and the ability to partition the hardware to fit installation needs. We believe that the approach used in this experiment should be considered as a serious option for situations where time to market and costs are of paramount importance, and when performance requirements are not too stringent. This provides an interesting design point with respect to price-performance tradeoffs.
Acknowledgments
We are indebted to many for their support and encouragement, including David Bradley, Steve Depp, Patricia Genovese, Peter Hortensius, Thomas Jeremiah, and Joseph McGovern from IBM’s Personal System Institute; and Rick Harper, Richard Oehler, Basil Smith and Marc Snir from IBM Research. Tim Biesecker, Willie Jimenez, Marisa Mace and Bain Weinberger from the Austin Research Lab provided technical and administrative support. We also received valuable technical support from Jeff Smith in our Windows NT port. Last, but not least, we would like to thank HAL Computers (a unit of Fujitsu) for the MCU hardware and the excellent support that we received.
References [1] G.F. Pfister, In Search of Clusters, 2 nd edition, Prentice-Hall, 1998.
[2] D. Solomon, Inside Windows NT, 2 nd edition, Microsoft Press, 1998. [3] J.L. Hennessy and D.A. Patterson, Computer Architecture: A Quantitative Approach, Second Edition, Morgan Kaufman, 1996. [4] Data General, “Data General’s NUMALiiNE Technology: The Foundation for the AV 25000 Server,” http://www.dg.com/numa. [5] T. Lovett and R. Clapp, “STiNG: A CC-NUMA Computer System for the Commercial Marketplace,” Proceedings of the 23rd Annual International Symposium on Computer Architecture, 1996. [6] J. Laudon and D. Lenoski, “The SGI Origin: A ccNUMA Highly Scalable Server,” ISCA ’97 Proceedings of the 24th Annual International Symposium on Computer Architecture, 1997, pp. 241-251. [7] Silicon Graphics, “Origin 3000,” http://www.sgi.com/origin/3000. [8] UNISYS, “ES7000 Series,” http://www.unisys.com/hw/servers/enterprise/7000/default.asp. [9] W. Weber, S. Gold, P. Helland, T. Shimizu, T. Wicki and W. Wilcke, “The Synfinity Interconnect Architecture: A Cost-Effective Infrastructure for High-Performance Servers,” ISCA ’97, Proceedings of the 24th Annual International Symposium on Computer Architecture. [10] J.B. Chen, “The Impact of Software Structure and Policy on CPU and Memory System Performance,” Ph.D. Thesis available as Technical Report CMU-CS-94-145, School of Computer Science, Carnegie Mellon University, 1994. [11] J. K. Flanagan, B. Nelson, J. Archibald and K. Grimsrud, “Bach: BYA Address Collection Hardware: the Collection of Complete Traces,” Proceedings of the 6 th International Conference on Modeling Techniques and Tools for Computer Performance Evaluation, 1992.
[12] B. Verghese, S. Devine, A. Gupta and M. Rosenblum, “Operating System Support for Improving Data Locality on CC-NUMA Compute Servers,” Proceedings of the 7th International Conference on Architectural Support for Programming Languages and Operating Systems, 1996. [13] J.P. Singh, W.-D. Weber and A. Gupta, “SPLASH: Stanford Parallel Applications for Shared-Memory,” Computer Architecture News, vol. 20, no. 1, pp 5-44. [14] A.B. Brown and M.I. Seltzer, “Operating System Benchmarking in the Wake of lmbench: a Case Study of the Performance of NetBSD on the Intel x86 Architecture”, Proceedings of the 1997 ACM SIGMETRICS International Conference on the Measurement and Modeling of Computer Systems, June, 1997. [15] L. McVoy and C. Staelin, “lmbench: Portable Tools for Performance Analysis,” Proceedings of the 1996 USENIX Technical Conference, January, 1996. [16] B. Brock, G. Carpenter, E. Chiprout, E. Elnozahy, M. Dean, D. Glasco, J. Peterson, R. Rajamony, F. Rawson, R. Rockhold and A. Zimmerman, “Windows NT in a ccNUMA System,” Proceedings of the 3 rd USENIX Windows NT Symposium, 1999. [17] S.C. Woo, M. Ohara, E. Torrie, J.P. Singh and A. Gupta, “The SPLASH-2 Programs: Characterization and Methodological Considerations,” ISCA ‘95 Proceedings of the 22nd Annual International Symposium on Computer Architecture, 1995. [18] D.E. Lenoski and W. Weber, Scalable Shared-Memory Multiprocessing, Morgan Kaufman, 1995. [19] J. Kuskin, D. Ofelt, M. Heinrich, J. Heinlein, R. Simoni, K. Gharachorloo, J. Chapin, D. Nakahira, J. Baxter, M. Horowitz, A. Gupta, M. Rosenblum and J. Hennessy, “The Stanford FLASH Multiprocessor,” ISCA ’94, Proceedings of the 21st Annual International Symposium on Computer Architecture. [20] A. Agarwal, R. Bianchini, D. Chaiken, K. L. Johnson, D. Kranz, J. Kubiatowicz, B. H. Lim, K. Mackenzie and D. Yeung, “The MIT Alewife Machine: Architecture and Performance,” ISCA ’95 Proceedings of the 22nd Annual International Symposium on Computer Architecture, June 1995. [21] A. Grbic, S. Brown, S. Caranci, R. Grindley, M. Gusat, G. Lemieux, K. Loveless, N. Manjikian, S. Srbljic, M. Stumm, Z. Vranesicand Z. Zilic, “Design and Implementation of the NUMAchine Multiprocessor,” Proceedings of the 35th IEEE Design Automation Conference, June 1998. [22] D.E. Culler, J.P. Singh and A. Gupta, Parallel Computer Architecture: A Hardware/Software Approach, Morgan-Kaufman, 1999. [23] Y. Zhou, L. Iftode and K. Li, “Performance Evaluation of Two Home-Based Lazy Release Consistency Protocols for Shared Virtual Memory Systems,” Second Symposium on Operating System Design and Implementation Proceedings, 1996. [24] Transaction Processing Performance Council, http://www.tpc.orghttp://www.tpc.org.
[25] X. Zhang, Z. Wang, N. Gloy, J.B. Chen and M.D. Smith, “System Support for Automatic Profiling and Optimization,” Proceedings of the Sixteenth ACM Symposium on Operating Systems Principles, 1997. [26] S.C. Karlin, D.W. Clark and M. Martonosi, “SurfBoard – A Hardware Perfomance Monitor for SHRIMP,” Princeton University Technical Report TR-596-99. [27] K. Keeton, D.A. Patterson, Y.Q. He, R.C. Raphael and W.E. Baker, “Performance Characterization of a Quad Pentium Pro SMP Using OLTP Workloads,” ISCA ‘ 98 Proceedings of the 25th Annual International Symposium on Computer Architecture, 1998. [28] P. Ranganathan, K. Gharachorloo, S.V. Adve and L.A. Barroso, “Performance of Database Workloads on Shared-Memory Systems with Out-of-Order Processors,” Proceedings of the 8th International Conference on Architectural Support for Programming Languages and Operating Systems, 1998. [29] A.B. Brown, A Decompositional Approach to Computer Systems Performance Evaluation, BA thesis, Harvard College, April, 1997.
Biographies Bishop Brock, IBM Austin Research Laboratory, 11400 Burnet Road, M/S 9460, Austin, Texas 78758: (
[email protected]): Mr Brock is a Research Staff Member in the Tools and Technology Department of the IBM Austin Research Laboratory. Mr. Brock received a M.S. in Computer Science from the University of Texas at Austin in 1987, and joined IBM in 1997. Mr Brock has co-authored numerous publications in the areas of automated reasoning, formal verification of hardware and system design, and has filed several patents related to hardware performance monitoring, security and power management techniques for servers and embedded systems. Gary D. Carpenter, IBM Austin Research Lab, 11400 Burnet Road, Austin, Texas 78758: Mr. Carpenter is a Research Staff Member at the IBM Austin Research Laboratory. He joined IBM in 1983 after recieving a B.S. in electrical engineering from the University of Kentucky. Since joining IBM has work in areas of hardware system architecture, system design, analog circuit ,and logic design. Currently his focus is research on energy efficient circuits,processors, and systems. Eli Chiprout, Intel Corporation 5000 W. Chandler Blvd. Chandler AZ 85226-3699: Dr. Chiprout is a Senior Staff CAD Engineer in the Desktop Products Group in Austin, Texas and Chandler, Arizona. He has worked in the areas of computer-aided design for advanced circuits, numerical algorithms, microprocessor design and operating systems. Dr. Chiprout received a IBM Research recognition award and is the author of a book and multiple journal and conference papers. Mark Dean IBM T.J. Watson Research Center, PO Box 218, Yorktown Heights, NY 10598: Dr. Dean is presently an IBM Fellow and Vice President of Systems in IBM Research. He is responsible for the research and application of systems technologies spanning circuits to operating environments. Dr. Dean is a member of the National Academy of Engineering and an IBM Fellow. His most recent awards include the Black Engineer of the Year Award, the NSBE Distinguished Engineer award, induction into the National Inventor’s Hall of Fame. He has more than 30 patents or patents pending. Dr. Dean received
a BSEE degree from the University of Tennessee in 1979, a MSEE degree from Florida Atlantic University in 1982, and a Ph.D. in Electrical Engineering from Stanford University in 1992. Philippe L. De Backer, IBM Austin Research Lab, 11400 Burnet Road, Austin, Texas 78758 (
[email protected]): Mr. De Backer is a member of the Research Staff of the IBM Austin Research Lab. Mr. De Backer received its engineering degree at L'Ecole Centrale des Arts et Manufactures de Paris and joined IBM in France. He has worked on AIX and joined Research in 2000. Mootaz Elnozahy, IBM Austin Research Laboratory, 11400 Burnet Road, M/S 9460, Austin, Texas 78758: Mootaz obtained his Ph.D. in Computer Science from Rice University in 1993. From 1993 to 1997 he served as an Assistant Professor at Carnegie Mellon University. Since 1997, he has joined the IBM Austin Research Lab, where he currently manages the System Software Department. Mootaz’s research interests include distributed computing, fault tolerance, networking and operating systems. He holds three patents and has published over 25 articles in distributed systems. His research in fault tolerance and reliable file systems has influenced several industrial products. Hubertus Franke: IBM T.J. Watson Research Center, PO Box 218, Yorktown Heights, NY 10598. Dr. Franke is a Research Staff Member in the Scaleable Systems Department at IBM Research, where he manages the Enterprise Linux group. He received a Ph.D. in Electrical Engineering from Vanderbilt University in 1992 and a Diplom Informatik degree from the University of Karlsruhe in 1987. He has worked in the area of software engineering, distributed and shared memory systems, and operatings systems and contributed to the IBM SP2 system software. Dr. Franke was the recipient of the 1988 Research Price from the Computer Science Research Center, Karlruhe. He wrote more than 50 technical papers, holds 7 patents and received 2 IBM Outstanding Technical Achievement Awards. Mark E. Giampapa IBM Research Division, Thomas J. Watson Research Center, P.O. Box 218, Yorktown Heights, New York 10598. Mr. Giampapa is a member of the Scalable Parallel Systems department where he holds a technical leadership position in the design and development of a parallel operating environment for a massively scalable parallel ultracomputer. After graduating from Columbia University with a Bachelor's degree in computer science in 1984 he joined IBM Research to work in the areas of collaborative and distributed processing, and focussed his research on distributed-memory and shared-memory parallel architectures and operating environments. Mr. Giampapa has received 3 Outstanding Technical Achievement Awards for his work in distributed processing, simulation and parallel operating systems. He holds 10 patents, with several pending, and has published 10 papers on the subject. David Glasco. David obtained his Ph.D. from Stanford University in Electrical Engineering. After a short stint at HP Research Lab in Palo Alto, he has joined the IBM Austin Research Lab in 1996, where has worked on system architectures for highly scalable machines and ccNUMA architectures. David left IBM in 1999. James L. Peterson, IBM Austin Research Laboratory, 11400 Burnet Road, M/S 9460, Austin, Texas 78758 (
[email protected]): Dr. Peterson is a member of the Research Staff of the IBM Austin Research Lab. Dr. Peterson received a Ph.D. from Stanford University in 1974 and then joined the Department of Computer Sciences of the University of Texas at Austin. He joined IBM in 1989. He has published 4 books (including the popular Operating Systems Principles textbook) and a number of papers on computers, software, algorithms, and systems.
Ram Rajamony, IBM Austin Research Laboratory, 11400 Burnet Road, M/S 9460, Austin, Texas 78758 (
[email protected]): Ram Rajamony received his Ph.D. from Rice University in 1998, and his B. Tech from the Indian Institute of Technology, Madras, in 1989. He is primarily interested in experimental systems, focusing in the areas of server power management, networking, operating systems, and web services. He has published over 10 papers at venues such as USENIX, ISCA, and SIGMETRICS. According to Citeseer, his publications have been cited over 300 times. He also received the Best Student Paper award at SIGMETRICS in 1997. Juan Rubio, The University of Texas at Austin, Electrical and Computer Engineering, ENS 143, Austin, Texas 78712 (
[email protected]): Mr. Rubio received his B.S. Degree in electrical engineering from the Universidad Santa Maria La Antigua, Panama, in 1997, and his M.S. degree in computer engineering from the University of Texas at Austin in 1999. He is currently a Ph.D. candidate at the University of Texas at Austin, where he is investigating hardware and software architectures to improve the performance of transaction processing workloads. His research interests are the design of microprocessors and memory systems for high performance concurrent architectures. Rajan Ravindran, IBM Global Services India Pvt. Limited. (
[email protected]): Rajan is a Software Engineer, he has been with IBM from 1998. He did his Post Graduation in Computer Science from Madurai Kamaraj University, India. Earlier he has worked in providing mass storage product solution. His work included many facets from product evaluation towards implementation. Freeman Rawson: IBM Austin Research Laboratory, 11400 Burnet Road, M/S 9460, Austin, Texas 78758 Freeman Rawson joined IBM in 1973 and spent many years working on the development of operating systems and related software in San Jose, Boca Raton and Austin before joining the Austin Research Laboratory in 1996. His interests are in systems architecture and software, systems management and Internet-related technologies. Ronald L. Rockhold, WhisperWire, Inc., 8240 N. MoPac Expressway - Suite 200, Austin, TX 78759 (
[email protected]): Dr. Rockhold is a Senior Architect for WhisperWire which he joined in 2000. Prior to WhisperWire, he was a Research Staff Member for IBM Research in Austin, TX where he focused on Operating System issues for NUMA systems. He is also an Adjunct Professor at the University of Texas at Austin, currently teaching courses in Object Oriented Programming and Design. Dr. Rockhold received his Ph.D. in Computer Science from Florida Tech in 1993.