Experiences in Applying Data-Driven Modelling Technology to Steelmaking Processes Ivan Miletic,* Franc¸ois Boudreau, Michael Dudzic, Greg Kotuza, Laura Ronholm, Vit Vaculik and Yale Zhang ArcelorMittal Dofasco, Inc., Box 2460, Hamilton, ON, Canada L8N 3J5
Experience has shown that data-driven modelling methods are useful for improving steelmaking processes. In particular, principal components analysis and partial least squares are well-suited for industrial implementation because they address practical issues such as colinearity and missing data. In the course of applying these multivariate methods on-line, a need for a flexible computer infrastructure to better support data handling and model implementation was identified and met with an internally developed software calculation platform. Multivariate methods have been found useful for monitoring and for prediction and can also be applied as a foundation for other methods such as optimization. L’exp´erience montre que les m´ethodes de mod´elisation orient´ees sur les donn´ees sont utiles pour l’am´elioration des proc´ed´es de fabrication de l’acier. En particulier, l’analyse en composantes principales et les moindres carr´es partiels conviennent bien aux applications industrielles parce que ces m´ethodes abordent des questions pratiques comme la co-lin´earit´e et les donn´ees manquantes. Lors de l’application de ces m´ethodes multivari´ees en ligne, on a identifi´e un besoin pour une infrastructure d’ordinateurs flexible afin de faciliter la manipulation des donn´ees et la mise en œuvre des mod`eles, auquel on a r´epondu par le d´eveloppement d’une plate-forme logiciel maison. Les m´ethodes multivari´ees s’av`erent utiles pour la surveillance et la pr´ediction, et elles peuvent e´ galement eˆ tre appliqu´ees comme base de fondation pour d’autres m´ethodes telle l’optimisation. Keywords: principal component analysis, partial least squares, operations optimization, process monitoring
INTRODUCTION
A
common idea that can be found in the large number of statistical techniques available to industrial practitioners engaged in process improvement and modelling work is information extraction. This idea of obtaining useful information from data is not new and is an important part of scientific investigation and business decision making. To obtain information from data for process improvement, the data must be collected and then analysed. With modern data acquisition and storage systems, ever larger volumes of data are becoming accessible. The volume of data that are available and the number of variables that can be used for model development can be difficult to manage. The practitioner is often faced with a multitude of choices and no shortage of references on how to proceed with data analysis for a particular industrial project. For example, one may start with early references such as Shewhart (1980) who outlined a set of techniques that could be used to improve process operations and to better inform workers on how the underlying mechanisms of their processing plants are operating. The empirical modelling methods described by Deming (1943) show how data and models can be used together to provide a means to develop adjustments
|
VOLUME 86, OCTOBER 2008
|
that account for measurement error. As a result, the adjusted data can better represent the underlying process on which they are measured. The improvement tools presented by Ishikawa (1976) and by The Western Electric Company (1956) can be applied to many industries and still act as a basic reference for fault detection, monitoring, and process improvement. The idea of continually improving a process was also described by Box (1957) where a procedure is given that can be used to find information on where the best operating point for a plant may be. The list goes on up to the present day with many similar references and descriptions of possible applications readily available (Mitra, 1998). Although the methods described above are generally applicable, they do not deal directly with many practical aspects of data analysis. When analysing industrial data, it quickly becomes apparent
∗ Author to whom correspondence may be addressed. E-mail address:
[email protected] Can. J. Chem. Eng. 86:937–946, 2008 © 2008 Canadian Society for Chemical Engineering DOI 10.1002/cjce.20090
|
THE CANADIAN JOURNAL OF CHEMICAL ENGINEERING
|
937
|
that the large number of variables that are typically available can become problematic if not treated properly. Problems in analysis can arise due to the condition and structure of the data themselves. Dependencies and colinearity in the data set can produce erroneous results if they are not accounted for. Many references such as the works by Draper and Smith (1981) and Morrison (1990) discuss this topic in varying degrees, and a particularly lucid and informative description of it is given by Box et al. (1973). In this work the authors describe some possible types of dependencies in a multivariate data set, how the dependencies can arise, be identified, and how they can be dealt with to improve a model. The diagnostic technique advocated by the authors involves the computation of the eigenvectors and eigenvalues of the covariance matrix of a data set. The information provided by the decomposition of the covariance matrix is the key in their analysis and their suggested course of action. Although the examples presented are focused on model fitting, the methods can be applied to data analysis in general, especially for process monitoring and improvement. The concept of analysing the covariance structure to provide information on multivariate data sets has been used in many data-driven projects. Some useful references from Professor MacGregor and his colleagues at McMaster University are listed here. These references are significant because they focus on applications and provide practical means to deal with many of the difficulties in analysis that practitioners may face. A description of how multivariate statistical methods can be used to develop process monitoring methods for steady-state processes is given by Kresta et al. (1991). The authors also show how predictive models can be developed using partial least squares (PLS). In their work, the use of multivariate statistics for process monitoring and model predictions is suggested to deal with correlations in the variables. The important topic of developing models with incomplete data sets is discussed in Nelson et al. (1996). The authors describe a means to use the decomposition of the covariance matrix to fill in missing data values, thereby making models that are used for on-line process monitoring more robust. The development of monitoring methods for batch processes was described by Nomikos and MacGregor (1994). This article provides a suggestion on how to form data matrices in a way that can be applied to process fault detection and monitoring. Once formed, the data matrix is decomposed using singular vectors and singular values derived from principal components analysis (PCA). Also, the application of image analysis outlined by Yu et al. (2003) has provided some useful insight into how multivariate analysis of images can be performed to diagnose operational problems and to find opportunities for improvement. These methods can be particularly useful in processes that are difficult to measure using traditional instrumentation. Lastly, summaries of various applications of multivariate statistical modelling techniques were given by Kourti (2002,2005). These summaries provide insight into the many useful features that multivariate modelling methods provide, in particular those that are useful in industrial settings.
HISTORY OF MULTIVARIATE MODELLING APPLICATIONS Over a decade and a half has passed since the work to develop the first statistically based systems began at ArcelorMittal Dofasco. In that time, these systems have gone from small stand-alone applications running on a 386-computer without a graphical user
|
938
|
THE CANADIAN JOURNAL OF CHEMICAL ENGINEERING
|
interface to integrated graphical systems that can be accessed by many users remotely. During this ongoing development, the relationship built with McMaster University has proved invaluable to our work with multivariate modelling methods. The McMaster Chemical Engineering Department has provided helpful advice and encouragement and has been the source of graduate level courses centred on multivariate statistics, control, and optimization methods. Many of its past graduates have found working at ArcelorMittal Dofasco an interesting and challenging experience while working on multivariate modelling and other projects. Participation in the McMaster Advanced Control Consortium (MACC) has proven valuable as a sounding board for industrial practice, and has allowed us to hear leaders in the modelling and control field from around the world discuss best practices and methods. Many multivariate modelling projects have been initiated since the first application and have been applied to diverse process areas, including iron and steelmaking, hot rolling, cold rolling, and coating. Types of applications include final product property prediction, improvements to mechanistic models, product set-up and control, and process monitoring. Two examples stand out as noteworthy. These applications are the PCA-based continuous slab caster monitoring system and the PLS-based desulphurization reagent control system. The progress in these key applications has been centred on meeting evolving client needs and changing production requirements. Improvements introduced over time included better network connectivity, standardization of data sources, changes to the model input variable set, the addition of new models to monitor particular events such as equipment start-up, software tools to support model maintenance, and improvements to the human–machine interface (HMI). The combined benefits of these systems are substantial, amounting to millions of dollars per year. The benefits brought by these applications from year to year and the relatively low up-front cost of developing models has provided motivation for continued support from management for model enhancement and maintenance. The general model development process used at ArcelorMittal Dofasco follows the outline in Figure 1. The process starts with offline analysis and the setting of modelling objectives. During this phase of development, issues relevant to the on-line application are identified and resolved through the use of various multivariate statistical models that are constructed to gain understanding of the data and its information content. An important outcome of the off-line activity is the evaluation of the results to determine if it is indeed worthwhile to proceed with an on-line application. If off-line results look promising, the models are further refined and then integrated with existing systems. The models are used on-line and are periodically assessed against the project objectives. If performance is poor or new functionality is needed, the off-line building process is restarted and the improved or new models are implemented on-line. Miletic et al. (2004) describe the general method we used to develop these systems in more detail including discussions on model construction, user interface development, and operator involvement in the system design. In this paper we offer additional insight into the development of the various parts of the systems that we previously commissioned and into recent modelling work. This includes a description of the development of software infrastructure needed for statistical modelling, and applications of multivariate methods to operations optimization modelling. The description begins with a brief outline of past work, and then provides more detail on current and future development.
|
VOLUME 86, OCTOBER 2008
|
Figure 2. Window of opportunity in a statistical monitoring scheme.
Figure 1. Model development process.
Continuous Slab Caster Fault Detection and Monitoring Slab casting machines (casters) solidify molten steel into rectangular cross-section slabs of various dimensions. The solidification process is performed in a continuous fashion by pouring liquid steel into a vertical water-cooled jacket and extracting the partially solidified steel piece from the bottom of the jacket. Loss of containment of liquid steel can occur if solidification of the outer layer of the slab is insufficient or flawed. This loss of containment is a result of a tear in the solidifying shell that allows molten steel to spill from the core of the partly solid slab. This type of fault is termed a breakout. Breakouts are potentially dangerous and cause significant costs associated with equipment damage, clean up work, and lost production time. The timely detection of the onset of faults such as breakouts provides an opportunity to reduce their impact by taking appropriate action before costs are incurred, as illustrated in Figure 2. The drive for the development of a caster fault detection and monitoring system at ArcelorMittal Dofasco came from an unacceptably high rate of breakouts that was observed over time following the commissioning of the caster in the late 1980s. A technology review was performed to determine if existing breakout avoidance methods such as those based on rules or neural networks could be applied to decrease the breakout rate. Although
|
VOLUME 86, OCTOBER 2008
|
these methods offered specific benefits, they did not meet criteria such as robustness to missing data and comprehensive protection against all breakout types. A PCA-based method was chosen as it incorporates missing data handling and models normal operation. The modelling of normal operation makes the system able to detect, in principle, any abnormal event, although in this case the focus was on the early detection of impending breakouts so that steps can be taken to avoid them. Principal component models can also accommodate the large amounts of correlated data available from the casting process. The work was initiated in 1993 as part of a part-time graduate program at McMaster University (Vaculik, 1995). Management support was offered due to the relatively low cost and low risk of attempting the modelling work. With the connection to McMaster, the work could proceed with strong technical mentoring and an open-door invitation to discussions of project work. Data were collected in support of meeting the breakout reduction goal, focusing first on steady state operation. Since breakouts are related to heat removal, focus was given to measured variables and calculated quantities such as temperatures and heat flux. Because the casting process is defined by several operating regimes, various attempts were made at establishing a means to compensate for the throughput related drift in the thermocouple signals. A time series approach was taken to remove the drift by using an exponentially weighted moving average as a filter (Miletic et al., 2004). This filter was applied to averages of thermocouple measurements to mean centre them on the filtered average value from the time series model. Consideration was also given to the need to account for changes in the width set-up of the mould. As the width changes, certain thermocouple measurements become unreliable or unavailable. This meant that averages were taken according to the particular face of the mould and the particular row of thermocouples. The model developed using this scheme was put on line in 1997. It was capable of detecting breakout events as well as equipment degradation. Since its implementation, the model was maintained on a yearly basis to ensure continued satisfactory operation, including an acceptable level of Type I and Type II error rates. During this regular maintenance, the model was rebuilt, variables were added and deleted according to sensitivity to breakout events, and new opportunities to extend the modelling work and to improve overall system performance were sought. It became apparent that while the fault detection functionality for steady-state caster operation was providing useful results, the faults that occurred during dynamic events that were once of lower priority became more
|
THE CANADIAN JOURNAL OF CHEMICAL ENGINEERING
|
939
|
Figure 3. Integration of the caster fault detection system.
important to production personnel. The changing needs of the production clients served as a driving force to improve the system and resulted in an application of the multi-way PCA (MPCA) method that is typically used for batch monitoring. This method was first used to monitor caster start-up events and was then used again to monitor transition events such as the change and replacement of a submerged entry nozzle (SEN) that is performed while the caster is running, resulting in a system that monitors the complete operation of the casting process (Figure 3). Zhang and Dudzic (2006a,b) describe many important aspects of the design and operation of this system including the method used to determine the process state and to select models during on-line operation. Figure 4 shows the course of events during a typical casting of slabs. The dynamic events are of a fixed duration and have a characteristic trajectory that can be used to establish a profile for monitoring. The applications were modified and improved over time to better integrate them with existing production systems.
Figure 4. A typical slab caster operating regime.
|
940
|
THE CANADIAN JOURNAL OF CHEMICAL ENGINEERING
|
Desulphurization Process Model Prediction and Control Desulphurization refers to the process of injecting hot metal (molten metal produced by blast furnaces) with chemical reagents to remove a portion of the sulphur in it. Determining the appropriate amount of reagents to inject requires a model of the desulphurization process. Historically, only simple models involving a few variables were used to characterize this process. Although other variables were thought to be important, they were omitted from the models to avoid the numerical difficulties caused by illconditioned variance–covariance matrices. Also, the fundamental mechanisms of hot metal sulphur removal and how it is impacted by trace elements is not fully understood. This suggested that an empirical model may be used to extract relevant information from the measured variables. The goal in applying a PLS-based solution was to improve upon the existing empirical model by using a strategy that would allow for the incorporation of all of the correlated variables and that would readily handle missing data. Since the characteristics of the purchased chemical reagents and the chemical composition of hot metal change over time, it was also important that the modelling technology have an adaptation feature. The desulphurization modelling project proceeded from a need to obtain better predictions of the amounts of reagents used to remove sulphur from hot metal. The initial version of the on-line PLS application was implemented in July 1995, and it was integrated into the operation as a PC-based control system with a basic user interface. By 2000, significant changes to operating practices that required multiple reagents necessitated new models. Benefits brought by this work include better model predictions that allow improved yield and less reagent consumption, and improved process knowledge. As a result of the work, more favourable contracts have been negotiated with reagent suppliers and an overall savings of 10% of operational costs have been achieved (Quinn and Vaculik, 2002). The PLS models included an adaptation feature based on the adaptive kernel algorithm developed by Dayal and MacGregor (1997). The adaptation feature required for this application is
|
VOLUME 86, OCTOBER 2008
|
of a different nature than that of the drift compensation method used in the PCA-based caster monitoring system, where the model parameters need to remain fixed for fault detection. In a predictive model like that used for desulphurization reagent control, the variance–covariance matrix and the PLS model parameters are adapted using a recursion that includes past and current data. These matrices are then used to update the PLS model parameters. Prior to adaptation, the new data set is validated by applying a set of rules. The rules for validation are based on the experience gained from working with process experts during the model development phase and are constructed to ensure that the data span a large portion of the range of the operating space that the model is meant to represent. In this procedure, once the updated model coefficients have been obtained, they are passed through a series of checks and validations before being implemented. These checks include, for example, the comparison of relative changes in the updated parameters to pre-specified limits. If the limits are not met, the adapted parameters are not used for the next prediction. Results needed for the recursive calculation are stored in a database for the next adaptation cycle. This pattern of data retrieval, intermediate and results calculation, and final data storage is common to most on-line applications including those based on multivariate statistical methods. A review of the work performed on these projects reveals that they are continuing multi-year efforts. Many process and modelling experts were actively involved in the work, in particular process operators that use the systems in the control rooms (pulpits). Operator input is needed to ensure that development goes beyond adequate process models to provide overall system functionality that can meet the daily requirements of the control room staff. A continual review of system functionality provided us with feedback on how improvements such as new model parameters or new user interface functionality could be delivered. The commitment needed to obtain useful results is significant and requires skills from many disciplines. This is particularly true in developing a means to manage models and the data they use to provide alarms of impending faults or model predictions. The result of the substantial software engineering effort needed to support the models we developed is described in the next section.
SOFTWARE PLATFORM DEVELOPMENT Although the fault detection and model predictive technology provided by multivariate modelling methods can produce good results, their useful application is predicated on the availability of a stable means of obtaining data, processing them, using them in a model calculation, and finally presenting their results on user interface screens. Experience with the caster fault detection and desulphurization reagent control projects has shown that this data infrastructure need can be met in various ways, all of which have some advantages and disadvantages. For example, computer code that provides specific data connectivity for a modelling application and performs calculations can be developed relatively quickly using familiar programming languages. This sort of development is rapid since it is highly customized to a particular application; however, typically it cannot be re-applied to other projects, particularly if they require different data sources and connections. This implies that for every new model that is developed, a new data interface has to be defined for model building and for on-line applications as well. In many cases, the coding of the model also requires a different programming language for each application. When several systems are deployed independently, transferring model code from a software development environment to a pro-
|
VOLUME 86, OCTOBER 2008
|
duction environment becomes a time-consuming process due to the lack of code re-use and configurability. Requirements to make the applications robust by including features such as exception (run-time error) handling and reporting, recording of software state information to facilitate debugging, and an ability to restart following a system reboot also add to implementation efforts. Through this experience with building and commissioning a variety of data-driven applications, a need for a standard means of connecting models to input data and then using that connection to store results was identified. The requirement for such a system can be encapsulated in a software-based calculation platform. Such platform software can be applied to a network of computers that contains databases and calculation modules for performing a specific task, and can be used as a bridge between models and data. The platform should be able to connect to common commercially available data sources as well as to internally developed proprietary data sources. This feature was important since there was no single standard for managing data for our multivariate modelling projects. Each project was developed for a certain location in the processing mills with its own data infrastructure. For the ArcelorMittal Dofasco modelling applications, the requirements were (i) that a software platform should allow models to be deployed in a short period of time, (ii) that it should support complex models such as those needed for multivariate modelling work, (iii) that results from model calculations should be available in real-time, and (iv) that data from different sources can be used simultaneously for calculations. If models were put on-line using a software platform, the platform itself and the models it supports needed to be configurable to make set-up and installation relatively easy. Software with this kind of functionality is commercially available from many providers but typically has limitations. Most commercial software does not fully integrate into the existing automation infrastructure. In this situation, there may be potential difficulties because of a lack of interface for third-party or proprietary (internally developed) data sources. Available software often does not provide a simple means to establish a connection between data sources and internal model variables, scaling, filtering, and other standard manipulations of data that are often necessary for statistical modelling work. Multivariate statistical models are typically supported with matrix methods and tend to need supplementary rules for model selection, robust missing data handling, and output validation. For such reasons, commercially available software is generally not flexible enough to provide a standard platform for such applications. A design of a software platform was then developed internally using the unified modelling language (UML) methodology. The UML methodology applies design tools such as sequence flow diagrams, functional descriptions, and specifications of requirements to foster a design. The methodology focuses on the scope of the software, the goals set for its development, and how end users will use it once it is built, as documented through use case analysis. This allows a project-based approach to be used for programming and development since the details of the design are encapsulated in components that can be programmed individually and later used with other pieces of the software. A comprehensive description of this approach is provided by Booch et al. (1999). Requirements were documented in detail for each functional component of the platform. These were analysed to ensure that the components would interact properly with each other and that they would follow a prescribed execution sequence. An example of this is the design of the components that handle and log software exceptions resulting from the unavailability of data sources,
|
THE CANADIAN JOURNAL OF CHEMICAL ENGINEERING
|
941
|
Figure 5. Physical model of the software platform.
network connectivity problems, or calculation module failures due to arithmetic exceptions. To accommodate new data sources in the future, a standardized framework for the implementation of data connection components was also documented. A physical model of the hardware configuration that supports the software platform is shown in Figure 5. The platform configuration is stored in a local database, and models that are compiled in the form of software component objects are loaded onto a server. An important feature is that the model software components are configurable in a code-free fashion with minimal training via a graphical user interface. The model software components are registered on the server and can then be used simultaneously in multiple instances, each of which may be configured separately. The server provides connectivity to an historian database on the existing network. Since many types of data may be needed for any one modelling application, the software platform uses application programming interface (API) technology in its interfaces. Each interface is custom-developed and is reusable with a par-
|
942
|
THE CANADIAN JOURNAL OF CHEMICAL ENGINEERING
|
ticular kind of data source. The historian database is populated with data used for model calculations. Results are then stored and can be used for recursive calculations such as for display on user interface computer screens. For example, one of the user interface screens that were developed for the caster fault detection and monitoring system is shown in Figure 6. The interface software is linked to the various models it uses via the historian database. The model software components produce outputs for various calculations and provide values of state variables that are used on the interface screens to define colour changes for alarms. An important feature in this application is that the interface software is separated from the main calculation in the model software component. This allows more rapid changes and upgrades to screens as needed without a need to change model code. A key benefit that the software platform brought to our modelling work was that a single connection point between operations data and the calculations needed to support and provide model
|
VOLUME 86, OCTOBER 2008
|
Figure 6. An example user interface screen from the caster monitoring system.
output results became available. This means that models can be programmed to connect directly only to the software platform, while the platform components connect to the necessary data sources. Connectivity between model calculations and all supported data sources is defined in a uniform manner using a graphical user interface. A generic approach that includes exception handling and reporting mechanisms becomes a more productive and robust approach overall for on-line deployment. The ability to handle many types of models other than those based on multivariate statistics is also beneficial. Models such as those needed for optimization, controller performance monitoring, and basic control charting can all be applied using the framework of the software platform.
CURRENT STATE AND FUTURE DIRECTIONS Standardizing model deployment using the software platform has been beneficial. It has allowed model developers to concentrate on modelling issues rather than data acquisition and connectivity, resulting in more rapid deployment of models for on-line use. This software development work has also provided room for exploiting new opportunities to apply data-driven modelling technologies. The current status of modelling work is described here with a short description of future directions. Our data-driven modelling work was initially focused on multivariate statistical methods but now encompasses applications where multivariate methods are used in combination with other techniques such as Bayesian networks, image analysis, and mathematical cost optimization techniques. The application of such methods can be of great benefit and are proving to be a good focus of modelling effort for the future.
Caster Quality Model Development Continued improvement in production practices over the last decade and better fault detection methods including PCA-based
|
VOLUME 86, OCTOBER 2008
|
technologies have led to a reduction in mould-related caster breakout rates. This has allowed attention to be turned to other parts of the caster. The ability of principal component methods to detect and provide early warning on breakouts that happen below the mould (between the rolls that contain the solidifying steel after it leaves the mould) is being evaluated, and Bayesian decision tree networks are under consideration for product quality modelling. Bayesian decision tree networks are applied in various industries to detect faults and provide decision support. In applications to casters, they have been used in ArcelorMittal steel mills to assign cast slabs to quality categories based on detected changes in the combined variables that are used in a model. The networks offer the advantage that expert knowledge can be directly built into the models by specifying the network links between variables using commercial software. The selection of variables is similar to the PCA-based breakout detection systems described above; however, new challenges exist on how to summarize their information content so that it can be expressed into single values for each slab and can be related to the location of possible defects on the surface of the slab. Such models provide probability levels for the occurrence of particular types of quality defects. These probability levels are checked against thresholds to determine if a cast slab meets the quality requirements of a given customer order. These multivariate methods have shown some ability to predict the quality level of newly cast slabs more accurately than traditional rules-based methods alone. Since the models are primarily used for assigning quality levels to surface defects, automated imaging systems are used to validate the models. Images are collected, checked manually, and compared to model outputs to determine if the models are able to predict the onset of a surface defect via a high probability value. We are working with staff from various ArcelorMittal sites in an attempt to implement this technology in Hamilton. We are also working with other sites to gauge if the continuous slab caster fault detection system developed for the Hamilton
|
THE CANADIAN JOURNAL OF CHEMICAL ENGINEERING
|
943
|
site can be exported and successfully applied to other casters. The direct transfer of models from one caster to another is generally not possible due to process-specific variables, different operating regimes and settings of key variables such as caster speeds. Also, different mould geometries can produce varying flow patterns that may produce signals in heat flux related measurements that are difficult to interpret and that therefore may not be useful for modelling based on multivariate statistics. In general, exporting such technology requires adapting the model structure and re-estimating model parameters.
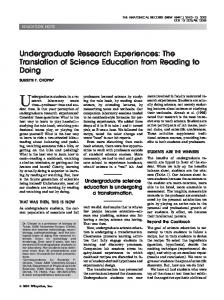
Vacuum Degasser Image Analysis Multivariate Image Analysis (MIA) methods have been evolving and have found application in industry in recent years primarily for process monitoring and control. In these types of applications, an image is obtained and then resolved into a multidimensional matrix that includes both spatial and spectral information for each pixel. Multivariate statistical methods such as PCA or PLS are then applied to extract features that may be of interest. An application of MIA techniques to the vacuum degassing process has proven beneficial (Zhang, 2007) and is discussed below. ArcelorMittal Dofasco produces ultra low-carbon steel through a vacuum tank degasser, in which high pressure argon gas is used to agitate and stir molten-metal from the bottom of the vessel. This process is used to reduce the bath carbon to ultra-low levels. Ladle eye in a vacuum degasser refers to a metal–air reaction region on the surface of the metal bath. This surface region is visible and is characterized by the lack of slag covering. The size and shape of this region is used by operators to gauge the intensity of argon stirring as well as to infer the efficiency of the carbon removal reaction. At ArcelorMittal Dofasco, two video cameras are installed at the vacuum tank degasser roof (Kuhl et al., 2004). These cameras provide operators with the real-time ladle eye images so that they are able to respond appropriately to the changing operating conditions, for example by manually increasing the argon flow rate to promote more vigorous stirring. The argon flow rate is currently set by a pre-defined time-series profile which can be adjusted as needed. Since a real-time quantitative measurement of the ladle eye surface area and shape is not available, it can be difficult to achieve a desired stable stirring regime inside the vacuum degasser via a manual feedback control strategy needed to accelerate the chemical reaction to maintain steel quality. Analysis work was done to construct a multivariate statistical model of process images in an attempt to improve argon stirring and to reduce the need for manual adjustment of the argon stirring process. The goal of the work was to improve overall steelmaking efficiency by reducing the time needed for degassing and to provide better control of carbon levels. Software tools were developed to extract the images, prepare them for analysis, and decompose them into their principal components. These tools include a means to plot pairs of model scores and to manually mask regions in the score plots. Multivariate statistical techniques provide a means to relate masked regions to features in the original image. Figure 7 illustrates this method: (a) an original image of the surface of the metal batch with ladle eyes; (b) a polygonal mask, defined in the score space using historical data, includes points corresponding to the ladle eye area in the image; and (c) the masked region is mapped back to identify the ladle eye area. Once a particular region is masked, its area can be calculated in terms of a pixel count. This ladle eye area is calculated continuously to improve understanding on how it may change at different times in the degassing process in relation to process variables, in particular
|
944
|
THE CANADIAN JOURNAL OF CHEMICAL ENGINEERING
|
Figure 7. (a) Surface of the metal batch; (b) PCA score plot and mask; (c) identified ladle eye area.
argon flow rate. As a result, our production staff has determined an improved argon flow rate that results in faster chemical reaction, thereby reducing processing time and improving ultra-low carbon steel productivity. The extension of this method to a sustainable on-line implementation has been difficult. The main barrier has been the harsh environment where the camera is located. The camera is subjected to dirt and to extreme heat. In the steelmaking production area, the lens is often obscured with dust which results in unclear images that are difficult or impossible to analyse. In addition, heat radiation has damaged the camera during trials. Typical remedies to these problems include building a casing for the camera that includes cooling air or water. Improved commercially available camera systems are under evaluation.
|
VOLUME 86, OCTOBER 2008
|
Feedstock Blend Optimization PLS methods can be applied to predict important information, such as material properties and consumption rates of commodities, required in material blending problems. Two examples are provided here to illustrate this. The applications are the blending of scrap metal feed stocks to meet customer demands for electric arc furnace steel with specific quality levels, and the blending of coals for use in coke ovens to ensure that material properties requirements are met. In these mathematical optimization problems, a mixing rule is defined that establishes how properties of a mixture of chemical substances are to be calculated. In some cases, the blended product is the result of a component mass balance; in others, chemical reactions are taken into account. The mixing rule is then included in the set of constraints that are used to find the minimum cost of making a product blend.
Scrap steel blending In the application of blending methods to the electric arc furnace process, the material that is blended is recycled steel. The material is obtained from suppliers that sell it on the open spot market as a commodity or through negotiated contracts, and also from internal sources such as the hot rolling mill. The materials are placed in large piles and cranes are used to add scrap to the electric arc furnace in prescribed amounts. The amounts are chosen to ensure that the planned furnace throughput is met and that the resulting steel meets the quality requirements of downstream customers. The melting of the steel is performed with large electrodes that are lowered into the furnace. The amount of energy needed to perform the melting is dependent on the mixture of scrap metals that are fed to the furnace batch reactor. Therefore, a cost analysis must include energy consumption as well as estimates of the impurity levels of the purchased scrap. In the software developed to solve this optimization problem, we estimated electricity consumption using a PLS model because of the complexity and effort involved in developing a firstprinciples model. In this model, the amount of electricity used is predicted using scrap characteristics and other variables such as additions of chemical reagents and temperature settings. These variables are set as constants for each optimization run based on knowledge of each steel batch type. This prediction is done at each solution step taken by the optimization solver algorithm. The predicted quantities are used in constraints that define the blending problem and produce a lowest cost purchase decision. In addition to energy requirements, the blend optimization requires knowledge of some properties of scrap steels such as residual metal concentrations that cannot be measured easily. To estimate these properties our approach was to use a recursive state estimator as an inferential soft sensor. This inferential sensor calculation provides an on-line estimate of the residual metal concentrations for each scrap type added to the furnace reaction vessel. The calculations use chemical assay data taken at each batch (heat) as well as amounts of scrap added to the basic oxygen and electric arc furnaces and other production variables. Since the residual metal concentrations for each scrap type are available as a result of this soft sensor calculation, they can be analysed and used with stochastic chance constraints to ensure that the scrap mix recommended by the optimization model does not exceed critical blended property limits. Miletic et al. (2006) provide details on the mathematical formulation of the nonlinear optimization problem and describe how this formulation is solved. For example, when combined with mass balance constraints, spot market prices, internal and sup-
|
VOLUME 86, OCTOBER 2008
|
Figure 8. Benefits from scrap blending optimization.
plier inventory levels, tiered scrap pricing, and other information, the predictive models for electricity use and residual metal concentration result in an overall optimization model that may be solved to determine an optimal choice of suppliers with associated amounts and types of scrap to buy from them. The optimization model uses integer variables for the supplier choice and for the selection of pricing tier to produce a solution that describes what amounts of scrap should be used in the furnace reactor vessel. This ratio is what is purchased when the scrap inventory needs to be replenished. The overall optimization model is in regular monthly use as part of the decision support provided to the negotiation and planning team that executes the scrap purchase. The application of this optimization model has produced significant savings as shown in Figure 8. The dollar savings and amounts of scrap used are presented as a percentage of the savings achieved in the first month of operation with the scrap optimization model. The fluctuations in the savings dollars are due to volatile market processes. Although the fluctuations are large, they do show positive savings during the 5-month period following implementation. During this period, the use of scrap remained at a relatively consistent level, decreasing slightly. This indicates that the significant savings achieved were due to changes in the scrap mix, not to reduced amounts fed to the furnace (Miletic et al., 2006).
Coal blending The use of PLS-based prediction methods has led to better predictions of quality attributes that are of interest in the blending of coal to obtain desired coke properties for use in blast furnaces and to maintain coke oven integrity. A typical blend consists of 25% low-volatile, 30% mid-volatile, and 45% high-volatile coals. Within these volatility ranges, there are hundreds of coals from which to choose to achieve the desired blended properties. Before any new coal blend is charged into the coke oven, it is first evaluated in costly pilot plant tests. Key parameters, such as coke stability, maximum coking pressure, and minimum coke contraction, are measured during these tests. These parameters are then used to decide if the new coal blend meets the customer and safety requirements and can be used in the production coke ovens. Since testing is costly, standard practice is to use various regression models to infer blend properties and reduce the set of potential
|
THE CANADIAN JOURNAL OF CHEMICAL ENGINEERING
|
945
|
coal blends to test in the pilot plant; however, these models were developed for specific types of coals and are not accurate over the entire range of coal properties that must be considered in the evaluation of the various blends. In our approach based on using multivariate statistics, a historical data set is used to develop PLS models to predict the final coke properties such as coke yield, specific gravity, and process variables such as gas pressures. This data set includes production parameters that are not included in the previous regression models. Preliminary results are promising based on reduced model prediction errors. When completed, the predictive model is intended for use in future work to define and solve the coal blending optimization problem and to develop a cost optimization software tool.
SUMMARY Our experiences with data-driven modelling methods over the last decade and a half have shown their value for improving steelmaking processes. In particular, multivariate statistical methods such as PCA and PLS are well-suited for industrial implementation because they address practical issues such as colinearity and missing data. Participation in the MACC has proven beneficial for mentoring, exposure to other practitioners, and introduction to methodologies for data analysis focused on practical applications. In the course of applying multivariate methods to industrial processes, a need for a flexible computer infrastructure to better manage data handling and model implementation was identified and met with a software calculation platform developed internally. We found multivariate methods useful for monitoring and prediction. They can also be applied as a foundation for application of other technologies, such as Bayesian networks, image analysis, and mathematical optimization.
ACKNOWLEDGEMENTS Acknowledgements are extended to the McMaster Advanced Control Consortium for their long-standing support on modelling projects performed at ArcelorMittal Dofasco.
REFERENCES Booch, G., J. Rumbaugh and I. Jacobson, “The Unified Modeling Language User Guide,” Addison Wesley, Boston, MA (1999). Box, G. E. P., “Evolutionary Operation: A Method for Increasing Industrial Productivity,” J. Roy. Stat. Soc. C. Appl. Stat. 6, 81–101 (1957). Box, G. E. P., W. G. Hunter, J. F. MacGregor and J. Erjavec, “Some Problems Associated with the Analysis of Multiresponse Data,” Technometrics 15, 33–51 (1973). Dayal, B. and J. F. MacGregor, “Recursively Exponentially Weighted PLS and Its Application to Adaptive Control and Prediction,” J. Process Control 7, 169–179 (1997). Deming, W. E., “Statistical Adjustment of Data,” Dover Publications, New York, NY (1943). Draper, N. R. and H. Smith, “Applied Regression Analysis,” 2nd edition, Wiley, New York, NY (1981). Ishikawa, K., “Guide To Quality Control,” UNIPUB, New York, NY (1976). Kourti, T., “Process Analysis and Abnormal Situation Detection: From Theory to Practice,” IEEE Control Syst. Mag. 22, 10–25 (2002).
|
946
|
THE CANADIAN JOURNAL OF CHEMICAL ENGINEERING
|
Kourti, T., “Application of Latent Variable Methods to Process Control and Multivariate Statistical Process Control in Industry,” Int. J. Adapt. Control. Signal Process 19, 213–246 (2005). Kresta, J., J. F. MacGregor and T. E. Marlin, “Multivariate Statistical Monitoring of Process Operating Performance,” Can. J. Chem. Eng. 69, 35–47 (1991). Kuhl, T., S. Sun and M. K. Trinh, “Equipment and Practice Enhancements at Dofasco’s Vacuum Degas Tank for ULC Steel,” Iron Steel Tech. 4, 21–27 (2004). Miletic, I., S. Quinn, M. Dudzic, V. Vaculik and M. Champagne, “An Industrial Perspective in Implementing On-Line Applications of Multivariate Statistics,” J. Process Control 14, 821–836 (2004). Miletic, I., R. Garbaty, S. Waterfall and M. Mathewson, “Steel Scrap Purchasing Optimization and Supply Management,” AIChE Annual Meeting, San Francisco, CA, USA, November 12–16, (2006). Mitra, A., “Fundamentals of Quality Control and Improvement,” 2nd edition, Prentice-Hall, New Jersey (1998). Morrison, D. F., “Multivariate Statistical Methods,” 3rd edition, McGraw-Hill, New York (1990). Nelson, P. R. C., P. A. Taylor and J. F. MacGregor, “Missing Data Methods in PCA and PLS: Score Calculations with Incomplete Observations,” Chemometr. Intell. Lab. Syst. 35, 45–65 (1996). Nomikos, P. and J. F. MacGregor, “Monitoring of Batch Processes using Multi-way Principal Component Analysis,” AIChE J. 40, 1361–1375 (1994). Quinn, S. L. and V. Vaculik, “Improving the Desulfurization Process Using Adaptive Multivariate Statistical Modeling,” AISE Steel Tech. 79, 37–41 (2002). Shewhart, W. A., “Economic Control of Quality of Manufactured Product,” reprint by ASQ Quality Press, Milwaukee, WI (1980). The Western Electric Company. “Statistical Quality Control Handbook,” Mack Printing Co., Easton, PA (1956). Vaculik, V. “Applications of Multivariate Projection Methods in the Steel Industry,” M.Eng. Project, Department of Chemical Engineering, McMaster University, Hamilton, ON, Canada (1995). Yu, H. J. F. MacGregor, G. Haarsma and W. Bourg, “Digital Imaging for Online Monitoring and Control of Industrial Snack Food Processes,” Ind. Eng. Chem. Res. 42, 3036–3044 (2003). Zhang, Y. “Industrial Experiences on Application of Multivariate Image Analysis in Steelmaking Processes,” in Proc. 12th IFAC Symposium on Automation in Mining, Mineral and Metal Processing, Qu´ebec, QC, Canada, August 21–23, 2007, IFAC (2007), pp. 273–278. Zhang, Y. and M. S. Dudzic, “Industrial Application of Multivariate SPC to Continuous Caster Start-Up Operations for Breakout Prevention,” Control Eng. Pract. 14, 1357–1375 (2006a). Zhang, Y. and M. S. Dudzic, “Online Monitoring of Steel Casting Processes Using Multivariate Statistical Technologies: From Continuous to Transitional Operations,” J. Process Control 16, 819–829 (2006b).
Manuscript received March 14, 2008; revised manuscript received May 14, 2008; accepted for publication June 2, 2008.
|
VOLUME 86, OCTOBER 2008
|