Experiences with Hackystat as a service-oriented architecture Philip M. Johnson Shaoxuan Zhang Pavel Senin Collaborative Software Development Laboratory Department of Information and Computer Sciences University of Hawai’i Honolulu, HI 96822
[email protected]
Abstract Hackystat is an open source framework for automated collection and analysis of software engineering process and product data. Hackystat has been in development since 2001, and has gone through eight major architectural revisions during that time. In 2007, we performed the latest architectural revision, whose primary goal was to reimplement Hackystat as a service-oriented architecture (SOA). This version has now been in public release for a year, and this paper reports on our experiences: the motivations that led us to reimplement the system as a SOA, the costs and benefits of that conversion, and our lessons learned.
1. Introduction Software engineering measurement is a compelling practice in principle. By gathering data on the structure and quality of code, as well as the behaviors of the developers as they build it, one can imagine obtaining useful insight into the current state of development, better estimates of what lies in store for the future, and ideas on how to improve current practices and work artifacts. The reality is that software engineering measurements are difficult to obtain and difficult to interpret. To the extent that measurements are made manually, this incurs overhead on the development staff which might seem expendible when the schedule is tight. Even if measurements are made, useful insight and action is often difficult to obtain. Is test case coverage of 70% good, bad, or someplace in between? Even if everyone agrees it is bad, what exactly should be done, if anything?
Since 2001, we have been developing an open source framework for automated collection and analysis of software engineering process and product data called Hackystat (http://www.hackystat.org/) [1], [2]. The goal of Hackystat is to provide an extensible mechanism that can radically reduce the overhead associated with collection of a wide variety of software engineering data, along with a sophisticated toolkit of analyses that can facilitate useful interpretation. Over the years, Hackystat has been used in a wide variety of application areas, including: classroom pedagogy, inference of test-driven design practice, software engineering of high performance computing systems, and a telemetry-based approach to software measurement trend definition and display. The Hackystat Framework is intended to be generic: it strives to be neutral with respect to the platform, programming language and environment, development process, and application domain. We have not found this to be a simple goal, and the architecture of Hackystat has undergone eight significant revisions since 2001 in response to new application demands upon the framework. One of the most significant architectural revisions is the most recent one, which occurred in 2007 when we migrated the Hackystat Framework from a traditional client-server web application architecture to a serviceoriented architecture (SOA) using REST design principles. This required eight months of development and a rewrite of most of the system (which by that time had grown to approximately 350,000 lines of code). There are several reasons why we believe Hackystat is an interesting example of a service oriented architecture. First, it is a mature and non-trivial system whose entire source code history is available and
whose conversion to SOA was motivated by concrete design issues. Second, it appears to be the first and only SOA-based software engineering data collection and analysis system. Other such systems (including SixthSense Analytics, Programeter, Devcreek, SonarSource, ElectroCodeoGram, and EPM) all have a client-server architecture. Finally, Hackystat implements a carefully designed combination of distributed computation, caching, and pre-fetching that attempts to provide the flexibility and scalability of SOA without sacrificing the performance of a simpler client-server architecture. The SOA version of Hackystat has been in public release for approximately one year, and this has given us sufficient time to start to understand the changes, both positive and negative, that have resulted from this move. Section 2 discusses the shortcomings of our prior Hackystat architecture which led us to reimplement the system in a service-oriented manner. Section 3 introduces our current service-oriented architecture and its features. Section 4 presents our experiences, both positive and negative, with the SOA implementation. Section 5 summarizes our lessons learned.
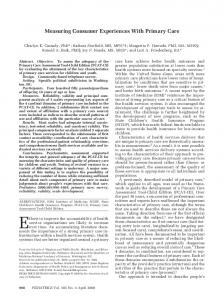
2. Motivation for the Hackystat SOA architecture Hackystat architectural design decisions has always followed an “agile” approach of implementing “the simplest thing that could possibly work”. Since 2001, this has resulted in eight significant re-designs of the system as it outgrew the constraints imposed by the previous architecture. Some might view this as a process-level bug, but we view it as a feature: we could never have predicted in advance which application areas Hackystat would be used in and the specific architectural pressures they would create. As a result, Hackystat’s current implementation as a SOA architecture is not based upon SOA being the current “hot” architecture, but rather as a response to specific issues we were facing with the previous version and the hope that SOA could address them. To understand the costs and benefits of Hackystat Version 8, it is important to know a little bit about its predecessor, Version 7. First, by the time of Version 7, Hackystat had grown to support software engineering data collection and analysis in a variety of very different domains, including Java-based classroom instruction, C-based high performance computing, Java and Visual Studio-based test driven design inference, build system analysis for NASA, a “continuous” approach to the Goal-Question-Metric paradigm, and others. To support sharing of overlapping functionality between these domains, the 350 KLOC in the system were
broken down into approximately 70 different modules. While it was possible to build a release of Hackystat containing all of these modules (and we did so for testing purposes), we found that any particular domain of application was much better served by supporting Hackystat “configurations”, or builds of the system containing a subset of all possible modules. Figure 1 illustrates Hackystat modules, subsystems, and configurations in Version 7. It shows samples of modules (such as “Standard”, “HPC Experiment”, etc.) from two configurations: HPC and Classroom. Although only 10 modules are shown in the figure due to space limitations, Hackystat 7 configurations typically contained from 30 to 60 modules. Modules were assigned to one of four “subsystems” depending upon their functionality: the “Sensor” subsystem contains modules providing software “plugins” to various tools; the “SDT” subsystem contains implementations of structured sensor data called“sensor data types”, the “Core” subsystem provides basic client and server-side infrastructure, and the “App” subsystem contains domain-specific analyses and user interface facilities. Each module in Hackystat was managed as a separate Subversion project, but most could not be compiled individually. Instead, the build process would take in a description of a Hackystat configuration as a list of modules, and then compile those modules together into a functional client-server application and run the set of tests associated with the included modules. Each Hackystat module was required to indicate the other modules that it depended upon so that the build process could sequentialize and resolve dependencies. If, during the build of a configuration, the system encountered a module with a dependency that was not included in the configuration list, an error was signalled. Let’s now turn to some of the problems we encountered with this approach to modularity and flexibility within the confines of a client-server architecture.
2.1. System configuration binding time In the Version 7 architecture, we defined a system configuration as a list of modules and then invoked the build system to produce a binary containing those sets of modules. This approach was the most straightforward way to build a single client-server system with a subset of all possible modules while still enabling testing and dependency resolution. It did mean, however, that any user wanting to create a new configuration adapted to their specialized needs would have to learn how to build the system from
Figure 1. Two example Version 7 configurations
sources. In Version 7, one could not take an existing binary release and augment its functionality without recompilation.
2.2. Complexity of build We discovered that our need for a configurable system building process exceeded the standard capabilities of Ant, the canonical Java build system tool. To resolve this, we created a custom Hackystat build system “wrapper” around Ant. This wrapper would take as input an XML description of a Hackystat module and its dependencies, and generate a number of Ant scripts that would correctly order the sequence of targets for a particular configuration. While the build system wrapper worked quite well, and actually automated the generation of many thousands of lines of Ant build scripts, the problem was that new Hackystat developers now needed to learn a custom system in order to build Hackystat. Furthermore, not only developers of new Hackystat modules needed to learn this build system, but even those who simply wanted to create a custom configuration from existing modules needed to learn it.
would then be input into a rule-based system for classification with respect to TDD compliance. Figure 2 illustrates this aspect of the internal structure of the server. Raw sensor data “percolates up” through a series of analyses to form increasingly higher level abstractions. Some intermediate analyses (such as the SensorData analysis) could be used by multiple higher level analyses.
2.3. Lack of access to “intermediate” analyses In the early stages of Hackystat development, sensor data was sent to a web server, which performed relatively simple analyses over that data before presenting that data to the user in a web page. As the complexity of our analyses increased, we found it useful to decompose some of them into pipelines of smaller analyses. For example, to obtain telemetry (trend) data, the raw sensor data would first be analyzed into intermediate objects called “DailyProjectData”, which would then be input into the Telemetry mechanism and further refined to produce the trends of interest. As a second example, the Test-Driven Design analysis would first organize the raw sensor data into “episodes” which
Figure 2. Version 7 subsystems and pipelines
One resulting problem with this pipeline is that though the intermediate results were often interesting in their own right, they were not easily accessed outside of the server-side processing mechanisms. Another problem resulted from caching, as discussed below in Section 2.6.
2.4. Server-side and build language specificity The Hackystat framework is designed to be generic within the domain of collection and analysis of software engineering process and product data. It should run on all platforms, support sensors for arbitrary software development tools and languages, and support analyses for a wide variety of process and product measurement types. The same language “neutrality” did not hold true when it came to the framework itself. Client-side sensors could (and were) written in a variety of languages: Java, C#, Emacs Lisp, etc. The server, however, was a Java web application, and all analyses and user interfaces were required to be written in Java and conform to the Hackystat web interface structure. Similarly, the build system for Hackystat Version 7 was Ant, and the only supported container for the server web application was Tomcat.
2.5. UI rigidity To simplify UI development, Version 7 provided a high-level API for adding new commands to the Hackystat web application interface which provided a very standard look and feel. Figure 3 illustrates two commands from Version 7 and their standardized lookand-feel. When first implemented, the user interface API saved time. Though there was a learning curve associated with it, the API enabled the set of modules in a given configuration could contribute its own set of commands to the user interface. It also guaranteed that all commands would exhibit the same user interface. Finally, we implemented an API that made it simple to programmatically invoke commands in the user interface from test code. By the time of Version 8, we began to feel that the user interface standard was also a straightjacket: Hackystat’s architecture was effectively “frozen” with a single user interface style and both the build system and test system (as well as actual UI code) would need to be changed significantly in order to support experimentation with alternative user interfaces.
2.6. Cache thrash In the Telemetry application, it was not uncommon to regularly request an analysis that might display 30 or 40 trend lines for a set of software projects over the last several months. Such a request could easily involve the processing of hundreds of thousands of raw sensor data instances. However, many of those trend lines might
require access to the raw same sensor data, and many if not most of the trend line components might involve computations that were performed previously the last time the analysis was requested. We quickly discovered that a naive implementation of telemetry could easily take several hours to perform common types of analysis, but that our “pipeline” approach to analysis lent itself naturally to caching. The basic idea is simple: use caches to store the results of intermediate computations. Referring again to Figure 2, we implemented a cache for Sensor Data (which avoided to cost of going to the database), a cache for Daily Project Data instances (which avoided the cost of re-processing Sensor Data), and a cache for Episodes (which again avoided the cost of reprocessing Sensor Data). The introduction of multiple caches worked extremely well for a while. Computations which could have taken hours now took only seconds or minutes. Unfortunately as the system continued to grow in size and complexity, caching began to create problems of its own. The millions of sensor data instances in a Hackystat sensor data repository meant that we could not simply cache everything; we needed to limit the size of the various caches. As the number of caches for different types of intermediate objects increased, we started to see evidence of “cache thrash”: one cache appeared to be discarding objects just as another cache would be requesting them. Tuning the various caches to maintain the right size and work effectively with each other constituted a difficult performance analysis problem.
3. Hackystat as SOA To summarize, Hackystat’s original client-server architecture worked well when Hackystat processed relatively few kinds of data in relatively few kinds of ways for a relatively small number of users. We hypothesize that the prior architecture would have scaled well, at least for a while, if growth had been restricted to just one of these three dimensions. Unfortunately, the system grew in scale along all three of these dimensions simultaneously. We attempted to manage its size and complexity while staying within the basic client-server architectural model in several ways: by a custom module system to support configurations; by pipelining analysis processing; by caching; and by high level APIs for the user interface, build system, and testing. By 2007, however, we realized that we had designed ourselves into a corner: the system structure was well
Figure 3. Two example Version 7 commands illustrating the common look and feel
suited to a certain performance load and set of application domains, but the features that achieved that also actively prevented us from other kinds of extensions and enhancements. After a month of discussion, we halted all development on the Version 7 code base and started over with a new architectural paradigm: a RESTful serviceoriented architecture. Figure 4 illustrates some of the services now available or in active development in Version 8. A comparison of Figure 4 with Figure 2 reveals several of the major similarities and differences between the old client-server architecture and the new service-oriented architecture. First, Hackystat Version 8 retains a similar kind of pipelined, incremental approach to analysis that was present in Version 7. This is illustrated by the presence of uniformly upward pointing arrows in both Figures. In both versions, raw sensor data is stored in a database and “percolates upward” through various kinds of analyses toward a user interface. However, in Version 8 there is no longer a “box” around the analyses, indicating that instead of a single server, Hackystat now consists of a number of cooperating services, some of which correspond relatively directly to analysis subsystems within the old system (such as SensorBase, DailyProjectData, and Telemetry), and others of which are brand new: ProjectBrowser, Tickertape, and TrajectoryViewer. In Figure 2, the arrows essentially correspond to Java method invocations all within a single process. In Figure 4, the arrows correspond to HTTP calls designed according to REST (Representational State Transfer) principles [3].
4. Pros and cons of SOA The re-implementation of Hackystat as a serviceoriented architecture was not trivial: it required eight months of effort, and we have still not completed the porting of all the capabilities present in Version 7.
On the other hand, the move to a service-oriented architecture has broken the “design knot” that we found ourselves in with Version 7 and has enabled us to explore new interfaces and capabilities that were effectively precluded by the old architecture. As part of the move to Version 8, we also moved to Google Project Hosting. Each service in Hackystat 8 is managed as an independent project. There are currently over 40 separate projects related to Hackystat at Google Project Hosting. Let’s begin the analysis of the pros and cons of SOA for our domain by revisiting the issues we confronted in Version 7 as described above:
4.1. Server-side and build language specificity One of the fundamental benefits of moving to a SOA architecture has been the elimination of Java and Ant as the required server-side implementation language and build tool. In Version 8, each service is developed as an independent project (normally hosted at Google Project Hosting, although even this is not mandatory). Because each service communicates with each other via HTTP, the only constraint on language choice is the ability to process the HTTP networking protocol; a feature available in all modern programming languages. In addition to Java, services have been already been developed using Perl, Python, and Flex. A service implementation is similarly free to choose the most appropriate build tool for its environment.
4.2. Complexity of build Version 7 required a custom build system which created a barrier to entry for new developers. This problem no longer exists, as each service in Version 8 can choose its own language and build technology.
4.3. Lack of access to “intermediate” analyses Another substantial benefit of the SOA architecture is the “opening up” of the analysis pipelines that were
Figure 4. Services now available or in development for Hackystat Version 8
formerly embedded within the Version 7 client-server architecture. In Version 8, major analysis components, such as the raw sensor data, daily project data, and telemetry have been encapsulated within their own individual services. This open architecture means that all stages of an analysis pipeline are now accessable for extension and reuse.
one HTTP request requiring 20 to 100 milliseconds or more. This constitutes a two to three order of magnitude performance hit! Note that the more “arrows” that must be traversed to perform an analysis, the worse the potential performance hit becomes.
4.5. Cache thrash
As a simple yet realistic example of the problem, the Software ICU interface shown in Figure 5 illustrates current values and trends for nine metrics on five projects, each with around 5 developers, over five weeks. Without caching, each trend requires one HTTP request from the telemetry service, for a total of 9 trends/project * 5 projects = 45 HTTP requests. To build each trend line, the Telemetry service must ask for at least one DailyProjectData instance per day, or 7 days/week * 5 weeks = 35 HTTP DailyProjectData requests per trend line. Since we have 45 trends to compute, that’s 35 HTTP requests / trend * 45 trends = 1575 HTTP requests. Now it gets really bad, because the computation of a single DailyProjectData request could easily require the processing of 100 SensorData instances on average. This brings the total number of HTTP requests to 1575 * 100, or 157,500 HTTP requests in order to build the Software ICU visualization. If we are optimistic and assume an average HTTP request/response cycle requires only 20 ms, that means the communication overhead alone for this request is almost an hour, without adding in the actual computation time!
There is one spectacular downside in the move from client-server to SOA architecture: what was once an inmemory method invocation (i.e. the arrows in Figure 2 is now an HTTP request (i.e. the arrows in Figure 4). In-memory object retrievals that took less than a millisecond in Version 7 could now require at least
The “communication” requirements for a clientserver system implementing the Software ICU would be similar, except that instead of 157,500 HTTP requests, a client-server system would require 157,500 method invocations. Assuming a method invocation takes 1 ms, the communication requirements drop to a little over 2 minutes.
4.4. UI rigidity Any client-server architecture implicitly requires a choice of a single user interface technilogy: be it Java, Ruby on Rails, PHP, etc. By moving to a serviceoriented architecture, we freed ourselves from having to make this choice. Hackystat is now able to support many different user interfaces, including both webbased (via a browser) or client-side (native). This has facilitated entirely new avenues for research and development, including advanced 3D visualization (requiring a native client user interface) and integration with social networking user interfaces such as Facebook and Twitter. Figure 5 illustrates one such interface made possible by Version 8 called the “Software ICU” which uses layout, color, sparklines, and sortable columns in a way not possible in Version 7:
Figure 5. The Software ICU interface, made possible by Version 8
This is not a simple problem to resolve, and the Hackystat development community has so far initiated two different approaches to dealing with it. First, we have implemented URL caches in certain intermediate services such as Daily Project Data and Telemetry. One of the benefits of a RESTful API design is the ability to exploit well understood HTTP caching and cache control mechanisms. A characteristic of Hackystat’s domain is that historical analysis data instances rarely change once they have been computed, making them extremely well suited to caching. We built a generic cache facility based upon Apache JCS (Java Caching System) which supports very fast diskbacked mapping of URLs to the associated response object. These caches eliminate a significant amount of computation as well as HTTP requests. For example, if a developer requests the Software ICU visualization once a week, then four out of the five weeks of trend data will be cached from previous invocations, resulting in an 80% reduction in HTTP communication overhead.
5. Lessons Learned After one year of use, we are quite happy with our decision to move to a service-oriented architecture, though it has not been without challenges. Here are some of the lessons we learned from our experience.
5.1. SOA introduces costs Our move to SOA was not cheap. First, forward progress on functionality was arrested for approximately eight months while we performed an almost complete reimplementation of the system. We do not believe that “retrofitting” a service-oriented architecture on our prior code base would have been effective, and ultimately might have taken longer than simply starting over. Second, the move to SOA meant that our developers needed to learn new architectural concepts (such as REST) as well as new libraries (such as Apache JCS). This was part of the reason why the process took so long.
5.2. SOA decouples on multiple levels This is good, but we can do even better via a mechanism we designed called “prefetching”. The idea of prefetching is that if you know you’ll want an analysis once a week, then simply set up a timerbased process to request that analysis once a day, discarding the results. Prefetching is quite powerful in several ways. First, it pre-fills the caches for the analysis of interest. This means that in the case of our Software ICU example, the number of HTTP requests is reduced to 45, which typically introduces under a second of communication overhead. Second, due to the nature of the service-oriented architecture, many other related analyses benefit as well. For example, filling the DailyProjectData cache will speed up all services requesting that data, not just the Software ICU. Finally, repeatedly prefetching introduces much less overhead on the system than one might expect, because most of the prefetch involves previously cached data by design.
Our new SOA architecture has decoupled not only our system, but also our development process and even our organization. As described above, our previous architecture enforced a common language (Java), a common build system (Ant plus custom extensions), and ultimately a common way of doing development (via the quality assurance mechanisms and standards we implemented). With SOA, these technological constraints which could be exploited to enforce “best practices” have been removed. As a simple example, it is hard for Java programmers to perform effective and useful code reviews on Python code; we do not have the experience to question, for example, whether a chosen Python library for XML processing is best suited to the purpose. Similarly, a Hackystat service choosing a decentralized configuration management system such as GIT will
move toward a much different style of collaborative development than our traditional, Subversion-based procedures. This has organizational implications. The kind of decoupling introduced by SOA also means that certain kinds of “bindings” occur at runtime rather than at build-time or compile-time. This introduces new complexities into quality assurance, as certain kinds of inconsistencies are now found only during run-time testing. Such problems are made more difficult to catch due to the more decentralized and distributed nature of development.
5.3. SOA requires governance The novel forms of decoupling introduced by SOA leads to the need for new kinds of “governance” we did not previously require. For example, one group of developers embarked on a project to implement a new kind of low-level service that would effectively “collapse” functions spread across multiple services into a single layer. This service would improve performance for certain kinds of queries in certain kinds of situations, at the cost of modularity, consistency, and conformance to the underlying architectural principles that led us to SOA in the first place. As an open source project, our response to this situation was to try to carefully explain the pros and cons of their proposed approach, and then let them decide how to proceed. Governance, in our case, is an advisory process rather than a controlling process. The important lesson we learned is that SOA creates new kinds of coordination issues that simply did not exist in our prior architecture and corresponding development process and organization.
5.4. SOA creates performance challenges SOA creates opportunities for scalability by making it more simple to distribute and replicate services. For us, however, these scalability opportunities came with concrete performance costs, as discussed in Section 4.5. The performance implications of a move from clientserver to SOA is quite analogous to the move from a native client application to a web-based application. A native client application interacts with a user and accesses the local file system, which can normally be done quite quickly and reliably. Moving such an application to a client-server, web-based system means that user interactions now involve HTTP requests and the responsiveness of the application can easily be compromised. SOA takes it a step further: now a single
user interaction can potentially trigger a large number of HTTP interactions between multiple services. In our case, we addressed the performance challenge via a combination of a RESTful architecture, a set of caches, and the ability to pre-fetch analyses in order to keep the caches up to date.
5.5. SOA provides competitive advantage Our final lesson learned is that the move to SOA provides Hackystat with a significant competitive advantage over similar systems. SOA now allows us to enhance Hackystat using any language, not just Java. We can now build native client user interfaces that interface to web-based Hackystat services, allowing us to explore advanced 3D visualization. We can easily integrate with social networking platforms like Facebook and communication channels like Twitter. No other system in our domain seems as flexible, expressive, or plain fun to work with. Hackystat is no longer like a castle: a monolithic environment separated from the rest of the world by high ramparts that require users to come to it and interact on Hackystat’s terms. It is now resembles a fleet of sailing ships, able to explore new environments on their own terms and bring ideas from one culture to another. While setting sail has certain risks, after a year on the voyage we have yet to look back.
References [1] P. M. Johnson, “Requirement and design trade-offs in Hackystat: An in-process software engineering measurement and analysis system,” in Proceedings of the 2007 International Symposium on Empirical Software Engineering and Measurement, Madrid, Spain, September 2007. [Online]. Available: http://csdl.ics. hawaii.edu/techreports/06-06/06-06.pdf [2] P. M. Johnson, H. Kou, J. M. Agustin, C. Chan, C. A. Moore, J. Miglani, S. Zhen, and W. E. Doane, “Beyond the personal software process: Metrics collection and analysis for the differently disciplined,” in Proceedings of the 2003 International Conference on Software Engineering, Portland, Oregon, May 2003. [Online]. Available: http://csdl.ics.hawaii.edu/ techreports/02-07/02-07.pdf [3] R. T. Fielding and R. N. Taylor, “Principled design of the modern web architecture,” ACM Transactions on Internet Technology, vol. 2, no. 2, May 2002.