open source software. 1. ... from the research results and publications, and adding software to it to make the results .... noise ratio, we built custom amplifiers and preamplifiers. ... On a qualitative level, we can see three main advantages of re-.
EXPERIENCES WITH REPRODUCIBLE RESEARCH IN VARIOUS FACETS OF SIGNAL PROCESSING RESEARCH P. Vandewalle‡, G. Barrenetxea‡ , I. Jovanovic‡, A. Ridol¿‡, and M. Vetterli‡ § ‡
LCAV - School of Computer and Communication Sciences Ecole Polytechnique F´ed´erale de Lausanne (EPFL), CH-1015 Lausanne, Switzerland § Department of Electrical Engineering and Computer Science UC Berkeley, Berkeley CA94720, USA ABSTRACT How often have you been able to implement an algorithm as it is described in a paper? And when you did, were you con¿dent that you had exactly the same parameter values and results as the authors of the paper? All too often, articles do not describe all the details of an algorithm and thus prohibit an implementation by someone else. In this paper, we describe our experience with reproducible research, a paradigm to allow other people to reproduce with minimal effort the results we have obtained. We discuss both the reproducibility of data and algorithms, and give examples for each of them. The effort required to make research reproducible is compensated by a higher visibility and impact of the results.
It is also interesting to see how a similar concept was presented by Knuth in 1984 as ‘literate programming’ [13]. Instead of starting from the research results and publications, and adding software to it to make the results reproducible, he presented literate programming as a way of improving the documentation of programs: “Instead of imagining that our main task is to instruct a computer what to do, let us concentrate rather on explaining to human beings what we want a computer to do.” The result is very similar to what we have in mind as a reproducible research paper. 2. WHAT IS REPRODUCIBLE RESEARCH?
Index Terms— reproducible research, publishing, source code, open source software
De¿nition. A research work is called reproducible if all information relevant to the work is made available, that is, the publication, the data and code used to run experiments, produce ¿gures, etc.
1. INTRODUCTION
Typically, this requires some additional resources: a web page is required to host this information, and ideally an external person should verify the reproducibility of the results. Making a paper reproducible requires an additional time investment by the author. This investment is largely compensated, however, by its increased impact and the time gained when reusing some of the results later. Although code and simulations can generally be reproduced exactly, such requirements can often not be imposed for the experimental data. Due to complex setups and experiments that depend on physical conditions, noise, etc., the aim is to make this data rather ‘reusable’ than ‘reproducible’. It implies the publication of relevant datasets with clear documentation. This issue is discussed more in detail in Section 4.
Do you also feel frustrated when you read some of the current IEEE Transactions papers? Often, the optimal parameters for an algorithm are not given (nor is it said how to obtain them), or the precise setup for an experiment is left out. This makes it very dif¿cult to get a good feel for the obtained results, and prohibits a direct comparison with other methods. The frustration is probably just as large (both for you and your reader) when you get a question about that paper you wrote a few years ago. You would really like to help the reader of your paper, but cannot ¿nd the precise parameters anymore with which you created that nice ¿gure. Sounds familiar? Then please read further, and look into reproducible research. The term ‘reproducible research’ was (to the best of our knowledge) ¿rst introduced about ¿fteen years ago by Claerbout and his colleagues at the Stanford Exploration Project [1, 2]. They have developed Unix/Linux make¿les to build, destroy, and clean all their results. These ideas were applied to wavelets by Donoho and his colleagues [3], using Matlab. Recently, reproducible research drew people’s attention in various domains, such as neurophysiological data analysis [4], econometrics [5, 6] and epidemiology [7]. In signal processing, a paper by Kovacevic describes the relation between publishing and reproducible research [8], Vandewalle et al. discuss the use of standard datasets and dataset competitions [9], and Fomel and Hennenfelt describe a practical implementation using SCons [10]. Two case studies are presented by Marziliano [11] and Barni et al. [12]. The work presented in this paper was supported by the National Competence Center in Research on Mobile Information and Communication Systems (NCCR-MICS, http://www.mics.org), a center supported by the Swiss National Science Foundation under grant number 5005-67322.
1424407281/07/$20.00 ©2007 IEEE
3. GOAL OF REPRODUCIBLE RESEARCH Simply stated, the goal of reproducible research is to have more impact with our research! Historically, various communities have developed different cultures on how to interact and advance the state of the art in their ¿eld. From eighteenth century mathematicians sending each other open problems as challenges, to peer-reviewed publications and now online publications, the know-how transfer has evolved tremendously. Currently, different ¿elds have different practices, with different effects on their productivity and visibility. Life sciences tend to have very selective publications but with fast turnaround. Preprint archives are popular in physics and mathematics. Engineering, and electrical engineering in particular, have slow turnaround, and relatively low selectivity. The result is that impact factors of even the leading IEEE
IV 1253
ICASSP 2007
journals are low (an order of magnitude less than top journals in life sciences). We believe that part of the problem is the “non reusability” of some of the research results in our ¿eld, and the fact that �p , the least publishable increment, is small. Making research results reproducible raises the bar of what can be published, and how. While in the short term, this can make life a bit harder, in the long run, it will increase the visibility of the ¿eld and its impact. Thus, beyond the fact that it is a sound practice and essential for good science, it will help the researcher and his/her research community as well. 4. DIFFERENT PARTS OF REPRODUCIBLE RESEARCH The research conducted in our lab can be decomposed in three main categories: theoretical work, development of new algorithms, and experiments with real data. We will now discuss each of these components separately, as each of them imposes different conditions for reproducibility. The reproducible papers published at LCAV are available online at http://lcavwww.epfl.ch/reproducible research. 4.1. Theory The theoretical part of research is probably the easiest part to make reproducible. Once the theorems and proofs are well described, a reader should have no problem in reproducing the results (proofs) himself, using the paper. Of course, each step in a proof should be clear, and no intermediate steps should be skipped as ‘left to the reader’. Still, many theoretical results gain in being illustrated by numerical simulations. Examples are given by the work on sampling of sparse signals [11] and the power spectrum formula of pulse modulations for ultrawide bandwidth transmissions. Example 4.1 (Spectrum of Ultrawide Bandwidth Signals). Using a rigorous mathematical approach based on the point process formalism, the works [14, 15] provide a unifying general exact formula for computing the power spectrum of the large family of pulse modulated signals employed in ultrawide bandwidth trasmissions. As well as providing the detailed mathematical proof of the formula, the authors made Matlab code available that computes the power spectrum of several con¿gurations of pulse modulations, including multiuser scenarios. Distributed under the GNU Public Licence - GPL [16], the code allows the user to simulate any ultrawide bandwidth transmission by specifying the parameters of the pulse modulation, the multiuser signature, and the errors affecting the transmission, such as the jitter or the losses. It is therefore possible to extensively test the formula and, with the help of a script, exactly reproduce the results provided by the authors. Code lines are well documented and there is a detailed instruction manual that explains how to run the code. 4.2. Algorithms A large part of our work is concentrated around the development of new algorithms. Three items are required to make this part of the research reproducible. First of all, the environment has to be speci¿ed in which the algorithm runs. This can be a piece of software (Matlab, network simulators), or a compiler. If a compiler was used, it is important to mention also the compiler Àags. Although the algorithm is typically platform/hardware independent, it is useful to also specify the version and platform/hardware on which the algorithm was tested. Second, the code for the algorithm has to be given. This
code must be well documented, such that it is readable for another user. And ¿nally, the data are required on which the algorithm was tested. We will now illustrate this for an example. Example 4.2 (Super-resolution). The super-resolution algorithm presented in [17] is written in Matlab. The code was tested in Matlab 7.0.1 under Linux. We have made Matlab scripts such that each ¿gure or table can be easily reproduced by running the ¿gure x.m or table y.m ¿les, respectively. In cases where we used random numbers, we speci¿ed the starting state of the random number generators to obtain exactly the same result each time. Next to the documentation per function in each ¿le, a ‘Readme’ ¿le is also added, describing the behavior of each of the ¿les. The code for the implemented algorithms and the data used for testing are available online and are distributed under the GNU Public License. A full resolution version of the important ¿gures is also given. This allows readers to verify that the aliasing was accurately removed, which is not always clear from a printed version of the paper. For this paper, a graphical user interface was also developed in Matlab where the different algorithms that are compared in the article can be tested. This makes it easier for other people to use the implemented algorithms for their own purposes, analyze these algorithms on other data, and compare their own algorithm with the implemented ones. 4.3. Data and experimental setups Some research projects require the use of particular datasets that are dif¿cult to obtain. As a ¿rst step, these projects usually involve the design of a data acquisition system. Due to the complexity and cost of the necessary setup, these systems are typically hard to reproduce. In such cases, a detailed description of the measurement setup is required, which might not ¿t into the limited space available in a paper. The article might contain a brief description of the setup, with a pointer to a web page containing more details. It is important to describe the setup in as much detail as possible, as to allow an interested reader to build the setup himself and perform the same type of experiments if desired. Any speci¿c setup or calibration procedures should also be well described. However, even if exactly the same setup is reproduced, the data acquisition process often depends on unpredictable external factors such as the physical conditions. Therefore, the exact measurements are almost never reproducible. It is then important to make them reusable: make the data available and useful to anybody. Other researchers should be able to analyze or process the data without having to worry about the acquisition system. To do this, one needs to produce relevant datasets and make them publicly available along with some clear documentation. Example 4.3 (Environmental study). A good example of such an experimental setup is the SensorScope project [18]. It consists in a large scale wireless sensor network deployed on the EPFL campus. The sensors measure key environmental quantities such as temperature, humidity, soil moisture, wind speed and direction, solar radiation, infrared temperature, and precipitation. All these data are necessary to study the energy exchanges and balances at the earth/atmosphere boundary. This project required the design of an environmental sensing platform as well as the deployment and maintenance of a wireless network. Even if all the speci¿cations are available online, special emphasis is given to the data. A database and web interface were developed to clearly organize and present the data (see Figure 1).
IV 1254
(a)
(b)
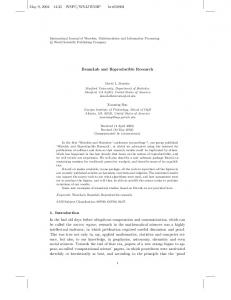
Fig. 2. For our super-resolution work, we used a Sigma SD10 camera (a). We measured its spatial frequency response to verify that images are aliased (b). follow up the experimental research. To this end, the setup is mostly assembled from commercially available components. To boost the signal into the range of these components, we needed to amplify the signal and compensate for the relatively modest power levels. In order to meet the tight speci¿cations of the bandwidth and signal to noise ratio, we built custom ampli¿ers and preampli¿ers. The complete schematics and PCB layouts are available online and can be used in various applications. Fig. 1. In the SensorScope project, the web page makes all the data available together with a complete documentation of each environmental sensing platform: exact location, picture, mounted sensors, and con¿guration parameters.
All the collected data are available online, including a clear documentation about the exact conditions under which the measurements were taken: precise sensor location, sensor speci¿cations, and maintenance data. The objective is to encourage other scientists to use this data for environmental studies. Example 4.4 (Super-resolution). For our super-resolution work, and much of the image processing research in general, the experimental setup is much easier to reproduce. We can simply specify the model of the camera that was used, and the circumstances under which the pictures were taken. In our super-resolution experiments, we worked with a Sigma SD10 digital camera. We measured the spatial frequency response of this camera to show that captured images contain aliasing, and thus satisfy the setup required in our algorithm (see Figure 2). This completely describes the experimental setup. However, even in such a case, the data (images) cannot be exactly reproduced. Variations in the scene, lighting, and the random noise in the camera will make it virtually impossible to take the same picture at another time. Next to the detailed setup, we have therefore also put the images online that were used in the experiments [17].
Example 4.5 (Acoustic tomography). In our lab, we are also developing a new acoustic tomography method for measuring wind Àow and temperature distribution [19]. This project is one of the many examples where real data are needed to assess the quality of the proposed algorithms. The lack of such data motivated us to build an experimental setup (see Figure 3). Next to the ability to test our method on real data, this setup has two other bene¿ts. First, the online availability of the data, with a detailed description of the calibration process and the acquiring procedure, is greatly appreciated by the researchers working on acoustic tomography. Second, the well documented hardware will encourage an interested reader to
(a)
(b)
Fig. 3. Acoustic tomography project. (a) Experimental setup. (b) Custom-built ampli¿er.
5. IMPACT OF REPRODUCIBLE RESEARCH The merit of making research reproducible is very hard to quantify because of the small scale at which it is currently available. Once such research is available on a larger scale, it would be interesting to perform a study like the one by Lawrence about the online availability of publications [20]. He showed that papers that are available online are cited about three times more often than papers that are not online. We believe that a similar argument holds for reproducible papers as compared to non-reproducible papers. Reproducible papers have an increased visibility and interactivity, which will (probably) increase their use by other researchers. On a qualitative level, we can see three main advantages of reproducible research. First of all, it largely simpli¿es work for ourselves in picking up previous work again. The online availability of our code has also facilitated some interesting collaborations. Second, reproducible research is of great help for people getting started in a certain domain. Instead of starting from scratch (or by reimplementing some unprecise papers), researchers can truly start from the existing state of the art. Readers downloading our software have already sent us very grateful e-mails about this. Moreover, their comments have allowed us to remove some errors in the Matlab implementation of one of the super-resolution methods. And third, and probably most important, it increases the visibility and the reliability
IV 1255
of our work. For example, our super-resolution code is downloaded each month by about 250 interested people. This visibility will give research that is reproducible a higher impact in the signal processing community, as well as towards researchers in other domains. Environmental sciences for example are often considered as “theory-rich, but data-poor”. Using sensor networks such as SensorScope, we can give them access to some very valuable datasets.
[1] M. Schwab, M. Karrenbach, and J. Claerbout, “Making scienti¿c computations reproducible,” Computing in Science & Engineering, vol. 2, no. 6, pp. 61–67, Nov. 2000. [2] J. Claerbout, “Electronic documents give reproducible research a new meaning,” in Proc. 62nd Ann. Int. Meeting of the Soc. of Exploration Geophysics, 1992, pp. 601–604. [3] J. B. Buckheit and D. L. Donoho, “WaveLab and Reproducible Research,” Tech. Rep. 474, Dept. of Statistics, Stanford University, 1995, [Online] http://www-stat.stanford.edu/ ∼donoho/Reports/1995/wavelab.pdf.
6. DISCUSSION 6.1. Software licenses Many different types of licenses exist under which software can be made available. Among these, two main classes can be distinguished: open source and proprietary source software. The GNU General Public License (GPL) is the most popular open source license. The primary difference with other free software licenses is that it requires derivative works of GPL-licensed programs to be also licensed under the GPL. Other common licenses for free software are the BSD license, the MIT license (also called X License) and CPL (Common Public License).
[4] C. Pouzat, “Reproducible neurophysiological data analysis?,” 2006, [Online] http://www.biomedicale.univ-paris5. fr/physcerv/C Pouzat/Compendium.html. [5] R. Koenker, “Reproducible Econometric Research,” Tech. Rep., Department of Econometrics, University of Illinois, Urbana-Champaign, IL, 1996. [6] H. D. Vinod, “Care and feeding of reproducible econometrics,” Journal of Econometrics, vol. 100, no. 1, pp. 87–88, Jan. 2001. [7] R. D. Peng, F. Dominici, and S. L. Zeger, “Reproducible Epidemiologic Research,” American Journal of Epidemiology, 2006. [8] J. Kovacevic, “How to encourage and publish reproducible research,” in Proc. ICASSP, April 2007.
6.2. Environments and platforms The platform requirements on which the code can be run should be kept as open as possible. Ideally, only a standard computer and open source software (such as R, Octave, or SciLab) should be used. In practice we also make use of some widely used commercial packages like for example Matlab. However, on this topic, it is also important to mention that R provides the Àexible framework Sweave1 for mixing LATEX text and R code to automatically create reproducible electronic documents: a step forward for reproducible research!
[9] J. Vandewalle, J. Suykens, B. De Moor, and A. Lendasse, “State of the art and evolutions in public data sets and competitions for system identi¿cation, time series prediction and pattern recognition,” in Proc. ICASSP, April 2007. [10] S. Fomel and G. Hennenfent, “Reproducible computational experiments using scons,” in Proc. ICASSP, April 2007. [11] P. Marziliano, “Reproducible research: A case study of sampling signals with ¿nite rate of innovation,” in Proc. ICASSP, April 2007. [12] M. Barni, F. Perez-Gonzalez, P. Comesa˜na, and G. Bartoli, “Putting reproducible signal processing into practice: A case study in watermarking,” in Proc. ICASSP, April 2007.
6.3. Reproducible research and commercialization Who cares about making research reproducible when setting up a start-up? Well, we do, as one of its advantages is also to inform a larger audience about our new methods! However, just like with patented work, or work done in collaboration with industrial partners, it may not be possible to publish the entire code (and/or data) due to copyright or con¿dentiality issues. Instead of publishing the code, we have therefore worked out an online system where a user can submit data to be processed by the algorithm on our server. The user can choose his own data, set the parameters of the algorithm, and receives the processed data in return. Although this does not allow to look at the code and reproduce the results on the user’s side, it does allow for tests on other datasets and comparisons of the results with the user’s methods. 7. CONCLUSIONS In this paper, we have presented our experience with reproducible research over the past years. We split the typical research framework in three categories: theory, algorithms, and experimental setups. Theory and algorithms can be directly made reproducible, while the measurements from experimental setups are typically rather reusable than reproducible. This is due to the nature of the experiments, depending on the physical conditions and the random character of the noise. A big advantage of reproducible research is its increased impact, both within the signal processing community and towards other communities. 1 http://www.ci.tuwien.ac.at/∼leisch/Sweave/
8. REFERENCES
[13] D. E. Knuth, “Literate Programming,” The Computer Journal, vol. 27, no. 2, pp. 97–111, May 1984. [14] A. Ridol¿ and M. Z. Win, “Ultrawide bandwidth signals as shot-noise: a unifying approach,” IEEE J. Select. Areas Commun. Special Issue on UWB Wireless Communications - Theory and Applications, vol. 4, pp. 899–905, 2006. [15] A. Ridol¿, Power Spectra of Random Spikes and Related Complex Signals, with Application to Communications, Ph.D. thesis, Ecole Polytechnique F´ed´erale de Lausanne - EPFL, 2004. [16] GNU, “GNU General Public License,” 1991, [Online] http://www. gnu.org/copyleft/gpl.html. [17] P. Vandewalle, S. S¨usstrunk, and M. Vetterli, “A Frequency Domain Approach to Registration of Aliased Images with Application to SuperResolution,” EURASIP Journal on Applied Signal Processing, Special Issue on Super-Resolution Imaging, vol. 2006, 2006, Article ID 71459, 14 pages, [Reproducible] http://lcavwww.epfl.ch/ reproducible research/VandewalleSV05. [18] SensorScope, epfl.ch.
“SensorScope project,” http://sensorscope.
[19] I. Jovanovic, L. Sbaiz, and M. Vetterli, “Acoustic tomography for estimating temperature and wind Àow,” in 13th Internat. Symp. for the Advancement of Boundary Layer Remote Sensing, 2006, pp. 69–71, [Reproducible] http://lcavwww.epfl.ch/ reproducible research/JovanovicSV06/. [20] S. Lawrence, “Free online availability substantially increases a paper’s impact,” Nature, vol. 411, no. 6837, pp. 521, 2001, [Online] http://www.nature.com/nature/debates/ e-access/Articles/lawrence.html.
IV 1256