the users in order to improve and adapt the Internet search engines to their users. ..... gratis. 1289. 1.102% gran hermano. 470. 0.655% fotos. 908. 0.776% mp3.
Experiencies retrieving information in the World Wide Web Fidel Cacheda, Ángel Viña Departamento de Tecnoloxías da Información e das Comunicacións Facultad de Informática, Universidad de A Coruña Campus de Elviña s/n, 15071 A CORUÑA, SPAIN Telephone: +34-981-167000 Fax: +34-981-167160 Email: {fidel, avc}@gris.des.fi.udc.es Abstract. In this paper, using the information obtained from the daily working of a Web directory, we attempt to expand the knowledge about the behaviour of the users in order to improve and adapt the Internet search engines to their users. We have analysed more than 320,000 requests of the transaction log of a Spanish Web directory, focusing our attention, firstly, in the searches in order to confirm the main differences between Internet and traditional Information Retrieval systems. Furthermore, we have developed an exhaustive statistical analysis of searches, categories visited and documents viewed to achieve a mathematical pattern of behaviour for each one, and what it is more important, to establish a relationship between the variations in the behaviour of each one.
NOTE: This work has been partially supported by PGIDT 99PX11050/B.
1
Introduction
Recently there have been some studies that examine the behaviour of Web search users while they are using an Internet search engine or a directory, where they demonstrate that Web users differ significantly from users of traditional Information Retrieval systems. The first study was performed by Kirsh who, at the beginning of 98, presented some search statistics of Infoseek usage in [3]. A bit later, Jansen et al. presented a study of queries, sessions and searched terms obtained in the query logs of Excite [1]. Silverstein et al. examined a very large number of queries taken from Altavista logs in [2], studying not only the queries but also the correlations among them. In the present paper we have two main objectives. The first one is to confirm and research new differences between the Web users and the users of traditional information retrieval systems. The latter one is possibly more interesting because it analyses a newer aspect of the Information Retrieval in the World Wide Web: the behaviour of the users (considering them as a whole group) using an Internet information retrieval system. This will allow us to answer some questions, such as how often a query is requested to the system, which distribution, if any, does the queries best fit in, if the browsed categories and the retrieved documents fitted the same distribution as queries, and what is more important, if there is any relationship between the requested queries and the browsed categories and/or the retrieved documents. This research will be done by using the transaction log of a Spanish Internet Directory called BIWE (Internet Searcher of Spanish Webs), through several days. This transaction log stores information about all the queries performed to the system, all the categories browsed by the users, all the retrieved documents and the time and date when each of the actions happened. In the next section we describe the BIWE search environment and the transaction log. In Section 3 we analyse in detail the searches and the behaviour of the users searching. The following sections obtain a mathematical model for searches, categories visited and documents viewed and the relationship among them. Finally we conclude in Section 6.
2
The search environment
Our study is based on a Spanish Internet directory called BIWE. In the next sections we
will describe the Web directory itself, which is accessible from the web page http://www.biwe.es, and the transaction logs, which store information about what, when and how the users have accessed to the directory.
2.1 The directory and the search engine BIWE is a Web directory which content is made up of web pages written in Spanish. A directory is a hierarchical taxonomy that classifies human knowledge [4]. Therefore, a Web directory is a hierarchical taxonomy that classifies the information that we can find in the World Wide Web and, in our case, restricted to the information written in Spanish. There are two ways of obtaining information from a directory: by browsing its categories or by searching its content. If a user browses through the categories of BIWE he will find out that the same category could be located in several places (because the hierarchical taxonomy is a graph and not a tree) and that not only are web documents in the final categories but also in the middle ones. On the other hand, if a user searches in BIWE he will find out that both categories and web pages are showed as a result of a search. The BIWE search engine is based on a weighted vectorial search. The simplest query consists of a collection of words which are ORed together, but the ranking algorithm will place in the first places the documents that best match the AND. There are some simple operators that could be used instead of Boolean expressions: -example instructs the search engine to ignore documents containing example; +example instructs the search engine to ignore documents not containing example. Also, the “ operator can be used to enclose phrases; thus, the search operation will be equivalent to a logic AND. Similarly, the common Boolean operators can be used in a query. Therefore, the operators and, or, not (and their translation into Spanish) are interpreted as Boolean operators, also including the parenthesis. All these operators (simple and Boolean) can be used simultaneously and mixed, just by using the parenthesis to divide the simple and the Boolean operators. By default, the search engine will examine all the documents of the directory, although it is possible to restrict the search to some categories (and its descendants) just by selecting this option before searching. Moreover, BIWE has a detailed search (which is accessible through a link) where the
user can control some aspects of the search. For instance, some check boxes are used to select the fields of the documents (BIWE stores four fields for each document: title, description, URL and some keywords) where to search (by default, title, description and the keywords). A pull-down menu allows the user to choose the number of results per page and a radio button selects how to group the results: by categories, without grouping but with categories information or just without grouping (this is the default option). We use the term search string to denote the exact query that the user has entered and the expression search term to denote each of the words of the search string once the Boolean operators, the reserved words and the stopwords1 have been removed. After a search string is entered and the search terms are processed, BIWE returns a screen filled with 10 URLs (or the number previously selected by the user) showing the title and the description of each URL. All the URLs are ranked in order of importance to the query. The user may click on any URL to explore the associated web page. In addition, the user may click on the navigation buttons to explore other screens with more results; this process will submit another query to the search engine requesting the specified documents.
2.2 The transaction log The BIWE transaction log stores all the requests sent to the directory. There are three types of requests: a query, a category exploration and a document exploration (obtained searching or browsing). For each type of request different information is stored. If the request is a query the following fields are stored (we only show the relevant ones): • The search string, exactly as it was submitted. • The search terms, once the stopwords, the reserved words and all the operators have been removed. • A timestamp indicating when the query was submitted. • The number of the first document to show in the results screen. • The number of documents to show in the screen. • A Boolean field that registers whether the search is restricted or not to a category. And if it is, the identification of the category is also stored. 1 Very common words that do not add information to the query
• The fields of the documents where the search will be performed. • The type of the document grouping, if any. If the request is a category exploration just two fields are stored: • The category identification of the category that is visited (each category of the directory is identified by an unique number). • A timestamp indicating the moment of the request. For the third type of request, a document exploration, the fields stored are similar to the latter: • The document identification (each document of the directory is identified by an unique number). • A timestamp indicating when this document was visited. The whole data set is summarized in Table 1. The requests were collected during 16 days, from 3 May 2000 at 15:00 to 18 May 2000 at 7:00. They include all the requests received by BIWE over this period of time. Table 1: Statistics transaction log contents
summarizing
Total number of requests Total number of queries Total number of categories visited Total number of documents viewed
the
324,503 105,786 61,050 157,667
3 Analysis of queries In this section we are going to study in depth the 105,786 queries submitted to BIWE, in order to obtain a better knowledge about the behaviour of Internet users. An important characteristic of the behaviour of the Web users in Internet search engines is the number of screen results that they usually check. This information is showed in Table 2, where we list the number of screen results viewed by the users and the percentage of queries associated with each one. In the first row of this table we can see that almost 68% of queries correspond to the first result screen, and more than 81% of all the queries correspond to the first two screens. This points to the fact that most Web users will check only one or two results screens. In fact, on average each user will check 2.18 results screens. This shows how important are ranking algorithms in Internet information retrieval systems and how different
could be Web users from traditional users (as showed in all the previous works). On the other hand, the lower percentages of the results screens viewed correspond to the higher values (over 20 screens, less than a 0.1% of queries in each case). A special mention has to be done to the 80 queries (0.077% of all the queries) that reached the screen number 35 (which corresponds to the maximum number of results allowed in BIWE), but possibly the users arrived there without checking the previous 33 results screens. Table 2: Results screens viewed by the users Screens viewed 1 2 3 4 5 6 7 8 9 10 More
Percentage 67.881% 13.234% 5.966% 3.468% 2.272% 1.538% 1.119% 0.819% 0.598% 0.49% 2.615%
Silverstein et al. in [2] point that the use of all the queries could lead to an upweight of the searches with many result screens. For this reason, we have calculated these statistics using
merely the 71,810 searches corresponding to the first screen results. The first part of our analysis is focused in the search strings and the search terms of the queries that produced the first screen results. We have studied 71,810 search strings, 26,654 of which were different. These search strings were made up of 116,953 different search terms, but only 18,966 were unique words. The 25 most popular queries and search terms are nearly the same as considering the whole queries, except a few changes in the order among them (anyway, the empty query remains as the top one). In Table 3 we can see that each search string has been searched 2.7 times and each term has been searched 6.2 times. These values are a bit smaller than the means obtained considering all the queries. On the other hand, in Table 4 we show the percentages of query duplications for search strings and search terms (these percentages have been calculated using the total amount of search strings and terms: 71,180 and 116,953, respectively). In [2], Silverstein et al. conclude that two-thirds of all the queries are asked only once, just considering the percentage in relation to the unique queries, which can lead to erroneous conclusions. Actually, we have calculated that only 23.4% of all the queries are asked only once, and the main amount of queries are searched many times, because the median value shows that a small amount of queries (9.34%) causes the half part of all the requests.
Table 3: Search strings and search terms statistics, with only first screen results queries Search strings Search terms Total number 71,810 Total number 116,953 Unique search strings 26,654 Unique search terms 18,966 max search string frequency 1,452 max search term frequency 1,429 avg search string frequency 2.69 avg search term frequency 6.17 stddev of search string frequency 12.27 stddev of search term frequency 25.77 Table 4: Search strings and search terms duplication statistics, with only first screen results queries Search strings Query occurs 1 time Query occurs 2 times Query occurs 3 times Query occurs > 3 times
Search terms Total 23.4 % 12.13 % 7.64 % 56.83 %
Term occurs 1 time Term occurs 2 times Term occurs 3 times Term occurs > 3 times
Total 7.74 % 5.1 % 3.99 % 78.16 %
Table 5: The 15 most popular search strings and search terms Search strings sexo gran hermano mp3 gay porno chat relatos eroticos hentai famosas desnudas moviles famosas sexo gratis amateur .... orihuela (median 2,490/26,654)
Frequency Percentage 1452 2.022% 564 0.785% 470 0.655% 446 0.621% 418 0.582% 222 0.309% 195 0.272% 173 0.241% 166 0.231% 162 0.226% 158 0.220% 156 0.217% 142 0.198% 138 0.192% 5
0.007%
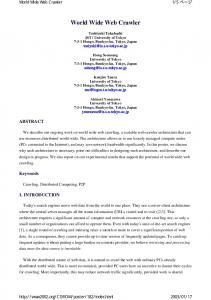
With regard to the search terms, the conclusions are also very similar to the previous case. The median is also quite small (4.5%) and the percentage of search terms asked only once is 7.74% versus the 23.4% in the case of search strings. This indicates that many queries ask for the same subject, although using some different words, but main search terms are common to many queries. In Figure 1 we can check the differences of the two analyses: the search strings and the search terms, but considering only the queries of the first screen result.
Figure 1: Search terms and search strings incremental percentage, using first screen results queries With regard to the number of operators used in queries, in Table 6 we can find a summary. The main conclusion is that logic operators are little used in queries. Also, this under-utilization is present in [1] and [2], and suggests that web users do not have the basic knowledge of Boolean logic.
Search terms Frequency Percentage sexo 1429 1.222% gratis 1289 1.102% fotos 908 0.776% gay 819 0.700% mp3 802 0.686% desnudas 695 0.594% gran 583 0.498% porno 560 0.478% hermano 557 0.476% madrid 518 0.443% famosas 468 0.400% videos 432 0.369% moviles 381 0.326% com 361 0.309% .... champions 24 0.021% (median 867/18,966) Table 6: Logic operators usage statistics, with only the first screen results queries Spanish AND operator: Y AND operator Spanish NOT operator: NO NOT operator Spanish OR operator: O OR operator parenthesis + operator - operator " operator
4.164% 0.362% 0.024% 0.0006% 0.033% 0.014% 3.513% 2.055% 0.826% 3.64%
The most used operator is the Spanish AND operator, Y, followed by the “ operator. With a lower percentage, the + and – operators are the next ones. This points to the idea that users tend to use the logic operators of their mother language, probably without realizing it and they could easily use non logic operators. This fact is even stronger if we consider that 3.44% of the queries use a combination of logic operators with parenthesis (nearly all the queries that use parenthesis). The rest of the parameters are quite underused. For example, 2.6% of the searches where restricted to a specific category and the parameters of the detailed search (searched fields, number of results per screen and grouping results) are modified in very few cases (less than 0.3%, except a specific parameter that was modified by a robot); consequently the users tend to use the default values.
With regard to void queries, only 0.5% of all the queries of first screen results have got syntactical errors or do not have significant words (i.e. because the user typed in the search string only stopwords). A special mention it requires the empty string, because it is the top searched query with more than 2% of the first screen queries. Finally, we want to examine an important characteristic of the searches in Internet, which initially, it has never been analysed: the number of results obtained in the searches. Therefore, as an additional experiment, we have repeated all the 26,654 queries performed by the users and checked the number of results obtained in each one. On average these queries get 154 results, but the standard deviation is 153.6, which means that the fluctuation is very high. In fact, one third of the searches get more than 350 results (this is the maximum number of results showed by BIWE) and 16% of the queries don’t get any. These are the two top number of results per query and after them, the frequency decreases quickly, for example, the next one are the queries with only one result which are the 4.3%. Nevertheless, these statistics only take into account the unique queries, but if we consider the whole 105,786 queries and their number of results the statistics are a bit different. On average users get 170.7 results per query (with a standard deviation of 148). One third of the whole queries find more than 350 results, and then the frequencies start to change: only 7.1% of the queries get none result, only a 2.3% of the queries get one result. And now there is an important change: more than 2% of the queries are wrong queries, which are produced mainly due to the empty string query, which is repeated more than 2000 times. In summary, a main part of the queries get more than 350 results which shows that these queries are fuzzy and the users should retype the queries using more concrete words. And there are, also, an important amount of queries that don’t get any result probably due to a mistype error or because the query is too much specific.
4
Distribution of queries, categories and documents
In the next part of our analysis we will study in depth the queries requested to the system, the categories browsed by the users and the documents retrieved by them, but related with the time when they were produced. In this way, we will investigate how often a query is requested to the system and if the frequency is static or otherwise, the frequency changes
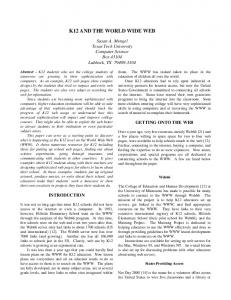
during time. Also, we will determine if this could fit any statistical distribution, both for queries, categories and documents. Firstly, we will study the searches and their distribution over time. In order to make this research we will consider both the frequency of the queries and the number of queries per unit of time (hours, minutes, etc.). In Figure 2 we can see the searches per hour through the whole period analysed.
Figure 2: Searches per hour On average every 11.62 seconds a query is sent to BIWE, but this information is not very useful because in Figure 2 we can observe that the number of queries per hour is very fluctuating. During the rush hours the highest frequency is reached, but during night hours the frequency falls to the lowest values. This suggests that the distribution of the searches is variable and that a deeper analysis should be made. The information available for each search request is the time and date when the query was requested to the system and we have worked out the number of seconds since the previous search. In the transaction log we have stored 105,786 queries during 16 days (actually, there is an empty period of some hours in the 12th day), which means that the amount of information is quite high but very little practical. Therefore, we have decided to calculate the number of queries per minute during the whole period, obtaining on average 5.16 queries per minute, during 20,470 minutes. Taking this into account, the distributions that seem to fit best the series of data are a Poisson or a Normal, but the main problem is that the mean of the distribution is variable through the time. At this point there are several possible analyses. We could have used time series to remove the periodical components of the queries but we could not have gotten useful information about the distribution of the queries through time. On the other side, we have tried to obtain similarities among the different days of the series using contingency tables, but the
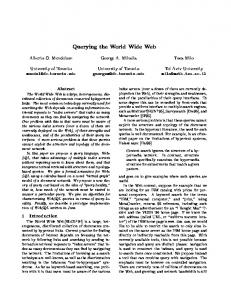
results didn’t show any clear relationship among them. In this analysis we built a table with the days (Monday, Tuesday, etc.) in the rows and hours in the columns and the number of queries in each cell, and using the Chi-Square test we were looking for any similarity among the days of the week. Although at first glance it seemed that the working days could have the same behaviour unfortunately, there wasn’t any relationship among the queries performed during the days,. This similarity was not statistically significant. In summary, we were analysing a series in which the distribution was probably always the same, but the parameters are variable. Therefore, we resolved to divide the series in small periods of an hour and we studied the queries performed during each hour independently, in order to obtain the distribution and the parameters of all of them. The decision of choosing periods of one hour was taken because we needed a period of time big enough to have sufficient data and, it should be small enough to not have the influence of other series, that could distort the parameters and the distribution analysed. Indeed, in the contingency tables analysis no relationship was found among hours. If we had chosen periods of 30 minutes, for example, the number of data could not be significant enough for the distribution fitting tests, and on the other side, if we had chosen periods of 2 hours there could be two different distributions mixed. Consequently, we built 340 distributions of 60 elements each one, representing the random variable: “Number of searches during one minute” and we used the Kolmogorov-Smirnov test to check if these distributions fitted the Normal or the Poisson distributions. The results showed that in 93.5% of the cases we could accept that the distribution was a Poisson and in 85% of the cases we couldn’t reject that the distribution was a Normal, in both cases, with a P-value of 0.01. Due to the fact that in most of the cases the Poisson distribution can be accepted, and because the distributions studied are discrete, we assume that the random variable “Number of searches during one minute” are Poisson distributions, but with a variable mean through time, that fluctuates from λ=0.36 to the maximum value of λ=11.28 searches per minute. Continuing with the analysis, in Figure 3 we can observe the browsed categories and their distribution through time. This distribution seems to be quite similar to the distribution of the searches because we can find the same peaks and valleys corresponding to the maximum and lowest frequencies.
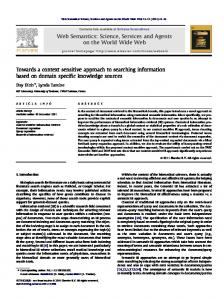
Figure 3: Browsed categories per hour Therefore, we decided to apply the same method as in the previous case. We have calculated the number of categories browsed per minute during the whole period analysed and, we have divided the series into individual series of one hour each one. As a result, we obtained 340 distributions with 60 samples in each one, corresponding to the random variable: “Number of browsed categories per minute”. We used the Kolmogorov-Smirnov test to check if each one of the 340 distributions could be a Poisson or a Normal distribution. The results showed than in 82.4% of the cases the distributions could be considered Poisson distributions and in only 57.4% of the cases we could assume that they fitted a Normal distribution, with a P-value of 0.01 in both cases. As in the previous analysis, we can assume that the random variable “Number of browsed categories during one minute” are Poisson distributions, also with a variable mean that, in this case, varies from λ=0.1167 to λ=7.9 browsed categories per minute. Finally, the case of the documents viewed by the users while they are using the Web directory is quite similar to the previous ones. In Figure 4 we can examine the viewed documents and their distribution through time, and corroborate the similarities among the three distributions.
Figure 4: Viewed documents per hour In order to analyse this series of data, we have divided the whole series in smaller
distributions of one hour each and during each hour we have counted the number of documents viewed per minute. As a result, we joined, as in the previous cases, 340 random variables with 60 samples in each one. For each random variable, we applied the Kolmogorov-Smirnov test to all these distributions and the results obtained indicated that in 87.1% of the cases we can assume that the distributions fit the Poisson distribution and in 94.7% of the cases the Normal distribution, with a P-value of 0.01. In this case, the percentage of Normal distributions is higher than the percentage of Poisson ones, but due to the fact that the random variable analysed is discrete and the number of variables that can be a distribution of Poisson is quite high, and mainly, in order to keep the coherence with the previous analysis, we decided to consider the random variable “Number of viewed documents per minute” as a Poisson, with a variable mean through time, starting with λ=0.15 and with a maximum value of λ=16.017 documents viewed per minute. Lastly, from the first part of our analysis we conclude that the number of searches, the number of browsed categories and the number of viewed documents per minute are, all of them, distributions of Poisson with a variable mean. But, these Poisson distributions can be changed into Exponential distributions, specifically into these ones: “Time spent between searches”, “Time spent between browsed categories” and “Time spent between viewed documents”, also with a variable mean through time. Using these continuous distributions we can obtain a measure of how often are queries, categories or documents requested to the system. For example, using the maximum λ values obtained, on average every 5.3 seconds a query is requested, every 7.6 seconds a category is browsed and every 3.7 seconds a document is viewed, in the Web directory studied during the rush hour.
5
categories respect to the means of the searches performed, which is represented in Figure 5.
Figure 5: Browsed categories per minute vs. searches per minute In the figure above we can observe that there is a clear relationship between searches and categories, because as the number of searches per minute raises the number of browsed categories per minute increases as well. Therefore, we have used a regression analysis with the purpose of obtaining the exact relationship between them, considering the searches as the independent variable. First of all, in the Figure 5 we can discern that the variance of data is not constant; therefore we have applied one of the transformations of the Box-Cox family. Next, we have detected some atypical data, which were removed to avoid distortions in the analysis. In the following step, we selected some models that could fit best the data: the lineal, the logarithmic and the quadratic.
Relationship among searches, categories and documents
Once we have fixed that the number of searches, browsed categories and viewed documents can be considered a distribution of Poisson, with a variable λ through time, we are going to analyse if there is any relationship among the means of the three different random variables. In order to carry out this study, we have got 340 values for each random variable, corresponding to the means calculated in the previous section. To begin with, we will analyse the relationship between the means of the browsed
Figure 6: Models for categories-searches relationship In the figure above we can observe all these models and their fitting to the original data. The lineal model doesn’t seem to fit the data properly, especially in the higher values where this model tends to over-estimate the number of browsed categories. Next, the logarithmic and
the quadratic models seem to be very similar, but the quadratic model for higher values of searches will decrease the number of categories. Consequently, we have calculated the ANOVA table for the logarithmic model and we achieve the following relationship: ln(y) = 0.8416 * ln(x) – 0.3128 y = 0.7314 * x 0.8416 Where x is the number of searches per minute and y is the number of browsed categories per minute. The Kolmogorov-Smirnov test proves that the residues of the logarithmic model fit a Normal distribution with a mean of 0 (with a probability of 38.8%). Next, we have investigated the relationship between the number of viewed documents and the number of searches. In Figure 7 we can observe a graph that illustrates that the relationship is patent and, as in the previous case, we have used the regression analysis in order to get the exact relationship between them.
Figure 8: Lineal model for documentssearches relationship. To confirm that the lineal model fits properly the series, we have analysed the residues using the Kolmogorov-Smirnov test, which demonstrates with a 75% of confidence that this residues fit a Normal distribution with mean 0. Thus, the lineal model seems to be the most precise and suitable to the original data and then we calculated the ANOVA table obtaining the following relationship: y = 1.241480 *x + 1.192723 Where x is the number of searches per minute and y is the number of viewed documents per minute.
6 Conclusions
Figure 7: Viewed documents per minute vs. searches per minute In this case, the variance seems to be more constant through the whole data than in the previous case. Nevertheless, we have used a Box-Cox transformation and we have made an analysis of regression similar to the previous one, but the models obtained were not very precise. For that reason, we reformulated the problem without applying a Box-Cox transformation and we calculated a lineal model for the original data (from Figure 7, we can observe that the model that could best fit the series is the lineal one). The result obtained is illustrated in Figure 8.
In this paper we have evaluated the behaviour of the Web users of an Internet directory using the information stored in the transaction log. From the first part of our analysis we corroborate the previous works conclusions: Web users differ significantly from traditional Information Retrieval users. Mainly in the following aspects: • Web users will check very few screen results (usually no more than 2), which gives more importance to the ranking algorithms of the search engines. • Web users tend to search the same things (using exactly the same words, or with small variations), although there is an important percentage of searches performed only once. • Web users don’t usually employ logic operators and, in any case, they are predisposed to use the simpler ones and the Boolean operators in their mother language. • A third part of the searches got more than 350 results, which means that Web users search very generic concepts.
From the second part of our analysis we obtain very useful information to understand the behaviour of the Web users as a group when they are using a search engine. Specifically, we deduce that the number of searches, the number of documents and categories viewed per minute follow a Poisson distribution, with a variable mean through time. But, the most important conclusion is that there is a relationship among the number of searches, documents viewed and categories visited, which was calculated in this paper. This information about the behaviour of Web users will allow us to continue with future works around the Internet search engines, especially researching new tools for the simulation of the behaviour of the Web information retrieval users, which will help in the development of more efficient and competent information systems.
7
Acknowledgements
The authors gratefully acknowledge the Department of Mathematics of the University of A Coruña, especially the teachers Ricardo Cao, Jose Antonio Vilar and Juan Manuel Vilar, for their help in the mathematical research of this paper.
8
References
[1] B. Jansen, A. Spink, J. Bateman, T. Saracevic, “Real Life Information Retrieval: A Study Of User Queries On The Web”. SIGIR FORUM Spring 98. [2] C. Silverstein, M. Henzinger, H. Marais, M. Moricz. “Analysis of a Very Large Web Search Engine Query Log”. SIGIR FORUM Fall 99. [3] S. Kirsch, “Infoseek’s experiences searching the Internet”. SIGIR FORUM Fall 98. [4] R. Baeza-Yates, B. Ribeiro-Neto, “Modern Information Retrieval”, Ed. Addison Wesley, ISBN: 0-201-39829-X.