85
A publication of
CHEMICAL ENGINEERING TRANSACTIONS VOL. 36, 2014 Guest Editors: Valerio Cozzani, Eddy de Rademaeker Copyright © 2014, AIDIC ServiziS.r.l., ISBN 978-88-95608-27-3; ISSN 2283-9216
The Italian Association of Chemical Engineering Online at: www.aidic.it/cet DOI: 10.3303/CET1436015
Experiment-based Decision Making in Complex Systems Simone Colombo*a, Salman Nazira, Alberto Gallaceb, Davide Mancaa a
Politecnico di Milano, Dipartimento di Chimica, Materiali e Ingegneria Chimica “G. Natta, Piazza Leonardo da Vinci, 32, 20122, Milan, Italy b Università degli studi Milano – Bicocca, Dipartimento di Psicologia, Piazza dell'Ateneo Nuovo 1, 20126, Milan, Italy
[email protected]
Managing complex systems is a challenging task as decisions are much more difficult to make and consequences (in case of wrong decision) much harder to bear. The process industry falls certainly in the category of complex, safety-critical systems. Disasters like the “Deepwater Horizon” (2010, 11 fatalities), the BP Texas City (2005, 15 fatalities), and the AZF Toulouse (2001, 29 fatalities) witness that. The paper explains the advantage of grounding decisions on the outcomes of realistic simulations performed in a Plant Simulator (PS) and also how, in this way, operators’ competency can be better managed and human performance improved. The results of the first experiment performed in a PS (the first known in the process industry to date) are used to clarify the concepts explained. They help clarifying how conveniently the data collected in a PS can be used for making daily decisions on how to better run the plant (safely and more efficiently).
1. Introduction Modern, safety-critical systems are increasingly difficult to manage and operate (Knight, 2002; Pimentel, 2003). Nowadays, the tasks that operators have to accomplish are becoming more complex and, with them, the competencies needed by operators to correctly and safely perform their duties. In turn, managers are faced with the challenging task of managing competencies to enable operators to keep high performances (in using new technologies) while operating plants safely. Automation is forcing operators to work with complex technologies that (often) have difficult interfaces to interpret. Process intensification is reducing the time left to operators to react to abnormal situations. Optimization is imposing operators to account for the effects of their actions not just on the operated unit (locally) but also on the overall plant (globally). In modern, complex systems, Human, Technological and Organizational (HTO) elements are tightly coupled and frequently low buffered, i.e. fault intolerant. Psychologists and sociologists have been the first to explain both that the role of humans was changing from manual to supervisory activity (Rasmussen, 1986; Reason 1990; Endsley, 1995) and that the organizational dimension (of accidents) was key (Perrow, 1984; Sagan, 1993; Reason, 1997; Hollnagel, 2006). This systemic dimension contributed to highlight the importance of training and competence management.
2. (Human) Performance and competences Training approaches can be coarsely divided into two categories: the classical “on-the-job” and “classroom” styles, on the one hand, and the “simulator” style (e.g., flight simulator), on the other hand. In the classical approaches, operators learn what their tasks are and how they have to accomplish them from the trainer (in a class with the help of slides). Abnormal situations are typically not addressed and, even when they are, their usefulness is very low (or even dangerous) as they describe a story happened to other operators, with all the wrong or misleading subjective interpretations this approach might bring about (Nazir et al., 2013). Classical training approaches are potentially risky for two reasons: skills may be easily molded around wrong assumptions (grounded on reported experience instead of realistic simulations), and overconfidence (to be able to cope with abnormal situations) might be instilled into people due to a lack of emotional preparedness (people are only rationally confident). The simulator approach overcomes the strong limitations, which classical approaches hold, as it allows trainees to experience abnormal situations
Please cite this article as: Colombo S., Nazir S., Gallace A., Manca D., 2014, Experiment-based decision making in complex systems, Chemical Engineering Transactions, 36, 85-90 DOI: 10.3303/CET1436015
86
and learn how the plant behaves in those conditions (e.g., response time, sequences followed, alarms triggered).
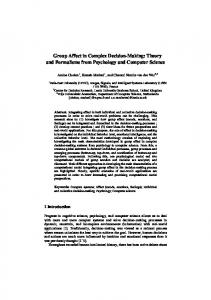
3. The Plant Simulator The Plant Simulator (PS) is the expression that refers (for the process industry) to something conceptually similar to the flight simulator paradigm (Colombo et al., 2011). The PS is an IT infrastructure created to replicate the exact plant conditions and enable the Control Room Operator (CROP) and the Field Operator (FOP) to cooperate the same way they would do in real life (in the plant). The high immersivity provided by the PS allows CROPs and FOPs experiencing both cognitively and emotionally the process behaviour and the consequences originated by either conventional or abnormal operating conditions. The PS comprises two types of rooms: the CROP’s and FOP’s room. The CROP room is a physical replica of the real control room. The FOP room, given the (economic) impossibility of replicating the plant, replicates the plant environment by means of an Immersive Virtual Environment (IVE) featuring 3D stereoscopic vision in front of a large retro-projected screen with spatial sound. Figure 1 shows what typical CROP and FOP rooms look like. CROP View
FOP View
Figure 1: A typical Plant Simulator environment – CROP and FOP view (Virthualis Project). The rooms have to be separated and isolated from one another as the CROP and the FOP(s) have not to see and hear each other as it occurs in real situations (CROPs and FOPs communicate by means of hand held transceivers). The three characteristics that make an IT infrastructure a PS are: (1) the capability to allow the CROP and FOP(s) to work together as in real life, i.e. perform realistic actions and get realistic information and response from the IT system; (2) the capability to emotionally involve people in the simulated environment so that they behave the more similarly as possible to the way they would do in reality (i.e. reach what we call the “psychological fidelity”); (3) the capability to assess the CROP(s) and the FOP(s) performances (even as a team), in real-time.
4. Experiment-based decision making Safety-related decisions are typically made on the basis of safety reports, which not always reflect the reality, i.e. what might really go wrong (and how). Traditional risk assessment methods (Skogdalen and Vinnem, 2011) fail to correctly account for human and organizational factors. Given these known, structural limitations, what is proposed here is twofold: (1) derive data on operators’ and managers’ performance by means of realistic experiments performed in a PS; (2) ground the well-known Key Performance Indicators, KPIs (used by managers to make their decisions) on the realistic data collected in the PS (and reflecting the capabilities of operators and managers to operate the plant). The experimental approach proposed (in contrast to the classical, speculative one) ensures that decisions made using data collected in a PS embed the effective capability of the HTO systems (as a whole) to respond to both abnormal and emergency situations. Further,, the assessors (typically experienced CROPs and FOPs), contribute to the definition of the algorithm used by the PS to assess (in real-time and during the simulation) the performance of the operators and that of the team. By doing so, the assessment variability (given by the subjectivity of the trainer) is significantly reduced, and the operators’ benchmarking is made reliable, consistent, and replicable. Operators can get a strong motivation from a PS as, if they perform well (and they are confident about its realism), they feel to have good chances to cope with that (abnormal) situation even in reality. In addition, given they can experience the complexity and the difficulties of coping with both abnormal and emergency situations, they will fade away the dangerous complacency that might lead to an accident. Managers can
87
better understand difficulties faced by operators (by standing outside the simulation scene) and valorise the time spent and the data collected during the simulations to make daily decisions. Indeed, if the simulation results are available, they can conveniently use those data to decide which operator assigning on shift for a scheduled activity (i.e. put on shift the one(s) who best performed in the PS). This possibility holds only if it can be assumed that the behaviour showed in the PS will be similar to that shown in reality, i.e. only if a ‘psychological fidelity’ is reached.
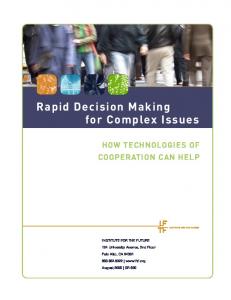
5. Performed experiments The potential benefits of using IVEs for training operators and making decisions is a topic extensively addressed (Fiske and Hill, 2010; Colombo et al., 2011; Nazir et al., 2012; Manca et al., 2013). This manuscript discusses the impact that IVEs, used as advanced training tools, may have on the operators’ performance. Specifically, the following Sections compare the results on an experiment where two distinct training methods where tested to see the role played in case of accident simulation in the Oil&Gas industry. 5.1 Participants selection, grouping and training Twenty-four participants (20 males) took part in the experiment and were split into two groups (12 each). They aged in the range between 19 and 22 y (average 20.8 y and SD 1.03 y) and they were bachelor students in Chemical Engineering (3rd year) at the Politecnico di Milano, Milan, Italy. To ensure homogeneity, only students of the same course and year were selected. All participants volunteered by responding to an open call and were deliberately not paid for their participation (homogeneity even in terms of motivation for the experiment). The experiment was performed in accordance with the ethical standards laid down in the 1991 Declaration of Helsinki. According to extant literature, groups used to perform experiments of similar typology in other domains (aviation and nuclear), are in the range of 8 to 10 participants for each group (Dehais et al., 2012; Cai and Lin, 2011). The two groups were trained differently, namely: Group A used a 3D IVE, while Group B used a classical classroom lesson/presentation. 5.2 The PS scenario The scenario implemented in the PS is a C3/C4 separation section of a crude-oil refinery. Figure 2 shows a snapshot of the IVE used for the experiment and the pool fire. In the accident scenario implemented in the PS an excavator (incidentally) hits a pipe in which is flowing a stream of pressurized liquid butane (C4). The collision creates a liquid jet that creates a pool on the ground, which eventually is ignited. The accident sequence (implemented in the PS) can be summarized as follows: (1) the FOP is at the C3/C4 separation section of the refinery (Figure 2), (2) the excavator hits a pipe and breaks a flange, (3) the liquid leaks from the ruptured flange and spreads on the ground creating a pool, (4) the pool is ignited giving rise to a pool fire (see Figure 2), (5) the FOP alerts the CROP (who interacts with the FOP), (6) the CROP closes a remotely controlled valve (from DCS), (7) the outflow stops but the liquid level in the reboiler starts increasing and reaches the high level alarm, (8) the CROP asks the FOP to open a manually operated valve (FOV) to decrease the reboiler level and then to close it back again (to recover the original operating conditions), (9) the reboiler level decreases back to the correct value. IVE of the C3/C4 Unit
Pool fire
Figure 2: IVE of the C3/C4 separation section of a refinery used for experiments and the pool fire. To avoid discrepancies, the CROP’s role was played by the same expert person who knew how to operate and interact (in the same way) with all FOPs (who took part individually in the experiment). All participants of Group A and Group B performed exactly the same sequence.
88
6. Training context and experiment execution Group A was trained within the PS with 3D passive glasses (necessary to provide the sense of depth). Group B was trained using a conventional slide-supported presentation (with twelve slides). Both training sessions lasted about 45 min. To avoid activating different cognitive channels in the two groups (as they influence performance), the spatial sound and the Augmented Virtual Reality (AVR) features of the PS were both disabled. This choice was made to stimulate trainees’ visual and the auditory senses, i.e. two sensory channels (Nazir et al., 2012). Each participant was tested individually without anybody else attending. This was done on purpose to increase the similarity of the simulated environment with the working conditions. In order to increase realism, the CROP operated in a separate room from that of the FOP (they could not hear and see each other) and the communication was done via hand-held transceivers (as in reality). In addition, the time between the training and the assessment sessions was kept constant to avoid differences between shortterm and long-term memories in the participants.
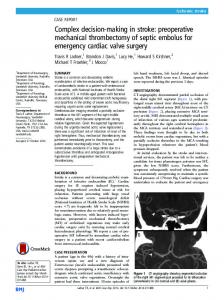
7. Results and discussions Looking at the results, participants of Group A (trained in the 3D Environment) performed better than those of Group B (trained in a classical way). During the experiment, thanks to the tracking feature of the PS, seven parameters were measured, namely: (1) hints provided, (2) message repetitions, (3) leak identification, (4) valve I identification, (5) fire reporting, (6) valve II identification, (7) total time taken. The first measured parameter is the number of hints provided to participants (if required). To preserve the experiment consistency, such hints were the same (in terms of contents and tone) for all participants. Hints were given after a specific and constant time interval, which was chosen to be 90 s. The second measured parameter is the number of voice message repetitions required by participants. This value is particularly important because it reflects the operator’s situation awareness (the more one knows about something the lower the need for repetitions required to understand the hint).Figure 3 shows the number of hints and the number of message repetitions given to the participants. Participants of Group A required a significantly lower number of hints than those of Group B (t (22) = 3.05, p< 0.006). Specifically, in 41 % of the cases, participants of Group A did not even ask for hints (i.e. absent bars in Figure 3). In the remaining 59 % of the cases participants of Group A asked for less hints than Group B. Overall, participants of Group A requested 11 hints whilst those of Group B requested 29 hints, i.e. 164 % more hints required by Group B (with respect to Group A). 2
5 4.5 Repetitions of voice messages
Number of hints given
4 3.5 3 2.5 2 1.5 1
1
0.5 0
0
1 2 3 4 5 6 7 8 9 10 11 12 13 14 15 16 17 18 19 20 21 22 23 24 Participant ID
1
2
3
4
5
6
7
8
9 10 11 12 13 14 15 16 17 18 19 20 21 22 23 24 Participant ID
Figure 3: Number of hints provided and message repetitions for Group A (1-12) and Group B (13-24). This result might be taken to suggest a lower ability from participants of Group B to understand the hints requested. Overall, in 67% of the cases participants of Group A did not ask for any repetitions while this percentage for Group B drops to 58 %. In addition, among those who asked for repetition, 80% of Group B asked for two repetitions, against none of Group A. The simulated accident was designed to require operators to demonstrate their fault identification and diagnostic skills gained during the training session. This was done at four stages, namely: leakage identification, valve I identification (DCS valve), (timely) fire reporting, and valve II identification (manual valve). Figure 4 shows the results for the 4 parameters, jointly with the time taken (in minutes). Looking at the results it appears that Group A outperformed Group B both in the identification and in the reporting capabilities. These results clearly suggest that participants of Group A achieved a higher operator performance than participants of Group B. In case of Group B, only 5 out of 12 participants were able to identify the leakage at first time without help, whereas 8 participants of Group A identified successfully the
89
leakage. In other words, two thirds of Group A participants (i.e. 67%) were able to identify and report the leakage, whilst only 42% of Group B were successful (t (22) = 2.28, p< 0.02). A Mann-Whitney test indicated that total identifications (leak identification, fire identification, valve I identification, valve II identification) was greater for Group A (M = 2.92, SD = 1.24) than Group B (M = 1.83, SD = 1.34; U = 38).
12
1 12
Identified/reported
10 11
8 6
Group,A
4
Group,B
10
7 6 5 4 3 2 1 0
2 3
4
5
9
2
8
0 Leakage Identificaton
Valve0(I)0 Identification
Fire0Reporting
Valve0(II)0 Identification
6 7
Figure 4: Number of identifications (left) and total time taken (in minutes) for Group A and Group B. Finally, the seventh measured parameter is the total time taken by participants to complete the experiment. It represents the responsiveness and attention allocation abilities. Figure 4 (right side) shows the time taken by both Group A and B. The shorter the time, the better the performance, and eventually the lower the impact of the accident (as the amount leaked liquid gas is lower). The participants of Group A (Mean duration = 247.6 s, SD = 52.1 s) used on average 50 seconds less time than the participants of Group B (Mean duration = 297.6 seconds, SD = 44.1 seconds) as measured by an independent samples ttest (t(22)= -2.535, p = .019, 95% CI of mean difference [-90.8, -0.09], Cohen´s d = 1.04).
8. Conclusions From the achieved results it is straightforward to conclude that IVEs are enabler as they allow improving operators’ performance. This is achieved through a stronger involvement of people that are “tied-in” the simulation both rationally and emotionally. The higher contextual understanding provided by IVEs is evidenced by all the parameters measured. In terms of decision-making, the use of a PS allows exploiting the time spent for and the data collected during the simulations to make better decisions, which embed the real capabilities of the whole HTO system. This can be achieved thanks to the ‘psychological fidelity’ provided by the PS that allows to reasonably assume that the behaviors adopted in the PS are similar (if not the same) to those taken in reality (in analogy with the flight simulators). The performed experiments did not allow unveiling all the pros and cons of using IVEs for training and decision-making purposes. However, the results achieved are sufficiently promising to cast a hope on the possibility of using a PS to certify and select plant operators and managers in complex process systems.
References Cai, H., Lin Y., 2011, Modeling of operators’ emotion and task performance in a virtual driving environment. International Journal of Human-Computer Studies 69 (9), 571-586. Colombo S., Manca D., Brambilla S., Totaro R., Galvagni R., 2011, Towards the Automatic Measurement of Human Performance in Virtual Environments for Industrial Safety. ASME 2011. World Conference on Innovative Virtual Reality (WINVR 2011), 1-10. Dehais F., Causse M., Vachon F., Tremblay S., 2012, Cognitive conflict in human-automation interactions: a psychophysiological study. Applied ergonomics 43 (3), 588-595. Endsley M.R., 1995, Towards a theory of situation awareness in dynamic-systems. Human Factors 37, 3264. Fiske T., Hill D., 2010, 3D simulation brings immersive dimension to operator training. ARC INSIGHT #2010-06MP. Hollnagel E., Woods D.D., Leveson N.G., 2006, Resilience Engineering: Concepts and Precepts. Ashgate. Knight J.C., 2002, Safety Critical Systems: Challenges and Directions.
90
Manca D., Brambilla S., Colombo S., 2013, Bridging between Virtual Reality and accident simulation for training of process-industry operators. Advances in Engineering Software, 55, 1–9. Nazir S., Totaro R., Brambilla S., Colombo S., Manca, D., 2012, Virtual Reality and Augmented-Virtual Reality as Tools to Train Industrial Operators. Computer Aided Chemical Engineering 30, 1397-1401. Nazir S., Colombo S., Manca D., 2013, Minimizing the risk in the process industry by using a plant simulator: a novel approach. Chemical Engineering Transactions, 32, 109-114. Perrow C., 1984, Normal Accidents. Basic Books, New York, USA. Pimentel J.R., 2003, Designing safety-critical systems: A Convergence of Technologies, Symposium on Reliable Distributed Systems (SRDS), 2003, Florence, Italy. Rassmussen J., 1986, Information Processing and human-machine interaction: an approach to cognitive engineering. North-Holland, Amsterdam. Reason J., 1990, Human Error. Cambridge University Press, Cambridge, UK. Reason J., 1997, Managing the Risks of Organizational Accidents. Ashgate, Aldershot, UK. Sagan S.D., 1993, The limits of Safety: organizations, accidents and nuclear weapons, Princeton University Press, USA. Skogdalen J.E., Vinnem J.E., 2011, Quantitative risk analysis offshore — Human and organizational factors. Reliability Engineering & System Safety 96 (4), 468–479.