Weilin Qu Issam Mudawar1 e-mail:
[email protected] Boiling and Two-Phase Flow Laboratory, School of Mechanical Engineering, Purdue University, 585 Purdue Mall, West Lafayette, IN 47907-2088
Sang-Youp Lee Steven T. Wereley Microfluidics Laboratory, School of Mechanical Engineering, Purdue University, 585 Purdue Mall, West Lafayette, IN 47907-2088
Experimental and Computational Investigation of Flow Development and Pressure Drop in a Rectangular Micro-channel Flow development and pressure drop were investigated both experimentally and computationally for adiabatic single-phase water flow in a single 222 m wide, 694 m deep, and 12 cm long rectangular micro-channel at Reynolds numbers ranging from 196 to 2215. The velocity field was measured using a micro-particle image velocimetry system. A three-dimensional computational model was constructed which provided a detailed description of liquid velocity in both the developing and fully developed regions. At high Reynolds numbers, sharp entrance effects produced pronounced vortices in the inlet region that had a profound influence on flow development downstream. The computational model showed very good predictions of the measured velocity field and pressure drop. These findings prove the conventional Navier-Stokes equation accurately predicts liquid flow in micro-channels, and is therefore a powerful tool for the design and analysis of micro-channel heat sinks intended for electronic cooling. 关DOI: 10.1115/1.2159002兴
Introduction Hydrodynamic and thermal transport aspects of liquid flow in micro-channels with characteristic dimensions from 10 to 1000 m are of considerable interest to many emerging technologies. One application that is of particular interest to the electronics community is thermal management of high-power-density microprocessors. Micro-channel flow has recently been widely identified as a prime contender for cooling of next generation cuttingedge electronics 关1兴. Micro-channel flow is achieved inside a specialized heat sink that is attached to the surface of an electronic device. Typically fabricated from a high-thermal-conductivity solid substrate such as copper or silicon, a micro-channel heat sink contains a series of parallel micro-channels that serve as flow passages for the liquid coolant. The heat generated by the electronic device is transferred by conduction to the micro-channels through the solid substrate of the heat sink, and carried away from the heat sink by the liquid flowing through the micro-channels. Micro-channel heat sinks are capable of dissipating large amounts of heat from small areas. The merits of liquid flow in small channels and micro-channel heat sinks were first conceived for gas turbine blade cooling applications 关2,3兴. The same concept was proposed for electronic cooling by Tuckerman and Pease 关4兴, who used chemical etching to form parallel rectangular microchannels 共50 m wide by 302 m deep, and separated by 50 m walls兲 in a 1 cm2 silicon wafer. Using water as a coolant, their heat sink was capable of dissipating 790 W / cm2 with a maximum substrate temperature rise of 71° C above the water inlet temperature and a pressure drop of 2.2 bar. Several experimental studies followed Tuckerman and Pease’s work, where micro-channel heat sinks with different solid substrates, channel geometries, dimensions, and cooling liquids were fabricated and tested 关5–9兴. These studies further demonstrated the merits of micro-channel heat
sinks for electronic cooling: very small convective thermal resistance, large surface area to volume ratio, small heat sink mass and volume, and small coolant inventory. The design of a micro-channel heat sink requires accurate depiction of micro-channel flow. Two approaches are commonly used to describe fluid flow and heat transfer in micro-channel heat sinks. The first employs simplified analytical methods 关10–13兴, assuming the solid walls separating micro-channels behave as thin fins, and relying on such approximations as uniform fluid temperature, one-dimensional heat transfer, and constant convective heat transfer coefficient along the micro-channel walls, evaluated from empirical heat transfer correlations. The other approach involves solving the three-dimensional Navier-Stokes and energy equations 关14,15兴. Both of these approaches are based on prior understanding of fluid flow and heat transfer in macro-channels, and are therefore valid only if liquid flow in micro-channels follows the same conservation laws as in macro-channels. Several studies have been conducted to explore this important fundamental issue. Most of these studies relied on bulk flow measurements, comparing pressure drop measurements across the channel to macro-channel model/correlation predictions. The results show significant disagreements. Some studies showed the measured pressure drop is higher 关16–19兴 or lower 关20–22兴 than the macro-channel model/ correlation predictions, while others indicated macro-channel models/correlations adequately describe micro-channel flow 关23–25兴. Single-phase liquid flow in a channel with a constant cross section can be divided into two regions: a developing region, where the velocity profile changes from some initial profile to an invariant one downstream, and a fully developed region, where the velocity profile is independent of stream-wise distance. For laminar flow in a rectangular channel with a uniform velocity profile at the inlet, the length of the developing region has been discussed in detail by Shah and London 关26兴 and approximated by Ld = 共0.06 + 0.07 − 0.042兲Rechdh
1
To whom correspondence should be addressed. Contributed by the Electronic and Photonic Packaging Division of ASME for publication in the JOURNAL OF ELECTRONIC PACKAGING. Manuscript received June 18, 2004; final manuscript received August 10, 2005. Review conducted by Koneru Ramakrishna.
Journal of Electronic Packaging
共1兲
where , Rech, and dh are the channel aspect ratio, Reynolds number, and channel hydraulic diameter, respectively. Since microchannel heat sinks are typically used in high-heat-flux applications, a relatively large liquid flow rate is required to maintain a
Copyright © 2006 by ASME
MARCH 2006, Vol. 128 / 1
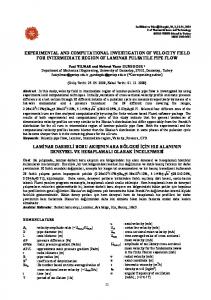
Fig. 1 Schematic of flow loop
small stream-wise temperature rise in both the heat sink and electronic device. Even through micro-channels possess very small cross-sectional dimensions, a large flow rate can result in developing regions that are comparable to, if not larger than, the entire micro-channel. Understanding the developing flow behavior in a micro-channel is therefore vital to understanding the cooling performance of a micro-channel heat sink. This is clearly evident is a recent study by Qu and Mudawar 关27兴 which revealed that empirical heat transfer correlations that account for entrance effects
Fig. 2 Construction of micro-channel test module
2 / Vol. 128, MARCH 2006
provide fairly accurate predictions of the cooling performance of a micro-channel heat sink, while those utilizing fully developed flow correlations show appreciable error. In this study, adiabatic flow development of water in a rectangular micro-channel is investigated both experimentally and computationally. The local velocity field was measured by a microparticle image velocimetry 共micro-PIV兲 system. The experimental results are compared to computational predictions to assess the suitability of macro-transport models to depicting the transport characteristics of developing micro-channel flow. A detailed description of the development behavior is presented and discussed. The results provide fundamental insight into the complex threedimensional characteristics of micro-channel developing flow. Finally, predictions based on the three- dimensional computational model are compared to pressure drop data. This study constitutes a crucial step towards validating the conventional Navier-Stokes equation for complex three-dimensional hydrodynamically developing liquid flows in micro-scale channels. This validation represents a necessary precursor to any thermal analysis of a micro-channel heat sink.
Experimental Apparatus Flow Loop. Figure 1 shows a schematic of the flow loop that was constructed to supply deionized water to a micro-channel test module at room temperature. The water was circulated through the flow loop from a reservoir with the aid of a variable speed gear pump. The flow first passed through a filter to prevent solid particles from blocking the micro-channel. The water then entered one of two rotameters for volume flow rate measurement. The rotameters were calibrated at different water temperatures using the standard weighting method, and their measurement accuracy was better than 4%. After the flow rate measurement, the water flowed through the micro-channel test module where the velocity field and pressure drop were measured using a micro-PIV system and pressure transducers, respectively. Exiting the test module, the water returned to the reservoir. Two thermocouples were installed both upstream and downstream of the test module to measure the water temperature that was used for determination of thermo-
Fig. 3 Schematic of micro-PIV system
Transactions of the ASME
microscope objective lens of the micro-PIV system could be brought to within a very short distance from the flow. An O-ring in the base plate maintained a leak-proof assembly. The base plate contained deep plenums leading to shallow plenums both upstream and downstream of the micro-channel. The shallow plenums were 6.35 mm wide, 694 m deep, and 12.7 mm long. Two absolute pressure transducers were connected to the base plate’s deep plenums to measure the inlet and outlet pressures. The pressure transducers were calibrated against a known standard and their measurement uncertainty was less than 3.5%. Pressure drop across the micro-channel was determined from the measured inlet and outlet pressures ⌬Pexp = Pin − Pout
共2兲
The pressure drop measurements were conducted at Reynolds numbers of 196, 1021, 1895, and 2215. Fig. 4 Computational domain
physical properties. Several pressure gauges were incorporated throughout the flow loop to aid the operator in monitoring the system pressure.
Micro-PIV System. Figure 3 shows a schematic of the microPIV system that was used to measure the velocity field in the developing and fully developed regions along the micro-channel. A brief overview of the micro-PIV system is given below; further
Test Module. Figure 2 illustrates the key components of the micro-channel test module: a base plate, a thin plastic adhesive film, a cover plate, a top 共support兲 plate, and four sets of clamps. The based plate, cover plate, and top plate were all fabricated from transparent acrylic to facilitate optical and visual access to the flow within the micro-channel. A rectangular 222 m wide, 694 m deep, and 120 mm long micro-slot was machined into the top surface of the base plate by a precision saw. The 25.4 m thick transparent adhesive plastic film 共Adhesive Research Inc.兲 has an optical transmission rate over 95%. It was taped down to the 1.6 mm thick cover plate that was pressed against the base plate with the aid of the four clamps to form a closed microchannel. The top plate was hollowed out in the middle so that the
Table 1 Dimensions of micro-channel computational domain Wch 共m兲 222
Hch 共m兲
Lch 共mm兲
W p2 共mm兲
L p2 共mm兲
694
120
6.35
12.7
Fig. 5 Comparison of numerical predictions of horizontal middle-plane „z⬘ = 347 m… velocity profile for Rech = 1895 at x⬘ = 10 cm with analytical fully-developed profile
Journal of Electronic Packaging
Fig. 6 Comparison of measured with numerically predicted velocity profiles at two horizontal planes „z⬘ = 347 m and z⬘ = 555 m… and x⬘ = 1 cm for „a… Rech = 196 and „b… Rech = 1895
MARCH 2006, Vol. 128 / 3
details are available in Ref. 关28兴. The micro-PIV system is composed of three major components: a two-cavity frequency-doubled Nd: yttrium-aluminum-garnet 共YAG兲 laser 共New Wave Inc.兲, an inverted epi-fluorescent microscope 共Nikon TE200兲, and an interline transfer charge coupled device 共CCD兲 camera 共LaVision Inc.兲. The laser is used for illumination. The wavelength and pulse width of the laser beam are 532 nm and about 3 – 5 ns, respectively. A beam expander assembly is installed between the laser and the microscope to match the quality of the laser beam to that of the white light source. The beam expander is configured with a negative and a positive lens in a Galilean telescope arrangement, and a 5 deg diffuser is situated between the two lenses to preclude damage to the internal optics of the microscope. After passing through the beam expander assembly, the laser beam enters the microscope. The microscope consists of an epifluorescence filter cube and an objective lens. As illustrated in Fig. 3, the filter cube consists of an exciter 共green filter兲, an emitter 共red filter兲, and a dichroic mirror. After passing through the exciter, the incoming laser beam reaches the dichroic mirror, which is designed to reflect short-wavelengths 共 ⬍ 610 nm兲 and transmit long ones. The laser beam 共 ⬃ 532 nm兲 is therefore redirected to the objective lens. The laser beam coming out from the objective lens was used to illuminate the flow field in the micro-channel. Fluorescent particles about 1 m in diameter were suspended in the flow and served as seeding particles, absorbing the illuminating laser beam 共 ⬃ 532 nm, green兲 and emitting the longer wavelength light 共 ⬃ 610 nm, red兲. The light emitted from the seeding particle carried the image of the flow field. The light passed through the objective lens, dichroic mirror, emitter, and eventually reached the CCD camera. After a specified time delay, the same process was repeated to acquire a second image of the flow field. The velocity field was obtained from the two images using cross-correlation based interrogation 关28兴. In the present study, the micro-PIV measurements of local velocity field were performed at Reynolds numbers of 196 and 1895. The uncertainty in these measurements is less than 1%.
⬁
48
兺
共− 1兲共n−1兲/2
n=1,3,. . .
u = u p2,in,m
n3
冦
Computational Model Figure 4 shows the computational domain that was adopted for analysis of flow development and pressure drop in the microchannel. The computational domain contained half of the inlet shallow plenum, the micro-channel, the entire outlet shallow plenum, and two solid regions adjoining the micro-channel. As illustrated in Fig. 4, two coordinate systems were employed: an x-y-z coordinate system that was applied to the entire computational domain, and an x⬘-y ⬘-z⬘ system that was used to describe the flow field in the micro-channel alone. Dimensions of the computational domain are given in Table 1. The following assumptions were adopted before applying differential conservation equations to the computational domain 共1兲 共2兲 共3兲 共4兲
steady flow incompressible fluid laminar flow constant solid and fluid properties
For the water flow in the micro-channel as well as the inlet and outlet shallow plenums, the above assumptions reduce the continuity and momentum equations, respectively, to the following
ជ =0 ⵜV
共3兲
ជ · ⵜVជ 兲 = − ⵜP + ⵜ2Vជ and f 共V f
共4兲
For the solid regions, the continuity and momentum equations are simply Vជ = 0
The boundary conditions for the computational domain were specified as follows. As indicated in Fig. 4, the inlet of the computational domain was located half-way along the inlet shallow plenum, where the flow was assumed fully developed. A fullydeveloped velocity profile 关26兴 was therefore applied at the computational domain inlet
冉冏 冏 冊
cosh n z −
Hch
/W p2
2
1−
cosh关nHch/共2W p2兲兴
冧冢
冏 冏
n y −
192 W p2
5
Hch
v = 0,
⬁
n=1,3,. . .
W p2
冣
nHch
1
n5
W p2 2
cos
再 冉 冊 兺 冉 冊冎
3 1 −
共5兲
tanh
2W p2
共6兲
w=0
for x = 0, 0 艋 y 艋 W p2, and 0 艋 z 艋 Hch
where u p2,in,m is the mean velocity in the inlet shallow plenum for x = Lch +
V˙exp u p2,in,m = A p2
共7兲
The flow was assumed fully developed at the computational domain outlet
u = 0, x
v = 0, x
w =0 x 共8兲
4 / Vol. 128, MARCH 2006
3L p2 2
, 0 艋 y 艋 W p2, and 0 艋 z 艋 Hch .
The velocity is zero along all other boundaries. The governing differential equations, Eqs. 共3兲–共5兲, together with the above boundary conditions, were discretized along the x, y, and z coordinates using the finite difference method, which resulted in a system of algebraic equations. The grid system for the entire computational domain had 262, 81, and 51 nodes in the x, y, and z directions, respectively. The micro-channel itself conTransactions of the ASME
Fig. 7 Comparison of measured with numerically predicted velocity profiles at two horizontal planes „z⬘ = 347 m and z⬘ = 555 m… and x⬘ = 10 cm for Rech = 1895
tained 160⫻ 39⫻ 51 nodes in the x⬘, y ⬘, and z⬘ directions, respectively. A nonuniform grid consisting of a larger number of grid points near the channel inlet and outlet as well as the channel walls was employed to better resolve the velocity field. The SIMPLE algorithm 关29兴 was used to solve the resulting system of algebraic equations in primitive variables, namely u, v, w, and P. When solving the momentum equations, water viscosity was evaluated at the average of the measured inlet and outlet temperatures. This viscosity value was used throughout the micro-channel and shallow plenums. A very large viscosity value was assigned to the solid, essentially yielding zero velocity throughout the solid regions. The Gauss-Seidel iterative technique was employed in the solution process, with successive over-relaxation to improve convergence time. The solution was considered convergent when the
Fig. 8 Comparison of measured with numerically predicted central line velocities along stream-wise direction for Rech = 196 and 1895
criterion max兩 共+1 − 兲 / +1 兩 艋 10−4 was satisfied, where represents any velocity component, namely u, v, or w, and is the iteration number. The computational code was verified by comparing the results with available analytical solutions. Figure 5 shows numerical predictions for the horizontal middle-plane velocity profile 共at z⬘ = Hch / 2 = 347 m兲 near the micro-channel exit 共x⬘ = 10 cm兲 at Rech = 1895 are in excellent agreement with the analytical fullydeveloped velocity profile 关26兴. The micro-channel Reynolds number Rech is defined as
Fig. 9 u¯-v¯ vector fields at horizontal middle-plane „z⬘ = 347 m… and 0 Ï x⬘ / „Rechdh… Ï 0.002 for „a… Rech = 196 and „b… Rech = 1895
Journal of Electronic Packaging
MARCH 2006, Vol. 128 / 5
Fig. 10 = Lch
u¯ profile in different y⬘-z⬘ planes for Rech = 196 at „a… x⬘ = 0, „b… x⬘ = 0.0002Rechdh, „c… x⬘ = 0.002Rechdh, and „d… x⬘
Rech =
f u md h
f
共9兲
where um is the mean velocity in the micro-channel um =
V˙exp Ach
共10兲
Results and Discussion Flow Development. Figures 6共a兲 and 6共b兲 compare measured and numerically predicted velocity profiles at two horizontal planes, z⬘ = 347 and 555 m, and at a stream-wise position close to the micro-channel inlet, x⬘ = 1 cm, for Rech = 196 and 1895, respectively. Notice that z⬘ = 347 m corresponds to the microchannel’s horizontal middle plane, while z⬘ = 555 m is in the upper portion of the micro-channel close to the cover plate. Figures 6共a兲 and 6共b兲 show fairly good agreement between the model predictions and micro-PIV data with percentage differences smaller than 3% and 10%, respectively. Figure 7 shows a similar comparison between measured and predicted velocity profiles at z⬘ = 347 and 555 m for Rech = 1895 at a downstream location close to the micro-channel outlet, x⬘ = 10 cm. Fairly good agreement is realized at this downstream location as well with a percentage difference smaller than 9%. Figure 8 compares the micro-channel central line velocity uc measured along the stream-wise direction with model predictions for Rech = 196 and 1895. Notice that the central line velocity in the inlet shallow plenum is much lower than in the micro-channel because of the much larger flow area of the former. There is a rapid increase in uc once the flow reaches the micro-channel inlet. 6 / Vol. 128, MARCH 2006
At the relatively high Reynolds number of 1895, uc shows a significant overshoot and reaches a local maximum within the developing region. This phenomenon is not observed for Rech = 196. Figure 8 shows the flow is still developing for Rech = 1895 at x⬘ = 1 cm but fully developed for Rech = 196. On the other hand, the flow at x⬘ = 10 cm is fully developed for both Reynolds numbers. Figure 8 shows fairly good agreement between the model predictions and experimental data for both Reynolds numbers. The good agreement between the measured and predicted flow velocities in the micro-channel proves the conventional NavierStokes equation predicts liquid micro-channel flow fairly accurately. Figures 9共a兲 and 9共b兲 show non-dimensional ¯u-¯v vector fields in the middle horizontal plane, z⬘ = 347 m, immediately downstream of the micro-channel inlet 共0 艋 x⬘ / 共Rechdh兲 艋 0.002兲 for Rech = 196 and 1895, respectively, where ¯u and ¯v are nondimensionalized with respect to the centerline velocity at the microchannel outlet ¯u =
u uc,out
and ¯v =
v uc,out
共11兲
When the flow enters the micro-channel from the shallow plenum, the abrupt contraction causes flow separation at the channel inlet and forms vortices near the sidewalls. These vertexes are confined to a short distance from the channel inlet. Comparing Figs. 9共a兲 and 9共b兲 shows the vertexes are more pronounced for Rech = 1895, penetrating deeper into the channel, which explains the overshoot in the central line velocity in Fig. 8 for the same Reynolds number. Figures 10共a兲–10共d兲 illustrate nondimensional ¯u profiles for Transactions of the ASME
Fig. 11
u¯ profile in different y⬘-z⬘ planes for Rech = 1895 at „a… x⬘ = 0, „b… x⬘ = 0.0002Rechdh, „c… x⬘ = 0.002Rechdh, and „d… x⬘ = Lch
Rech = 196 at four y ⬘-z⬘ planes, x⬘ = 0, x⬘ = 0.0002Rechdh, x⬘ = 0.002Rechdh, and x⬘ = Lch. Similar plots are shown in Figs. 11共a兲–11共d兲 for Rech = 1895. Some interesting features of the flow development are readily observed in these figures. For Rech = 1895, four vortices are observed at x⬘ = 0.0002Rechdh, Fig. 11共b兲, and these vortices appear to have a significant effect on the flow development downstream. Overall, flow development is far smoother at Rech = 196 than at Rech = 1895.
The pressure is nearly constant in the inlet and outlet shallow plenums. There is a sudden decrease in pressure immediately after the micro-channel inlet corresponding to the rapid increase in uc illustrated earlier in Fig. 8. The three larger Reynolds numbers show a local minimum pressure corresponding to the overshoot in uc.
Pressure Drop. The measured pressure drop was compared to predictions based on 共a兲 the computational model and 共b兲 empirical correlations. The results are shown in Fig. 12 for four Reynolds numbers. Numerical predictions of pressure drop are readily available once Eqs. 共3兲–共5兲 are solved numerically. Predictions based on empirical correlations were based on the following relation, which neglects the small pressure drop in the shallow plenums ⌬Ppred = ⌬Pc1 + ⌬Pc2 + ⌬Pd + ⌬Pfd + ⌬Pe2 + ⌬Pe1
共12兲
where ⌬Pc1 and ⌬Pc2 are the inlet contraction pressure losses, ⌬Pe2 and ⌬Pe1 are the outlet expansion pressure recoveries, and ⌬Pd and ⌬Pfd denote pressure drops in the developing and fullydeveloped regions. Correlations for the individual pressure drop components in Eqs. 共12兲 are summarized in Table 2 关26,30兴. The length of the developing region, Ld, is calculated from Eq. 共1兲, and the length of the fully-developed region, Lfd, from Lfd = Lch − Ld
共13兲
Figure 12 shows both the computational model and correlations can adequately predict pressure drop across the micro-channel. Figure 13 shows numerically predicted pressure distribution along the stream-wise direction for the same four values of Rech. Journal of Electronic Packaging
Fig. 12 Comparison of measured pressure drop and predictions based on numerical analysis and correlations for Rech = 196, 1021, 1895, and 2215
MARCH 2006, Vol. 128 / 7
Table 2 Micro-channel pressure drop components Kc1 2 2 f u p2,in,m Kc2 1 ⌬Pc2 = 2 f 共um2 − u2p2,in,m兲 + 2 f um2 1
⌬Pc1 = 2 f 共u2p2,in,m − u2p1,in,m兲 + ⌬Pc1, ⌬Pc2
关30兴
Kc1 = 0.6740+ 1.2501 p2 + 0.34172p2 − 0.83583p2;  p2 = W p2 Ⲑ Hch Kc2 = 0.6740+ 1.2501 + 0.34172 − 0.83583;  = Wch Ⲑ Hch Ke2 2 2 f um K 1 e1 ⌬Pe1 = 2 f 共u2p1,out,m − u2p2,out,m兲 + 2 f u2p2,out,m 1
⌬Pe1, ⌬Pe2
⌬Pe2 = 2 f 共u2p2,out,m − um2 兲 +
关30兴
Ke2 = 共1 − Ach Ⲑ A p2 兲 , Ke1 = 共1 − A p2 Ⲑ A p1 兲 2
⌬Pfd
2L 2 f f um fd dh 2
⌬Pfd =
关26兴
fRech = 24共1 − 1.355 + 1.947 − 1.7013 + 0.9564 − 0.2545兲 ⌬Pd =
⌬Pd
2
关26兴
2L 2 f app f um d dh
f app = Rech 关3.44共L+d 兲−0.5 + 关K共⬁兲 / 共4L+d 兲 + fRech − 3.44共L+d 兲−0.5兴 关1 + C共L+d 兲−2兴 兴
Ⲑ
1
L+d = Ld
Ⲑ
共Rechdh兲 ; K共⬁兲 = 0.6740+ 1.2501 + 0.34172 − 0.83583
Conclusions Flow development and pressure drop were investigated both experimentally and numerically for adiabatic single-phase water flow in a single 222 m wide, 694 m deep, and 12 cm long rectangular micro-channel at Reynolds numbers ranging from 196 to 2215. A micro-PIV system was used to map the velocity field, and pressure drop was measured with the aid of pressure transducers that were situated both upstream and downstream of the micro-channel. A three-dimensional computational model was constructed which provided a detailed description of the liquid velocity field in both the developing and fully developed regions. Key findings from the study are as follows 共1兲 Fairly good agreement is achieved between the model predictions and measured velocity field both in the developing and fully-developed regions of the microchannel 共2兲 At high Reynolds numbers, sharp entrance effects produce pronounced vortices immediately downstream of the inlet. These vortices produce a local maximum in
C = 共0.1811+ 4.3488 − 1.60272兲 ⫻ 10−4
centerline velocity and local pressure minimum, and have a profound influence on flow development downstream. 共3兲 The computational model shows excellent agreement with pressure drop measurements. Good agreement is also possible with conventional pressure drop correlations. 共4兲 This study proves the conventional Navier-Stokes equation accurately predicts liquid flow in micro-channels, and is therefore a powerful tool for the design and analysis of micro-channel heat sinks intended for electronic cooling.
Acknowledgment This work was supported by the Office of Basic Energy Sciences of the U.S. Department of Energy 共Award No. DE-FG0293ER14394 A7兲. Two of the authors 共S.Y.L. and S.T.W.兲 are grateful for the added support from the Indiana 21st Century Research and Technology Fund.
Nomenclature
Fig. 13 Numerically predicted variation of pressure along stream-wise direction for Rech = 196, 1021, 1895, and 2215
8 / Vol. 128, MARCH 2006
Ach A p1 A p2 C dh f f app Hch K共⬁兲 Kc1, Kc2 Ke1, Ke2 Lch L+d Ld Lfd L p2 P ⌬P ⌬Pc1, ⌬Pc2 ⌬Pe1, ⌬Pe2
⫽ ⫽ ⫽ ⫽ ⫽ ⫽ ⫽ ⫽ ⫽ ⫽ ⫽ ⫽ ⫽ ⫽ ⫽ ⫽ ⫽ ⫽ ⫽ ⫽
cross-sectional area of micro-channel cross-sectional area of deep plenum cross-sectional area of shallow plenum parameter in pressure drop correlation hydraulic diameter friction factor apparent friction factor for developing flow height of micro-channel entrance loss coefficient contraction loss coefficient expansion recovery coefficient length of micro-channel Nondimensional length of developing region length of developing region length of fully developed region length of shallow plenums pressure pressure drop across micro-channel contraction pressure loss expansion pressure recovery Transactions of the ASME
⌬Pd ⌬Pfd Re u uc um ¯u
⫽ ⫽ ⫽ ⫽ ⫽ ⫽ ⫽
v ⫽ ¯v ⫽
V˙ ⫽ w ⫽ W p2 ⫽ x,y,z ⫽ x⬘ , y ⬘ , z⬘ ⫽
pressure drop in developing region pressure drop in fully-developed region Reynolds number velocity component in x direction central line velocity mean velocity in micro-channel nondimensional velocity component in x direction velocity component in y direction nondimensional velocity component in y direction volume flow rate velocity component in z direction width of shallow plenum full domain coordinates micro-channel coordinates
Greek Symbols  ⫽ ⫽ ⫽ ⫽
aspect ratio viscosity density iteration number
Subscripts ch d exp f fd in m out pred p1 p2
channel; micro-channel developing region measured fluid fully developed region inlet average outlet predicted deep plenum shallow plenum
⫽ ⫽ ⫽ ⫽ ⫽ ⫽ ⫽ ⫽ ⫽ ⫽ ⫽
References 关1兴 Mudawar, I., 2001, “Assessment of High-Heat-Flux Thermal Management Schemes,” IEEE Trans. Compon. Packag. Technol., 24, pp. 122–141. 关2兴 El-Masri, M. A., and Louis, J. F., 1978, “On the Design of High-Temperature Gas Turbine Blade Water-Cooled Channels,” ASME J. Eng. Power, 100, pp. 586–591. 关3兴 Mudawar, I., El-Masri, M. A., Wu, C. S., and Ausman-Mudawar, J. R., 1985, “Boiling Heat Transfer and Critical Heat Flux in High-Speed Rotating Films,” Int. J. Heat Mass Transfer, 28, pp. 795–806. 关4兴 Tuckerman, D. B., and Pease, R. F. W., 1981, “High-Performance Heat Sinking for VLSI,” IEEE Electron Device Lett., 2, pp. 126–129. 关5兴 Ravigururajan, T. S., Cuta, J., McDonald, C. E., and Drost, M. K., 1996, “Single-Phase Flow Thermal Performance Characteristics of a Parallel MicroChannel Heat Exchanger,” Proceedings of National Heat Transfer Conference, Vol. 7, ASME HTD-329, pp. 157–166. 关6兴 Harms, T. M., Kazmierczak, M. J., and Cerner, F. M., 1999, “Developing Convective Heat Transfer in Deep Rectangular Microchannels,” Int. J. Heat Fluid Flow, 20, pp. 149–157. 关7兴 Rahman, M. M., 2000, “Measurements of Heat Transfer in Microchannel Heat Sinks,” Int. Commun. Heat Mass Transfer, 27, pp. 495–506.
Journal of Electronic Packaging
关8兴 Kawano, K., Minakami, K., Iwasaki, H., and Ishizuka, M., 1998, “Micro Channel Heat Exchanger for Cooling Electrical Equipment,” Proceedings of the ASME Heat Transfer Division, R. A. Nelson, L. W. Swanson, M. V. A. Bianchi, C. Camci, eds., Vol. 3, HTD-Vol.361-3/PID, pp. 173–180. 关9兴 Qu, W., and Mudawar, I., 2002, “Experimental and Numerical Study of Pressure Drop and Heat Transfer in a Single-Phase Micro-Channel Heat Sink,” Int. J. Heat Mass Transfer, 45, pp. 2549–2565. 关10兴 Knight, R. W., Goodling, J. S., and Hall, D. J., 1991, “Optimal Thermal Design of Forced Convection Heat Sinks—Analytical,” ASME J. Electron. Packag., 113, pp. 313–321. 关11兴 Knight, R. W., Hall, D. J., Goodling, J. S., and Jaeger, R. C., 1992, “Heat Sink Optimization With Application to Microchannels,” IEEE Trans. Compon., Hybrids, Manuf. Technol., 15, pp. 832–842. 关12兴 Lee, D. Y., and Vafai, K., 1999, “Comparative Analysis of Jet Impingement and Microchannel Cooling for High Heat Flux Applications,” Int. J. Heat Mass Transfer, 42, pp. 1555–1568. 关13兴 Choquette, S. F., Faghri, M., Charmchi, M., and Asako, Y., 1996, “Optimum Design of Microchannel Heat Sinks,” Micro-Electro-Mechanical Systems (MEMS) - 1996, DSC-Vol. 59, ASME, New York, pp. 115–126. 关14兴 Fedorov, A. G., and Viskanta, R., 2000, “Three-Dimensional Conjugate Heat Transfer in the Microchannel Heat Sink for Electronic Packaging,” Int. J. Heat Mass Transfer, 43, pp. 399–415. 关15兴 Qu, W., and Mudawar, I., 2002, “Analysis of Three-Dimensional Heat Transfer in Micro-Channel Heat Sinks,” Int. J. Heat Mass Transfer, 45, pp. 3973–3985. 关16兴 Peng, X. F., Peterson, G. P., and Wang, B. X., 1994, “Frictional Flow Characteristics of Water Flowing Through Rectangular Microchannels,” Exp. Heat Transfer, 7, pp. 249–264. 关17兴 Mala, G. M., and Li, D., 1999, “Flow Characteristics of Water in Microtubes,” Int. J. Heat Fluid Flow, 20, pp. 142–148. 关18兴 Papautsky, I., Brazzle, J., Ameel, T., and Frazier, A. B., 1999, “Laminar Fluid Behavior in Microchannels Using Micropolar Fluid Theory,” Sens. Actuators, A, A73, pp. 101–108. 关19兴 Qu, W., Mala, G. M., and Li, D., 2000, “Pressure-Driven Water Flow in Trapezoidal Silicon Microchannels,” Int. J. Heat Mass Transfer, 43, pp. 353–364. 关20兴 Pfahler, J., Harley, J., Bau, H. H., and Zemel, J. N., 1990, “Liquid Transport in Micron and Submicron Channels,” Sens. Actuators, A, A21–A23, pp. 431– 434. 关21兴 Choi, S. B., Barron, R. R., and Warrington, R. O., 1991, Fluid Flow and Heat Transfer in Micro Tubes, ASME DSC Vol. 40, pp. 89–93. 关22兴 Yu, D., Warrington, R. O., Barron, R. R., and Ameel, T., 1995, “An Experimental and Theoretical Investigation of Fluid Flow and Heat Transfer in Microtubes,” ASME/JSME Thermal Engineering Conference, Vol. 1, pp. 523– 530. 关23兴 Flockhart, S. M., and Dhariwal, R. S., 1998, “Experimental and Numerical Investigation into the Flow Characteristics of Channels Etched in 具100典 Silicon,” ASME J. Fluids Eng., 120, pp. 291–295. 关24兴 Judy, J., Maynes, D., and Webb, B. W., 2002, “Characterization of Frictional Pressure Drop for Liquid Flows through Microchannels,” Int. J. Heat Mass Transfer, 45, pp. 3477–3489. 关25兴 Wu, H. Y., and Cheng, D., 2003, “Friction Factors in Smooth Trapezoidal Silicon Microchannels With Different Aspect Ratios,” Int. J. Heat Mass Transfer, 46, pp. 2519–2525. 关26兴 Shah, R. K., and London, A. L., 1978, Laminar Flow Forced Convection in Ducts: A Source Book for Compact Heat Exchanger Analytical Data, Academic, New York, Supl. 1. 关27兴 Qu, W., and Mudawar, I., 2003, “Thermal Design Methodology for High-HeatFlux Single-Phase and Two-Phase Micro-Channel Heat Sinks,” IEEE Trans. Compon. Packag. Technol., 26, pp. 598–609. 关28兴 Lee, S. Y., Wereley, S. T., Gui, L., Qu, W., and Mudawar, I., 2002, “Microchannel Flow Measurements Using Micro Particle Image Velocimetry,” Proceedings of the ASME Fluid Engineering Division-2002, ASME, New York, FED-Vol. 258, A. Ognut, ed., pp. 493–500. 关29兴 Patankar, S. V., 1980, Numerical Heat Transfer and Fluid Flow, Hemisphere, Washington, D.C. 关30兴 Blevins, R. D., 1984, Applied Fluid Dynamics Handbook, Van Nostrand Reinhold, New York.
MARCH 2006, Vol. 128 / 9