Sep 8, 2017 - DOI: 10.1021/acsomega.7b00282. ACS Omega 2017, 2, 5641â5659. This is an open .... Similar effects are clearly seen in the UV spectra shown in. Figure 3, which .... The best-fit extinction-coefficient spectrum (Figure 3C, red trace) can be ...... with the predicted dimer fraction of 55% (of the total mass) at.
This is an open access article published under an ACS AuthorChoice License, which permits copying and redistribution of the article or any adaptations for non-commercial purposes.
Article http://pubs.acs.org/journal/acsodf
Experimental and Computational Modeling of H‑Bonded Arginine− Tyrosine Groupings in Aprotic Environments Andrew Toyi Banyikwa,†,§ Alan Goos,†,∥ David J. Kiemle,‡ Michael A. C. Foulkes,† and Mark S. Braiman*,† †
Chemistry Department, Center for Science & Technology, Syracuse University, Room 1-014, Syracuse, New York 13244, United States ‡ Analytical and Technical Services, SUNY College of Environmental Science and Forestry, 123 Jahn Laboratory, Syracuse, New York 13210, United States S Supporting Information *
ABSTRACT: H-bonds between neutral tyrosine and arginine in nonpolar environments are modeled by small-molecule phenol/guanidine complexes. From the temperature and concentration dependence of UV spectra, a value of ΔH° = −74 ± 4 kJ mol−1 is deduced for the formation of H-bonded pcresol/dodecylguanidine in hexane. ΔE = −71 kJ mol−1 is computed with density functional theory (in vacuo). In dimethyl sulfoxide or crystals, (p-phenolyl)alkylguanidines form head-to-tail homodimers with two strong H-bonding interactions, as evidenced by UV, IR, and NMR spectral shifts, strong IR continuum absorbance bands, and short O···N distances in X-ray crystal structures. Phenol/alkylguanidine Hbonded complexes consist of polarizable rapidly interconverting tautomers, with the proton shift from phenol to guanidine increasing with increase in the polarity of the aprotic solvent. As measured by NMR, both groups in these strongly H-bonded neutral complexes can simultaneously appear to be predominantly protonated. These systems serve as models for the hypothetical hydrogen-Bonded Uncharged (aRginine + tYrosine), or “BU(RY)”, motifs in membrane proteins.
■
INTRODUCTION There has been little experimental modeling of H-bonding interactions between the guanidine group of arginine and the phenolic group of tyrosine, especially with the guanidine in a deprotonated state. Geometries suitable for H-bonding between tyrosine and arginine were for a long time quite uncommon in observed crystal structures of proteins, making such H-bonds a relatively uninteresting field of study. (See section titled “Possible New Motif for Membrane Protein Structures”, for more details on the relative infrequency of such groupings in the crystallographic database.) However, this has changed recently with the publication of a number of crystal structures of active intermediates of membrane proteins, in which conserved arg−tyr pairs approach each other within a hydrophobic region of the protein interior, in a geometry that would permit H-bonding between them. Examples were seen first in the M state of bacteriorhodopsin (bR), a microbial rhodopsin,1 and subsequently in bovine opsin, a G-protein-coupled receptor (GPCR).2 (For an explanation of the distinction between these the two major superfamilies of heptahelical transmembrane (7-TM) proteins, see a recent review of microbial rhodopsins.3) In examples from both these superfamilies,1,2 the conformational change that forms the active intermediate involves significant displacement © 2017 American Chemical Society
of a highly conserved arginine in the third transmembrane helix, away from an asp or glu salt-bridge partner and into a less-polar protein environment that includes a conserved tyr. Evidence for arg−tyr interaction can be seen in greater detail in more recent crystal structures of metarhodopsin II (Meta II), with and without the C-terminal binding portion of the α subunit of Gt, GαCT (see Figure 1). These structures show that one of the key interactions in Meta II involves the protrusion of GαCT deep into the protein interior, allowing a direct Hbonded interaction of the backbone of GαCT with the highly conserved arginine (R135 in rhodopsin).4 Each time a Gt binds to a Meta II in this fashion, the Gt nucleotide-binding site opens up, permitting the spontaneous release of GDP, and replacement with GTP from solution. This cyclical, catalytic G-protein activation process clearly depends on the specificity, tightness, and reversibility of the binding of Gt to Meta II. Many aspects of the binding interaction are conserved in other GPCR systems. Both arginine and tyrosine side chains are generally thought to be protonated (cationic and neutral, respectively) in most Received: March 9, 2017 Accepted: June 28, 2017 Published: September 8, 2017 5641
DOI: 10.1021/acsomega.7b00282 ACS Omega 2017, 2, 5641−5659
ACS Omega
Article
Figure 1. H-bonding interactions of the conserved arginine−tyrosine grouping in activated rhodopsin (Meta II), without (left) and with (right) the peptide backbone of the bound C-terminal portion of transducin (GαCT, with a backbone shown in green in the right panel). Coordinates were obtained from data published with 3.0 Å (3XPO) and 2.85 Å (3PQR) resolutions, respectively.4 In Meta II without GαCT (at left), one of terminal nitrogens of Arg135 from TM3 is only 2.7 Å from the Tyr223 oxygen atom. The other two nitrogens are not within the H-bond distance to donor or acceptor group detected in the crystal structure. Upon binding of Meta II with GαCT (right panel), the latter protein’s Val347 backbone CO group serves as an H-bond acceptor for the other terminal nitrogen of Arg135, as well as for the intrachain nitrogen, with N−O distances of 3.0 and 3.1 Å, respectively. (Only the former distance is indicated by a dashed line in this figure.) Furthermore, the C-terminal carboxylate of GαCT moves in to become the closest anion, ∼9 Å away from Arg135. Formation of these ionic and H-bonding interactions between GαCT and Arg135 apparently weakens the H-bonding interaction of the arginine with tyr223, as evidenced by an increased N−O distance (3.3 Å in the right panel).
Scheme 1. Three Possible Protomeric Configurations for Arg−Tyr Dyads in Nonpolar Environments
bond donor, as well as neutral (deprotonated) arginine taking on the new role of H-bond acceptor (right). Scheme 1B,C are the proton-limiting structures of an overallneutral H-bonded pair. That is, they differ only by a very small movement of a proton within an H-bond. Therefore, if either is present, the other is expected also to be present, in rapid equilibrium. We modeled structures B/C computationally; and A−C experimentally by synthesizing model compounds that exhibited these three structures in properly selected aprotic solvents, based on spectroscopic evidence. Three common aprotic solvents, and one protic solvent used as a control, were chosen to span a wide range of dielectric constants (ε): hexane (ε = 1.8), CCl4 (ε = 2.2), dimethyl sulfoxide (DMSO, ε = 47), and methanol (ε = 33). This span includes the smaller ranges generally assumed for protein and membrane interiors. These solvents were also selected for several other important properties, including ready availability with needed isotope variations for NMR; maintaining chemical stability of our samples; and allowing sufficient solubility of them to obtain UV, IR, and/or NMR spectra with suitable signal/noise ratios. Water itself is not generally a suitable solvent for spectroscopy of any of the deprotonated guanidine compounds because hydroxide-catalyzed hydrolysis occurs within minutes at high pH. We were also able to crystallize several of the model compounds in the forms corresponding to both A and B. Using our model systems, we demonstrate that the netneutral pair (structures B and C in Scheme 1) can indeed be formed with well-defined stoichiometry in the three aprotic
biological environments, including the highly conserved arginine−tyrosine grouping within Meta II (Figure 1), as well as other activated GPCRs.6−9 However, interpretation of these side chains’ protonation and H-bonding state in these structures is complicated by their unusually aprotic environment. In the published crystal structure of Meta II in the absence of GαCT (3XPO, Figure 1), numerous structural water molecules are observable in the protein interior, but the closest is at a distance of ∼8.5 Å from arg135.4,5 In fact, the environment within 5 Å of the arg135−tyr223 H-bond consists almost exclusively of hydrocarbon side chains. Such an environment is very different from those that have previously been used to model the arginine side chain spectroscopically.10,11 Deprotonated arginine side chains, and H-bonded arginine−tyrosine dyads, should be spectroscopically modeled in aprotic environments similar to these proteins’ interiors. The current study, and the accompanying paper,12 provides some key steps toward achieving this. Scheme 1 summarizes three generalized proton configurations corresponding to H-bonded arginine−tyrosine dyads that would most likely be observable in nonpolar environments. The first (A) involves neutral tyrosine acting as an H-bond acceptor for protonated arginine, which additionally participates in a stabilizing Coulombic interaction with a nearby counterion (X−). The second (B) involves a zwitterion comprising deprotonated tyrosine and protonated arginine, in which the tyrosine oxygen again acts as an H-bond acceptor. The third (C) is fully neutral, comprising neutral tyrosine serving as an H5642
DOI: 10.1021/acsomega.7b00282 ACS Omega 2017, 2, 5641−5659
ACS Omega
Article
basis set was used (e.g., 6-311G** as compared to 6-31G**), the computed binding energy remained unchanged to within ∼1%. In the optimized geometry (Figure 2A), both H-bonds are significantly nonlinear. For example, there is a 158° O−H−N angle for the primary H-bond, which has a 2.60 Å distance from the phenolic oxygen to the imino nitrogen. There is also a more distorted secondary (2.90 Å) H-bond, from an amine nitrogen back to the oxygen. Formation of the H-bond(s) resulted in significant lengthening of the O−H covalent bond length, to 1.03 Å (from 0.98 Å in isolated p-cresol). A similar H-bonding geometry was obtained when the ethylguanidine and cresol were linked together with a dodecyl chain, as shown in Figure 2B. One interesting difference is the involvement of the intrachain NH group in the H-bond, instead of only the two terminal nitrogens. Despite the overall similar bond lengths and angles for the H-bonding groups as in Figure 2A, the binding energy in Figure 2B is only −39 kJ mol−1. In this case, the reference state was the optimized local energy minimum, with an extended dodecyl chain in an all-s-trans conformation. Presumably, the H-bond energy in Figure 2B, which by itself would not be expected to be greatly different than that in Figure 2A, was significantly canceled by unfavorable strain introduced in the alkane chain. UV Spectroscopic Detection of Phenol−Guanidine HBonding in Hexane. The formation of p-cresol/alkylguanidine complexes in nonpolar solvents was confirmed experimentally by UV spectral measurements. The ∼280 nm absorption band of the phenol group is strongly affected by the formation of H-bonded complexes, as has been shown previously using amines as the H-bond acceptor groups.13,14 Similar effects are clearly seen in the UV spectra shown in Figure 3, which demonstrates the interaction between p-cresol and dodecylguanidine in hexane. From these data, we determined a value for the enthalpy of complex formation in hexane (ΔH° = −74 ± 4 kJ mol−1) that closely matched the computed in vacuo ΔE = −71 kJ mol−1. (The closeness of this match is fortuitous; see Discussion.) Details of this experimental determination are as follows.
solvents examined, and structure B can be observed in the crystalline state. The H-bond between guanidine and phenol in such overall-neutral systems is not only unusually strong but also highly polarizable. In the least-polar environments, both protomers participate nearly equally. These results allow more accurate spectroscopic modeling of membrane-buried arg−tyr dyads that might undergo deprotonation, that is, with overall loss of a proton shared between arginine and a nearby tyrosine. We term this an H-Bonded Uncharged (aRginine−tYrosine), or “BU(RY)” dyad. We also present a specific hypothesis for the role such a BU(RY) dyad might play in G-protein activation by GPCRs.
■
RESULTS Computational Studies of the Phenol−Guanidine HBond. The complex between p-cresol and monoalkylguanidines was modeled by using density functional theory (DFT). Rather than dodecylamine itself, the computational modeling used the shorter alkyl chain of ethylguanidine. The energyoptimized structure of the 1:1 complex of p-cresol with ethylguanidine in vacuo is shown in Figure 2A (see Supporting
Figure 2. DFT-computed H-bonding geometries. (A) p-Cresol/ ethylguanidine complex. (B) Internally H-bonded p-phenol-dodecylguanidine. See Supporting Information for computational details and energy-optimized Cartesian coordinates.
Information for details). The computed binding energy is −71 kJ mol−1, which corresponds to the energy of the optimized geometry (Figure 2A), relative to the sum of the energies of the same two molecules optimized individually. Even when a larger
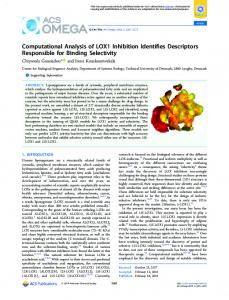
Figure 3. UV absorption spectra demonstrating the reversible complexation of p-cresol with equimolar dodecylguanidine in hexane. Spectra were obtained as a function of total concentration of p-cresol (A, in which all seven spectra were measured at 58 °C; the inset shows a log−log plot of A308 vs total concentration); or as a function of temperature (B, in which all eight spectra were measured with 0.50 mM total concentrations of p-cresol and dodecylguanidine; the inset shows a van’t Hoff plot). Temperatures in (B) are indicated by trace colors: blue, 58 °C; green, 60 °C; orange, 62 °C; red, 64 °C. Two nearly superimposed traces of each color are plotted, measured during up-then-down temperature steps. Spectral traces in black (overlapping curves near 0 absorbance) in (A) and (B) represent the residuals after subtracting the best-fitted linear combination of the spectra of free p-cresol and complexed p-cresol/dodecylguanidine (C). The contribution of free p-cresol was computed as the measured extinction-coefficient spectrum of pure p-cresol in hexane (C, black trace), multiplied by its measured total concentration and the best-fit mole fraction for it. These 11 mole fractions of free p-cresol, 1 for each of the 11 measured spectra, were calculated as 1 − Xi, where the values of Xi were 11 of the 512 adjustable parameters during the least-squares fit. These Xi were the mole fractions of the p-cresol present as a 1:1 complex with dodecylguanidine. All 501 values of the extinction-coefficient spectrum of this 1:1 complex (C, red trace) were also optimized during the fit. See Supporting Information for further details. 5643
DOI: 10.1021/acsomega.7b00282 ACS Omega 2017, 2, 5641−5659
ACS Omega
Article
complex. A higher-order complex would be expected to show a higher-power concentration dependence. It was possible to determine more precise values of equilibrium concentrations by fitting a wider range of wavelengths simultaneously. At a total concentration near 1 mM and temperatures near 60 °C, the 1:1 mixture of p-cresol and dodecylguanidine shows a broad spectral shape with a variable plateau from 298 to 310 nm (Figure 3A,B). The relative size of this plateau decreases either upon overall dilution with hexane (Figure 3A) or upon heating (Figure 3B). The reversibility of the complexation reaction is demonstrated by the nearly perfect superposition of spectra in Figure 3B obtained during heating (from 58 to 64 °C) and then cooling (from 64 to 58 °C), at intervals of 2 °C There was evidence for ∼1% overall decrease in p-cresol content over the course of the entire heating−cooling cycle, as evidenced by a uniform decrease in the entire absorption spectrum in the final spectrum at 58 °C, as compared with the initial spectrum at the same temperature. This continual slow loss of sample was corrected (to first order) during the subsequent data analysis by averaging the identical-temperature spectra pairwise from the heating−cooling cycle. By subtracting out differently weighted amounts of the pure p-cresol spectrum in hexane (Figure 3C, black trace), it required only a simple least-squares fitting procedure to compute the shape of the UV spectrum of the single additional component (Figure 3C, red trace) that could best account for all the measured spectra in Figure 3A,B. The fitting procedure utilized singular value decomposition (SVD) to minimize the sum-of-squares in the residual absorbance spectra (thin black traces in Figure 3A,B) that could not be accounted for by linear combinations of just p-cresol and one other species. This SVD-based fitting procedure gave a unique spectral shape, but not its vertical scale. That is, based solely on the SVD procedure, the fitted spectral bandshape (Figure 3C, red trace) could be rescaled vertically by any arbitrary factor. Choosing the scale for the red trace in Figure 3C required one additional assumption, namely, that the eight different concentrations of the 1:1 complex, deduced from the properly scaled extinction-coefficient spectrum, should give the same equilibrium constant for 1:1 complex formation, Kcomplex, for all eight dilutions measured at 58 °C (seven measurements in Figure 3A, plus one in Figure 3B). In fact, the scale was optimized to minimize the standard deviation among eight resultant values of ΔG°, rather than among the values of Kcomplex itself (see Table 2-S in Supporting Information for details). The optimization gave a value of ΔG° = −23.5 ± 0.8 kJ mol−1 at 58 °C, corresponding to Kcomplex = 5100 ± 1500 M −1. The reciprocal of this Kcomplex represents the dissociation constant in hexane at 58 °C, Kd = 0.195 ± 0.06 mM. The moderate standard deviation is generally consistent with the initial hypothesis that 1:1 complexation is the main reaction occurring over the 12-fold concentration range used in these experiments, although clearly this is not the whole story. The best-fit extinction-coefficient spectrum (Figure 3C, red trace) can be most easily interpreted as involving two species in rapid internal proton-transfer equilibrium, corresponding to structures B and C in Scheme 1. These structures give rise, respectively, to “guanidinium/phenolate” absorbance near 310 nm and “guanidine/phenol” absorbance near 280 nm in Figure 3C. However, even the latter subcomponent shows a
First, absorption spectra of the unassociated species were determined. When dissolved by itself in hexane, p-cresol gives a strong UV absorption with a maximum at 278 nm as well as vibronic structure (Figure 3C, black trace). This spectrum shows no sign of concentration dependence below ∼10 mM. Similarly, dilute dodecylguanidine free base in hexane shows no measurable extinction coefficient (