Hindawi International Journal of Rotating Machinery Volume 2017, Article ID 1805051, 14 pages https://doi.org/10.1155/2017/1805051
Research Article Experimental Aspects in the Vibration-Based Condition Monitoring of Large Hydrogenerators Geraldo Carvalho Brito Junior,1,2 Roberto Dalledone Machado,2 Anselmo Chaves Neto,2 and Mateus Feiertag Martini1 1
Center for Engineering and Exact Sciences, Western Paran´a State University (UNIOESTE), Foz do Iguac¸u, PR, Brazil Numerical Methods for Engineering Graduate Program, Federal University of Paran´a (UFPR), Curitiba, PR, Brazil
2
Correspondence should be addressed to Geraldo Carvalho Brito Junior;
[email protected] Received 28 November 2016; Accepted 24 January 2017; Published 20 February 2017 Academic Editor: Luis A. San Andr´es Copyright © 2017 Geraldo Carvalho Brito Junior et al. This is an open access article distributed under the Creative Commons Attribution License, which permits unrestricted use, distribution, and reproduction in any medium, provided the original work is properly cited. Based on experimental observations on a set of twenty 700 MW hydrogenerators, compiled from several technical reports issued over the last three decades and collected from the reprocessing of the vibration signals recorded during the last commissioning tests, this paper shows that the accurate determination of the journal bearings operating conditions may be a difficult task. It shows that the outsize bearing brackets of large hydrogenerators are subject to substantial dimensional changes caused by external agents, like the generator electromagnetic field and the bearing cooling water temperature. It also shows that the shaft eccentricity of a journal bearing of a healthy large hydrogenerator, operating in steady-state condition, may experience unpredictable, sudden, and significant changes without apparent reasons. Some of these phenomena are reproduced in ordinary commissioning tests or may be noticed even during normal operation, while others are rarely observed or are only detected through special tests. These phenomena modify journal bearings stiffness and damping, changing the hydrogenerator dynamics, creating discrepancies between theoretical predictions and experimental measurements, and making damage detection and diagnostics difficult. Therefore, these phenomena must be analyzed and considered in the application of vibration-based condition monitoring to these rotating machines.
1. Introduction Hydroelectricity plays an important role in the world. The electrical systems of several countries have hundreds of medium-sized and large-sized hydrogenerators, some of which have been in operation almost uninterrupted over the past 30 to 50 years. Due to their individual importance and relatively advanced age, the application of vibrationbased condition monitoring to large hydrogenerators (LHG) is needful. The basis of this technique is well known: a healthy machine has a kind of vibration fingerprint, which changes with the advent of damage. The change of this vibration fingerprint is used to detect and identify the damage [1]. Vibration monitoring is successfully applied to standard rotating machinery in many branches of the industry; it is considered one of the few examples where structural health monitoring technology did “the transition from research
to practice” [2]. However, LHG are tailor-made machines, designed specifically for each power plant. Due to minor differences in assembly, the fingerprints of two apparently identical LHG may be very different from each other [3]. Besides, as it will be shown in the following, the fingerprint of a healthy LHG may have significant changes without apparent reasons. LHG are usually equipped with tilting pad journal bearings, components that have significant influence on their vibratory behavior. The forces generated in the bearing oil film are nonlinear functions of the shaft displacement and velocity. If these two magnitudes are low enough, these forces may be linearized around the shaft static equilibrium position, defining the bearing stiffness and bearing damping coefficients [4]. Bearing coefficients have been studied for a long time. Nevertheless, these studies have mostly been carried out for flexible horizontal machines that operate at
2 supercritical speeds, equipped with shafts of relatively small diameter and bearings with a low number of pads. LHG, on the contrary, commonly are vertical assembly machines that operate at subcritical speeds, equipped with rigid shafts of large diameters, with outsize bearing brackets and using journal bearings with many pads. Besides, bearings of horizontal machines are loaded with the machine weight, in a known direction. As detailed by N¨asselqvist et al. [5], the LHG journal bearings do not have predefined static loads. As will be demonstrated later, the magnitudes and directions of the static loads in these bearings are variable and unknown. These features result in particularities in the dynamic behavior of LHG whose knowledge is essential for the application of vibration-based condition monitoring techniques on those rotating machines. The main objective of this paper is to describe several phenomena observed in a set of twenty 700 MW hydrogenerators belonging to Itaipu Power Plant (Itaipu is a 14000 MW hydroelectric power plant, located in South America, in the Parana River, belonging to both Brazil and Paraguay governmental electrical utilities holding companies), which may cause significant changes in the dynamic coefficients of the journal bearings and, therefore, in the dynamic behavior of those machines. These phenomena were obtained from compilation of several technical reports issued during the last three decades and from the reprocessing of the vibration signals recorded during the last commissioning tests. Some of these phenomena are reproduced in ordinary commissioning tests or may be noticed in normal operation, while others are rarely observed or are only detected through special tests.
2. Literature Review The using of mathematical modeling to support vibrationbased condition monitoring of hydrogenerators has begun in the 1980s due to some cases of chronic dynamic problems. At that time, based on empirical knowledge, bearing stiffness was overestimated, minimizing the dynamic influences of the oil film. For instance, Sperber and Weber [6] show that a 160 MW hydrogenerator was modeled using bearing stiffness with two orders of magnitude higher than bracket stiffness. Certainly, bearing stiffness had few influence on this LHG dynamics. During the design phase, the manufacturer performed the dynamic analysis of the 700 MW hydrogenerators of Itaipu Power Plant using the bearing stiffness determined theoretically [7]. Almost ten years later, Cardinali et al. [8] modeled the formerly mentioned 160 MW hydrogenerator, also using bearing coefficients determined in the same way. In both cases, the stiffness of bearings and brackets had the same order of magnitude. Gustavsson et al. [9] proposed a method to estimate experimentally the stiffness and damping coefficients of journal bearings, using strain gauges to measure the radial load acting on the bearing. The bearing stiffness estimated with this method in a 238 MW hydrogenerator showed fluctuations in the range of 0.40 to 0.80 GN/m. These values are much lower than bracket stiffness; furthermore, they are one order of magnitude lower than the bearing stiffness determined in the previous references ([7, 8]).
International Journal of Rotating Machinery N¨asselqvist et al. [10] found a similar proportion between the bearing stiffness and the bracket stiffness, both determined theoretically, in a case study of resonance in a 42 MW vertical hydrogenerator. The first remarkable information, from the described references, is that the bearing stiffness is much lower or has the same order of magnitude of bearing bracket stiffness. Consequently, bearing stiffness has major effects in the dynamic behavior of LHG. The understanding of this stiffness and its influencing factors is of fundamental importance for vibration-based condition monitoring of these machines. A second important remark concerns the determination of bearing operating conditions. According to Tiwari et al. [11], the theoretical estimation of bearing dynamic coefficients “has been a source of error in the prediction of rotor-bearing systems” due to the difficulties of determining bearing operating conditions accurately. These difficulties are amplified in the case of large hydrogenerators, mainly due to the vertical assembly of these machines [5]. For instance, to determine the bearing operating conditions of Itaipu hydrogenerators, the manufacturer assumed that a magnetic pull of 600 kN was acting on the journal bearings [7]. N¨asselqvist et al. [10] determined bearing stiffness using a prescribed load of 30 kN; as indicated by performed measurements, this is the load on the journal bearings during normal operation. Cardinali et al. [8] modeled the already referred 160 MW hydrogenerator in two different ways. The first used a nonlinear model, where the LHG equation of motion was solved simultaneously with the Reynolds equations of the journal bearings. The second way used a linear model, where the journal bearing effects were represented by dynamic coefficients. The operating conditions of the journal bearings were defined to achieve the highest coincidence between the characteristic frequencies of both linear and nonlinear models, which constitutes a complex process. Fulei et al. [12] determined the shaft static working point using numerical simulations based on commercial software. Xu et al. [13] included the boundary conditions as part of the hydrogenerators shaft model and used the previously calculated values of the bearing forces in a database, relating forces and operating conditions. According to the method proposed by Gustavsson et al. [9], the journal bearing operating condition was determined by measuring the bearing load with strain gauges, which is not always possible or feasible. As an alternative to the direct measurement of the bearing load, N¨asselqvist et al. [14] proposed the estimation of bearing load using the measured shaft eccentricity together with curves relating these two parameters, determined previously. The estimation of shaft eccentricity was improved by using four proximity transducers in each journal bearing plane instead of the two usual transducers. This process attenuates the effects of symmetrical deformations in the bearing housing, similar to the process used in generator air gap monitoring. However, as will be shown later in this paper, these bearing deformations may be asymmetrical. As a preliminary conclusion, it is possible to say that all the described methods to determine the operating conditions of a journal bearing have either considerable uncertainties or difficulties in their implementation.
International Journal of Rotating Machinery
12
3
6
3
4
9
13
Transducers Y-direction
12
1 7 4
1
11
Shaft
10
2
1
10
Pad 3
5
9
8
Transducers
11
4 X-direction 3
8 5
2
7
Accelerometer Transducers support Proximity transducer
6
2
Figure 1: View of Itaipu Power Plant hydrogenerators. Figure 2: Vibration transducers arrangement in the turbine journal bearing.
Based on experimental observations, this paper shows that the determination of bearing operating conditions in LHG may be even more difficult. This paper shows that the outsize bearing brackets of these machines are subject to significant dimensional changes caused by external agents, like the generator electromagnetic field or the bearing cooling water temperature, which modifies pad clearances distribution significantly. It also shows that the shaft eccentricity in the journal bearing of a healthy large hydrogenerator, operating in steady-state condition, may present unpredictable, sudden, and significant changes, without apparent reasons. These phenomena modify bearing stiffness and damping, changing significantly the vibratory behavior of the large hydrogenerator and making damage detection and diagnostics difficult. These phenomena were detected in practically all the observed hydrogenerators and it is very probable that this is a typical behavior of these machines. Therefore, it is suggested to verify these occurrences in similar hydrogenerators.
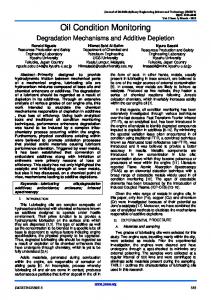
3. The Large Hydrogenerators and the Vibration Transducers 3.1. The Large Hydrogenerators. All the experimental results and numerical simulations shown in this paper are related to the 700 MW hydrogenerators of Itaipu Power Plant, main characteristics of which are described as follows. Figure 1 displays the generator (1) and turbine (2) rotors as well as the upper (3) and lower (4) shafts of the generator and the turbine shaft (5). The nominal rotating speeds are 90.9 r/min for the 10 machines that operate at 50 Hz and 92.3 r/min for the remaining 10 hydrogenerators, which generate electrical energy at 60 Hz. Figure 1 shows the main components of the upper journal bearing, the shaft (3), the bearing pads (6), and the bearing bracket (9).
Likewise, it shows the lower journal bearing components, the generator lower shaft (4) and the thrust block and bearing pads (7), including the thrust bearing bracket (10). Figure 1 also shows the turbine journal bearing (8) and the turbine headcover (11). Finally, this figure shows the generator outputs to the transformers (12) and to the neutral connection (13). Table 1 presents the main data of these journal bearings, including the bearing global stiffness (shaft, oil film, bracket, and foundation) and the bearing oil film direct stiffness, both determined at the design phase of these hydrogenerators [7]. All journal bearings have flooded and pressurized design. 3.2. The Vibration Transducers 3.2.1. Vibration Transducers Arrangement. Figure 2 shows the typical arrangement of the vibration transducers in a journal bearing. Each bearing has two 4 V/mm proximity transducers, eddy current type, to measure the shaft relative vibrations. The accuracy class of these transducers (±5%) was certified by a calibration before installation. These transducers were installed 90∘ apart from each other (𝑋-direction and 𝑌-direction) between two adjacent bearing pads, place where the shaft surface has better finishing. Despite the difficulties of installing these transducers inside the bearings, this arrangement has a significant advantage for vibrationbased condition monitoring: the proximity transducers are monitoring the journal bearing’s main stiffness. Each journal bearing also has two low frequency piezoelectric accelerometers, of industrial type and of high sensitivity (1000 mV/g), to measure the bearing absolute vibrations. The accuracy class (±5%) of these transducers was also confirmed by calibration just before installation. The accelerometers were installed in the bearing structure, in the same support of the proximity transducers. The acceleration
4
International Journal of Rotating Machinery
Table 1: Main data of the generator upper journal bearing (UJB), generator lower journal bearing (LJB), and turbine journal bearing (TJB). Symbol 𝑛𝑝 𝑟 𝑅 𝑈 = 𝜔𝑟 𝑐0 𝑐 𝑚 𝛼𝑅 𝛽𝑅 𝐿 𝑚𝑝 𝑘𝑏𝑖𝑖 𝑘𝑏𝑖 — 𝜂 𝜌 𝜗lub
Description Number of pads Journal radius Bearing pad radius Journal speed Nominal pad clearance at standstill Nominal pad clearance in operation Bearing preload Distance trailing edge, pivot Pad length Pad width Pad mass Bearing direct stiffness (average) Bearing global stiffness Lubricant type Lubricant viscosity at 40∘ C Lubricant density at 20∘ C Lubricant temperature range
signals were integrated by charge amplifiers. Hence, except where it is otherwise clearly indicated, in this article, the absolute vibration signals are expressed in velocity. 3.2.2. Difficulties in Measuring Absolute Vibrations of LHG Journal Bearings. The use of piezoelectric accelerometers to measure the absolute vibrations of LHG journal bearings has some significant problems. The experimental observations have shown that, sometimes, for reasons still unknown, when a healthy LHG operates at steady-state condition, these vibration signals show sudden and strong variations, as if the journal bearing has received an impact. The maintenance records do not show indications of possible impacts; however, such anomalous behavior may produce false alarms in a monitoring system. Another important problem with accelerometers is the measurement of low frequency vibrations or vibrations at LHG rotating speed [15]. Even in the case of significant bearing vibrations at the rotating speed, the signal generated by an accelerometer of high sensitivity has only a fraction of millivolts. For example, an accelerometer of 1000 mV/g generates a signal of 0.19 mV when submitted to a sinusoidal vibration of 20 micrometers (𝜇m) at 92.3 r/min. The measurement and the transmission of this low voltage signal require special care, particularly in a noisy environment like a power plant. There are traditional velocity transducers of high sensitivity (50 mV/mm/s), equipped with a signal conditioner that extends its measuring range down to 1 Hz or to 0.5 Hz, with −3 dB. Theoretically, the voltage of the signal generated by these transducers, for the same bearing vibration, is fifty times higher than that produced by the accelerometer previously described. Therefore, these vibration signals would be more suitable to be handled. However, the datasheet of some of these transducers shows considerable fluctuations in their sensitivity at the low frequency range from 0 to −5 dB at 1 Hz.
Unit — mm mm m/s 𝜇m 𝜇m — mm mm mm kg GN/m GN/m
UJB 16 1100 1103 10.6 500 200 0.933 140 350 400 172 6.70 0.80
Pas kg/m3 ∘ C
0.047 873 40–55
LJB 16 2600 2604 25.1 950 300 0.925 248 620 310 290 2.85 1.25 Lubrax Turbina Plus 50 0.047 873 40–55
TJB 12 1600 1633 15.5 200 200 0.994 250 500 500 390 6.70 1.45 0.047 873 40–50
4. Remarks on the Dynamics of LHG Based on Experimental Observations This section describes several phenomena that frequently occur in LHG, causing changes in the shaft eccentricity, in the lubricant viscosity, or in the clearances of the journal bearings. As consequence, these phenomena may have significant influence on the LHG dynamics. 4.1. Remarks Based on Vibration Analysis 4.1.1. Typical Shaft and Bearing Vibrations in Normal Operating Conditions. Figure 3 shows the typical shaft relative and the bearing absolute vibrations in 𝑋-direction and 𝑌direction of the upper journal bearing of a healthy LHG, in time and frequency domains. The vibration signals were sampled with 2400 Hz and their power spectral densities were estimated using Welch’s method, with a Hann window. Table 2 shows the main descriptors of these vibrations, obtained in ten different measurements. The first five measurements were done during a month, while the remaining measurements were taken eight months later, also over a period of a month. Shaft vibrations occur mainly at the rotating speed (1x), with small amplitudes at twice this frequency (2x). Bearing vibrations have components in many frequencies (e.g., 0.88, 1.52, 4.54, 11.4, 39.4, and 46.7 Hz), always with significant differences between 𝑋-direction and 𝑌-direction. There are also components at 100, 200, and 400 Hz, originated by the magnetic forces transmitted from the stator core through the bearing bracket arms [16]. Considering the three journal bearings, shaft relative vibrations occur mainly at 1x and 2x the rotating frequency, probably originated by imbalances of hydraulic and magnetic origins. The uncertainties of these vibrations come from the shaft electrical and mechanical runout which, in a first
International Journal of Rotating Machinery Shaft vibration
200 150
0.6
100
0.4
50
0.2
0 −50
0 −0.2
−100
−0.4
−150
−0.6
−200
0
1
2
3
4
5 (s)
Bearing vibration
0.8
(mm/s )
(𝜇m)
5
6
7
8
9
−0.8
10
0
Dir. X Dir. Y
1
2
3
6
7
8
9
10
(b)
100
0.08
80
0.06 (mm/sp )
(𝜇mp )
5 (s)
Dir. X Dir. Y (a)
60 40
0.04 0.02
20 0
4
0
10
20
30 (Hz)
40
50
0
60
0
Dir. X Dir. Y
10
20
30 (Hz)
40
50
60
Dir. X Dir. Y (c)
(d)
Figure 3: Shaft relative vibrations ((a) and (c)) and bearing absolute vibrations ((b) and (d)), in 𝑋-direction and 𝑌-direction, in time domain ((a) and (b)) and in frequency domain ((c) and (d)), measured at the UJB of a LHG operating with 617 MW (01.14.10). Table 2: Typical shaft relative and bearing absolute vibrations in the upper journal bearing of a LHG. Date 04.03.09 04.07.09 04.14.09 04.22.09 04.29.09 01.06.10 01.14.10 01.21.10 01.22.10 01.28.10
Power [MW] 522 583 694 680 682 638 617 474 629 552
Shaft relative vibration [𝜇m𝑝 ] 𝑋-direction Peak 1x 63 66 67 64 56 61 60 57 62 58
23 26 23 23 12 32 32 28 30 29
2x 0 0 0 0 0 1 2 2 1 2
Bearing absolute vibration [mm/sRMS ]
𝑌-direction Peak 1x 80 79 65 63 59 83 81 76 83 73
moment, cannot be estimated with accuracy. The 2x component of shaft vibration may be significant in some bearings, indicating excessive shaft eccentricity and consequent higher nonlinearity. Bearing vibrations show significant differences between 𝑋-direction and 𝑌-direction in magnitudes and
44 45 35 32 26 46 46 42 44 40
2x
𝑋-direction RMS 1x
3 3 3 2 4 3 2 2 2 3
0.13 0.11 0.14 0.13 0.13 0.16 0.13 0.10 0.15 0.11
0.01 0.04 0.04 0.00 0.00 0.01 0.01 0.01 0.00 0.01
2x 0.00 0.00 0.00 0.00 0.00 0.00 0.01 0.00 0.00 0.00
𝑌-direction RMS 1x 0.13 0.11 0.14 0.14 0.14 0.15 0.13 0.10 0.14 0.11
0.03 0.01 0.01 0.03 0.03 0.05 0.05 0.05 0.05 0.05
2x 0.00 0.01 0.00 0.00 0.01 0.00 0.00 0.00 0.00 0.00
frequency contents. Sometimes there is a vibration component at the rotating frequency, and sometimes there is not, possibly due to the low excitations at this frequency and the difficulties described in Section 3.2.2. The turbine journal bearing absolute vibrations frequently have a significant
6
International Journal of Rotating Machinery 2.40
2.20
2.00
1.80 1.70
1.90 2.10 SH-UJB-X (mm) Balan - t2 G4.25 - t1 G4.25 - t1 + 7.0 h
1.90
1.70
1.50 1.65
2.30
SH-TJB-Y (mm)
2.10
SH-LJB-Y (mm)
SH-UJB-Y (mm)
2.40
1.85 2.05 SH-LJB-X (mm)
Balan - t2 + 5.5 h G4.25 - t1 + 5.5 h G6.65 - t0
2.20
2.00
1.80 1.80
2.25
2.00 2.20 SH-TJB-X (mm)
2.40
Balan - t2 + 6.0 h G4.25 - t1 + 6.5 h G6.65 - t0 + 0.5 h
Figure 4: Shaft eccentricity in the upper, lower, and turbine journal bearings of a LHG at speed-no-load condition, with the generator rotor balanced (Balan) and unbalanced, with ISO quality grades G4.25 and G6.65.
2.60
2.10
1.90
1.70 1.80
2.00 2.20 SH-UJB-X (mm) 0 247− 486
45 247+ 544
2.40
SH-TJB-Y (mm)
2.10
SH-LJB-Y (mm)
SH-UJB-Y (mm)
2.30
1.90
1.70
1.50 1.60
88 319 601
1.80 2.00 SH-LJB-X (mm) 139 381 642
2.20
2.40
2.20
2.00 1.90
2.10
2.30
2.50
SH-TJB-X (mm) 193 441 677
Figure 5: Shaft eccentricity in the upper, lower, and turbine journal bearings of a LHG measured at several loads (from 0 to 763 MW) over a period of 10 hours.
component at 39.4 Hz, twice the blade passing frequency of the turbine rotor. There are also significant vibration amplitudes in the ranges of 170–250 Hz and 380–470 Hz, which are probably direct hydraulic excitations, not related to the LHG rotating part ([15, 17]). 4.1.2. Changes in Shaft Eccentricity. Each diagram of Figure 4 shows the average values of two shaft relative vibrations, measured 90∘ apart in the plane of the three journal bearings and plotted against each other. The marks on the diagrams are related to the shaft center position or the shaft eccentricity in the journal bearing. The radii of the red circles in dashed lines are equal to the nominal pad clearance in operation (𝑐). These measurements were taken during the balancing process of a LHG over three consecutive days, when the generator rotor was in the following conditions: (a) unbalanced with ISO quality grade G6.65; (b) with a calibration weight, unbalanced with ISO quality grade G4.25; and (c) balanced. In these operating conditions, there was no magnetic pull and any
casual hydraulic pull in the turbine was minimum. The shaft eccentricity changes randomly and significantly along a straight line on the planes of the three journal bearings. However, it should also be considered that shaft collars and thrust block may have significant radial expansions during transient processes, such as bearings warming. The diagrams of Figure 5 are similar to those shown in Figure 4, but there the LHG is operating in steady-state condition at several loads, from 0 to 763 MW, over a period of 10 hours. Now there is a magnetic pull in the generator and a hydraulic pull in the turbine, both of unknown magnitudes and directions, as will be shown in Section 4.3.5. The shaft eccentricity varies along a horizontal line in the upper journal bearing. For the other two journal bearings, the shaft eccentricity varies randomly around two distant attractors. Finally, the diagrams of Figure 6 show the long-term changes in shaft eccentricities, measured in the conditions described in Table 2. In summary, this section has shown that the journal bearings operating conditions vary randomly and
International Journal of Rotating Machinery
7 2.60
2.20
2.00
1.80 1.80
2.00
2.20
SH-TJB-Y (mm)
1.90
SH-LJB-Y (mm)
SH-UJB-Y (mm)
2.40
1.70
1.50
1.30 1.30
2.40
1.50
4/7 1/14
2.20
2.00 2.00
1.90
2.20 2.40 SH-TJB-X (mm)
SH-LJB-X (mm)
SH-UJB-X (mm) 4/3 1/6
1.70
2.40
4/14 1/21
4/22 1/22
2.60
4/29 1/28
2400 2200 2000 1800 1600
(𝜇m)
(𝜇m)
Figure 6: Shaft eccentricity in the upper, lower, and turbine journal bearings of a LHG measured at several loads (from 474 to 694 MW) during several months.
0
5
10
15 Time (s)
20
25
30
2200 2000 1800 1600 1400
0
5
UJB-X UJB-Y
10
15 Time (s)
20
25
30
LJB-X LJB-Y (b)
(𝜇m)
(a)
2600 2400 2200 2000 1800
0
5
10
15 Time (s)
20
25
30
TJB-X TJB-Y (c)
Figure 7: Shaft relative vibrations at the upper (UJB-𝑋/𝑌), lower (LJB-𝑋/𝑌), and turbine (TJB-𝑋/𝑌) journal bearings of a LHG operating with 247 MW.
significantly during operation due to the similar changes in the shaft eccentricities. As these variations change the LHG dynamics, shaft eccentricities must be measured and their effects shall be considered in the monitoring process.
bearings stiffness as well as in the LHG dynamics. A possible explanation to these changes it that the hydrogenerator was suddenly moved from an attractor to another by action of the large vortices forces in the turbine rotor.
4.1.3. Sudden Changes on Shaft Eccentricity. Figure 7 shows the shaft relative vibrations on 𝑋-direction and 𝑌-direction at the upper (resp., UJB-𝑋 and UJB-𝑌), lower (LJB-𝑋/LJB-𝑌), and turbine (TJB-𝑋/TJB-𝑌) journal bearings, when a LHG was operating with 247 MW. In this condition, shaft vibrations occur mainly at a quarter of the rotating speed, due to the well-known partial load vortices in the turbine ([17, 18]). As indicated by the red-dashed rectangles, in the shaft vibrations at 𝑋-direction of the lower journal bearing (LJB-𝑋) and in both shaft vibrations at turbine journal bearing (TJB 𝑋/𝑌), the shaft eccentricity changes abruptly at 𝑡 ≈ 12 seconds. These changes were represented also in Figure 5 (see ◼ 247− and + 247+ ) and they may cause sudden changes in
4.1.4. Changes in Shaft and Bearing Vibrations with the Generator Load. Figures 8 and 9 show, respectively, shaft relative vibrations and bearing absolute vibrations measured in the upper journal bearing of a LHG, at seven different generator loads, over a period of ten hours. Both diagrams show the vibration displacements, in this specific case, once the journal bearing acceleration signals were integrated twice. On both diagrams, each signal has a vertical scale of 100 micrometers per division. At speed-no-load condition (0 MW), shaft vibration has stochastic characteristics, while bearing vibration has its lowest value. For 100 and 255 MW, both shaft and bearing vibrations increase under the influence of the familiar partial load vortices, giving origin to
International Journal of Rotating Machinery
100 𝜇m/div
8
0
2
4
6
8
0 MW-Y 100 MW-Y 255 MW-X 500 MW-Y
10 12 Time (s)
14
16
18
20
610 MW-Y 700 MW-X 755 MW-Y
Figure 8: Shaft relative vibrations at several generator loads (0 to 755 MW, from bottom to top).
bearing of a LHG operating at 530 MW, in time (a) and frequency (b) domains. Shaft vibration reached high amplitudes (400 𝜇mpp), with beating between two possible natural frequencies, 4.86 and 5.25 Hz. Further examinations indicated that the shaft vibrations were in phase, at the upper and lower generator bearings, while both these vibrations were in phase opposition related to the shaft vibration in the turbine journal bearing. The natural frequencies disappeared for about ten seconds and then another excitation occurred, as shown in Figure 11. In this case, the generator load was 540 MW, the shaft vibration amplitude reached 550 𝜇mpp, and the natural frequencies were 5.50 and 5.76 Hz. This sudden increase in the natural frequencies implies a substantial and abrupt change in the bearings stiffness, what can be explained by sudden changes in the shaft eccentricity, like the one shown in Figure 7.
100 𝜇m/div
4.2. Remarks Based on Temperature Analysis. Thermal effects change journal bearing dynamics coefficients ([19, 20]), modifying the dynamic behavior of the rotating machine. This section describes some phenomena observed in LHG journal bearings.
0
2
4
0 MW-Y 100 MW-Y 255 MW-X 500 MW-Y
6
8
10 12 Time (s)
14
16
18
20
610 MW-Y 700 MW-X 755 MW-Y
Figure 9: Bearing absolute vibrations at several generator loads (0 to 755 MW, from bottom to top).
high amplitude vibrations at approximately a quarter of the rotating speed ([17, 18]). At the beginning of the operating range (500 MW), shaft and bearing vibrations occur mainly at rotating speed (92.3 r/min); nevertheless, sometimes, natural frequencies are excited in the range of 4.5 to 5.5 Hz. From 610 to 755 MW (full wicket gates opening), vibrations occur predominantly at rotating speed; shaft vibrations displacements are lower than 100 micrometers peak-to-peak (𝜇mpp), while bearing vibrations are lower than one-third of this value. By this way, it can be concluded that the operating load changes the LHG vibration fingerprint significantly and it must be considered in the vibration monitoring activities. 4.1.5. Sudden Changes on Natural Frequencies. Figure 10 shows the shaft relative vibration at the turbine journal
4.2.1. Influence of the Cooling Water Temperature. Figure 12 shows the generator load, the cooling water temperature, the lubricant temperature, and the temperatures of two pads 90∘ apart from each other of the lower journal bearing of a LHG. These parameters were measured during 5000 operating hours, with a sampling interval of 30 minutes. Measurements during three short time stoppages were disregarded. Over this period of almost 7 months, the generator load fluctuated from 358 to 727 MW, as demanded by the electrical system. The temperature of cooling water, taken from the turbine spiral case, varied in the range of 20 to 30∘ C, mainly due to the natural seasonal variation of the river water temperature. The bearing losses of nearly 900 kW are removed by eight water-oil heat exchangers, equally distributed in the lubricant chamber. As the cooling water flow is kept constant, lubricant viscosity and pad clearances may have had significant changes in this period. The lubricant temperature varied from 46 to 50∘ C, due to the influence of cooling water temperature (the correlation factor between these two magnitudes is +0.98) and also under the guidance of the generator load. The temperatures of the two pads showed a distinct behavior. While the temperature of pad 5 followed the cooling water temperature, with a correlation factor of +0.83, the temperature of pad 1 had an opposite behavior, with a correlation factor of −0.88. Figure 12 also shows that the generator load influences both pads temperatures. This behavior may be explained by changes in the axial hydraulic pull and in the shaft eccentricity, in addition to bearing dimensional seasonal changes caused by cooling water temperature [3]. This remark indicates that the oil film temperature may vary significantly from one pad to another, in an almost unpredictable way. However, in vibration monitoring, these temperatures may be estimated using other bearing measured temperatures, like the lubricant and the pads temperatures.
International Journal of Rotating Machinery
9
400
400
0
200
−400
0
2
4
6
8
10
0
0
8
16
(s)
24
32
40
(Hz)
(a)
(b)
Figure 10: Shaft vibration at the TJB of a LHG with 530 MW, in time (a) and frequency (b) domains (spectrum main peaks are 100 𝜇
[email protected] Hz, 130 𝜇
[email protected] Hz, and 105 𝜇
[email protected] Hz). 400
400
0
200
−400
0
2
4
6
8
10
(s) (a)
0
0
8
16
24
32
40
(Hz) (b)
Figure 11: Shaft vibration at the TJB of a LHG with 540 MW, in time (a) and frequency (b) domains (spectrum main peaks are 90 𝜇
[email protected] Hz, 205 𝜇
[email protected] Hz, and 155 𝜇
[email protected] Hz).
4.2.2. Dimensional Changes in the Bearing Housing. Figure 13 shows the pads temperatures of the upper journal bearing when the generator was operating with 0 MW, just after start and one hour and 40 minutes later as well as after ten hours, practically in steady-state condition, with 763 MW. The distribution of the pads temperatures indicates that pads clearances have an elliptical distribution when the generator is loaded. This elliptical form is attributed mainly to the electromagnetic field induced by the generator outputs, which makes the bracket arms nearby warmer than those that are distant, causing differential thermal expansions in the bearing structure. This symptom also can be seen in the dynamic measurement of the oil film thicknesses and pads clearances, shown in Section 4.3.3. 4.3. Remarks Based on the Bearings Special Commissioning Tests. In the middle of the 1980s, the manufacturer carried out special commissioning tests in the bearings of one of the first LHG that got into operation. The tests were performed during several months and hundreds of measurements were taken; measured data were recorded in magnetic tapes or in the mass memory of a special computer. Unfortunately, only five of these measurements are still available in a printed report [21] and their main results are described in the following. These tests used proximity and pressure transducers, installed in the upper shaft collar and in thrust block, to measure oil film thickness and pressure. Special slip rings were used to collect the signals from the LHG rotating part. These tests also used additional temperature transducers to
measure the pads and the lubricant temperatures, in a more detailed way. The tests report [21] does not mention the accuracy class of these transducers; however, due to the complexity and the high costs involved in these tests, these transducers must be of good quality, at least ±5% for the proximity and pressure transducers as well as ±1∘ C for the temperature transducers. 4.3.1. Temperature Distribution on Bearing Pads. Two opposed pads of each generator journal bearing received additional transducers to measure the temperatures at the oil film leading edge (L. Edge) and trailing edge (T. Edge) besides the pad temperature at the pivot region. Table 3 shows these temperatures in the pads of the upper journal bearing, in several operating conditions [21]. As expected, the temperatures of the pad surface and the oil film are higher at the trailing edge, as this region has the lower film thickness, higher shear rates, and viscous dissipation [20]. These temperatures vary significantly from an operating condition to another, as well as from a pad to another. Based on this table, the maximum increase in the oil film temperature may be estimated in about 7∘ C, indicating the possibility of using an adequate average viscosity for each pad, in the case of vibration monitoring applications. 4.3.2. Distribution of the Oil Film Thickness in a Pad. Figure 14 shows the oil film thickness measured over a pad of the upper journal bearing, with the LHG in two different operating conditions, at speed-no-load condition on the left and at nominal load on the right side [21]. In both conditions, the oil
10
International Journal of Rotating Machinery 35 Cooling water (∘ C)
Load (MW)
800
600
400
200 6000
7000
8000 9000 Time (h)
10000
30
25
20 6000
11000
7000
(a)
8000 9000 Time (h)
10000
11000
(b)
62
55
Pads (∘ C)
Lubricant (∘ C)
60
50
58 56 54
45 6000
7000
8000 9000 Time (h)
10000
11000
52 6000
7000
8000 9000 Time (h)
10000
11000
Pad 1 Pad 5 (c)
(d)
Figure 12: Generator load (a), cooling water temperature (b), lubricant temperature (c), and temperatures of two pads 90∘ apart from each other (d) of a LHG lower journal bearing.
the nominal value of the clearance in operation (𝑐 = 200 𝜇m; see Table 1). They also show that oil film thickness changes from a condition to another, probably due to pad thermal deformation.
50
(∘ C)
45
40
35
30
1
2
3
4
5
6
7 8 9 10 11 12 13 14 15 16 Pads number
0 MW (just after start) 0 MW (1 h 40 later) 763 MW
Figure 13: Temperatures of upper journal bearing pads at 0 MW and at 763 MW.
film thickness was measured dynamically. Thus, it contains errors due to the shaft and pad vibrations. Measurements show that the pad clearances, 280 𝜇m at speed-no-load condition and 300 𝜇m at nominal load, are much larger than
4.3.3. Changes of Oil Film Thickness due to Bearing Housing Deformation. The pads temperatures shown in Figure 13 indicated that the pad clearances have an elliptical distribution. To confirm this hypothesis, a structural simulation of the complete upper journal bearing bracket was made using commercial software based on the Finite Volume Method (FVM) for solving differential equations in threedimensional geometries. The geometry of the upper journal bearing bracket was modeled in a simplified way for better solver processing. To attain more accurate results, the mesh generator was set to obtain curved and regular elements, maximum face size of which was fixed to 0.15 m. The generated mesh had 1787 k nodes and 1062 k elements, with a mesh quality between good and very good. The temperatures measured at tens of points of the bearing brackets, at steady-state condition, were extrapolated to create a cloud of points over all the sixteen bracket arms. Communication between this cloud and the defined boundary conditions was given by a software component that manages this type of imported data and the relative angle between the cloud
International Journal of Rotating Machinery
11
Table 3: Temperatures in the pads of upper journal bearing of a LHG. Pad number 4
Operating condition [r/min] 78.5 92.3 92.3 92.3 92.3
L. Edge [∘ C] 35.3 43.3 44.8 47.0 55.2
[MW] 0 0 600 700 700∗
Pad number 12 T. Edge [∘ C] 37.8 48.4 48.1 49.7 58.6
L. Edge [∘ C] 35.9 45.2 47.1 49.2 57.3
T. Edge [∘ C] 39.5 51.5 53.7 56.0 64.6
600
600
500
500 Oil film thickness (𝜇m)
Oil film thickness (𝜇m)
∗ In the last measurement with 700 MW, a reduction of 10% in the bearing cooling capacity was created artificially by adequately reducing the water flow in the heat exchangers.
400 300 200
300 200 100
100 0
400
0
100
200 Pad lenght (mm)
300
(a)
0
0
50
100
150 200 Pad lenght (mm)
250
300
350
(b)
Figure 14: Measured distributions of the oil film thickness on pad number 4 of the UJB of a LHG: (a) at speed-no-load condition; (b) at nominal load condition (700 MW).
points and the coordinate system used in the geometry before the solution. These data were set as input for boundary conditions for the simulation of thermal expansion, which, combined with crimped supports at the ends and at the bases of the arms, induce specific stresses and strains along the structure, which were evaluated in the observation of the solution. The shaft was considered isothermal [22] and its temperature was estimated with basis on the lubricant and bearing pads temperatures. The results of this simulation are shown in Figure 15, where the elliptical distribution of the pads clearances is clear. Figure 16 shows four pad clearances distributions in the upper journal bearing. The blue circle shows the nominal pad clearances in operation, referred to as clearance condition A. The green closed curve designates the clearances measured when the generator load was 0 MW, in the bearing special commissioning tests [21], mentioned as clearance condition B. The orange curve with crossed marks shows the clearances obtained with the described FVM simulation, denoted as clearance condition C. Finally, the red outer curve defines the clearances measured at nominal load condition [21], referred to as condition D. Figure 16 shows a similarity between the simulated (condition C) and measured (condition D) clearance distributions. This figure indicates that bearing
clearances are much larger than the nominal values, what will cause significant reductions in the bearing stiffness [23]. Additionally, it confirms the diagnostic of the symptom described in Section 4.2.2: that clearance distribution becomes elliptical when the generator is loaded. 4.3.4. Changes of Clearances due to Axial Hydraulic Load and Thrust Block Expansion. The thrust bearing bracket (component number (10) in Figure 1) bears both the weight of the LHG rotating part and the turbine hydraulic load, which depends on the generator power, water head, and clearances of the turbine labyrinth seals. The weight of the rotating part is already applied on the thrust bearing bracket during the adjustment of the lower journal bearing clearances. However, the additional axial hydraulic load may create significant reductions in the bearing clearances. Using analytical methods, the Finite Element Method (FEM), and the results of tests in a 1 : 10 scale model, the manufacturer determined that this effect may cause a significant reduction in lower journal bearing clearance [24]. Besides this effect, the thrust block temperature is higher than the temperature of the ring support of the lower journal bearing pads. This originates a thermal radial differential expansion that reduces the bearing radial clearance. This
12
International Journal of Rotating Machinery
K: Static structural total deformation Type: total deformation Unit: mm Time: 1 19/05/2016 17:03
300 𝜇m
4.7284 max 4.3907 4.0529 3.7152 3.3774 3.0397 2.702 2.3642 2.0265 1.6887 1.351 1.0132 0.67549 0.33774 0 min
424 𝜇m
424 𝜇m
X
300 𝜇m
Y
Figure 15: Elliptical deformation of the upper journal bearing bracket due to eddy currents created by the electromagnetic field of the generator outputs.
Y 90
800
120
60 600 400
150
30
200 X 180
0
330
210
240
300 270
Figure 16: UJB pads clearances (𝜇m): (a) nominal (condition A, blue); (b) measured at 0 MW (condition B, green); (c) simulated at 700 MW (condition C, crossed orange); and (d) measured at 700 MW (condition D, red).
clearance reduction is not constant and depends on the generator power, on the cooling water temperature, and on the efficiency of the bearing heat exchangers. The combination of both effects was verified in the bearings special commissioning tests [21]. At speed-no-load condition, the thrust block radial expansion measured by three different transducers was about 90 𝜇m, while at the generator nominal load it was 270 𝜇m. This indicates a reduction of approximately 180 𝜇m in the radial clearance of the lower journal bearing [21], with corresponding significant increasing in the bearing stiffness.
Such effect will be partially balanced by the decreasing of the lubricant viscosity, with the increasing of its temperature. 4.3.5. Changes in the Bearing Radial Static Load. Journal bearings of LHG are subject to radial static loads, like the magnetic static load originated by misalignment between generator stator and rotor, as well as the hydraulic static load created by uneven distribution of the water flow in the wicket gates. The misalignment between the three journal bearings may also contribute to this load. Table 4 shows the radial loads
International Journal of Rotating Machinery
13
Table 4: Static loads in a LHG journal bearings. Operating condition [r/min]
Upper journal bearing
Lower journal bearing
[MW]
Static load [kN]
Directed to pad
Static load [kN]
Directed to pad
78.5
0
31
13
21
7
92.3 92.3 92.3
0 600 700
61 248 274
8 15 10
91 295 294
14 7 15
92.3
700
316
16
355
9
in the upper and lower journal bearings of a LHG, measured during the bearing special commissioning tests [21]. There are random and significant changes in both amplitude (from 20 to 360 kN) and direction (over 180∘ or eight pads) of the radial loads, what may change bearing stiffness and LHG dynamics in a significant way.
5. Concluding Remarks Established on experimental evidences collected in a set of twenty large hydrogenerators, functioning in healthy conditions, this paper has shown that the operating and boundary conditions of the journal bearings of these machines may present frequent, significant, and unpredictable variations. Several of these variations are originated by external agents, like the generator electromagnetic field, the bearings cooling water temperature, and the turbine axial hydraulic pull. Variations in the operating and boundary conditions naturally make the accurate determination of bearing stiffness and bearing damping coefficients unfeasible, even using refined bearing models. This paper has also shown that as these bearing coefficients vary with time, the vibratory behavior of a healthy large hydrogenerator also may have frequent, significant, and unpredictable variations, making damage detection and damage diagnostics difficult. Finally, this paper has shown that the real clearances of these journal bearings may be much larger than the nominal values, making the real bearing stiffness coefficients much lower than calculated in the design of these machines. As consequence, the critical speeds and the natural frequencies at the nominal operating speed are lower than theoretically predicted, while the real vibration levels may be higher than calculated. The phenomena described in this paper were identified in the journal bearings of several of the observed large hydrogenerators. The vertical assembly of these machines, the large diameters of their journal bearings, and their oversized brackets certainly emphasized these phenomena. Probably, these and other similar phenomena are typical of this type of machine. They possibly are also present in medium-sized hydrogenerators and in other turbomachinery with lesser intensity. Therefore, it is important to stimulate the electrical utilities to identify and classify systematically these phenomena, with a proper characterization of journal bearing operating and boundary conditions, using suitable
and calibrated transducers installed properly. It is also important to stimulate discussions about this subject, involving researchers and users of these rotating machines. This will help in the detailed understanding of the dynamic behavior of these journal bearings and in their influencing mechanisms in the hydrogenerators dynamics. This will also help to explain the differences between the predicted and the real dynamic behaviors of these rotating machines, many times attributed only to the refinement level of the models used to determine the journal bearing dynamic coefficients and the machine dynamic response. Otherwise, the vibration monitoring systems based on conventional alarm rules will continue issuing many cases of false alarms (false positive and false negative), diminishing the confidence of users in their effectiveness.
Nomenclature FEM: FVM: ISO: LHG: LJB: RMS: TJB: UJB: 𝑋: 𝑌: 1x: 2x:
Finite Element Method Finite Volume Method International Standard Organization Large hydrogenerator Lower journal bearing Root mean square Turbine journal bearing Upper journal bearing Longitudinal coordinate [m] Transversal coordinate [m] Once the rotating frequency Twice the rotating frequency.
Competing Interests The authors declare that there is no conflict of interests regarding the publication of this paper.
Acknowledgments The authors are grateful to Itaipu Binacional, to the Itaipu Technological Park, and to the Center for Advanced Studies on Safety of Dams for the encouragement in this research. Roberto Dalledone Machado gratefully acknowledges the financial support provided by the Brazilian government agency CNPq (Conselho Nacional de Desenvolvimento Cient´ıfico e Tecnol´ogico), under the research grants 312241/2015-1.
14
References [1] R. B. Randall, Vibration-Based Condition Monitoring: Industrial, Aerospace and Automotive Applications, John Wiley & Sons, New York, NY, USA, 2011. [2] C. R. Farrar and K. Worden, “An introduction to structural health monitoring,” Philosophical Transactions of the Royal Society A: Mathematical, Physical and Engineering Sciences, vol. 365, no. 1851, 2007. [3] G. C. Brito Jr., “Application of simplified statistical models in hydro generating units health monitoring,” in Damage Prognosis: for Aerospace, Civil and Mechanical Systems, pp. 451– 470, John Wiley & Sons, Hoboken, NJ, USA, 2005. [4] A. Z. Szeri, Fluid Film Lubrication: Theory and Design, Cambridge University Press, Cambridge, UK, 1998. [5] M. N¨asselqvist, R. Gustavsson, and J.-O. Aidanp¨aa¨, “Experimental and numerical simulation of unbalance response in vertical test rig with tilting-pad bearings,” International Journal of Rotating Machinery, vol. 2014, Article ID 309767, 10 pages, 2014. [6] A. Sperber and H. I. Weber, “Dynamic models in hydroelectric machinery,” Journal of the Brazilian Society of Mechanical Sciences, vol. 13, pp. 29–59, 1991. [7] Itaipu, Itaipu Hydroelectric Project: Engineering Characteristics, Tab Marketing Editorial, Porto Alegre, Brazil, 2009. [8] R. Cardinali, R. Nordmann, and A. Sperber, “Dynamic simulation of non-linear models of hydroelectric machinery,” Mechanical Systems and Signal Processing, vol. 7, no. 1, pp. 29–44, 1993. [9] R. K. Gustavsson, M. L. Lundstr¨om, and J.-O. Aidanp¨aa¨, “Determination of journal bearing stiffness and damping at hydropower generators using strain gauges,” in Proceedings of the ASME Power Conference, pp. 933–940, Chicago, Ill, USA, April 2005. [10] M. N¨asselqvist, R. K. Gustavsson, and J.-O. Aidanp¨aa¨, “Resonance problems in vertical hydropower unit after turbine upgrade,” in Proceedings of the 24th Symposium on Hydraulic Machinery and Systems, Foz do Iguac¸u, Brazil, October 2008. [11] R. Tiwari, A. W. Lees, and M. I. Friswell, “Identification of dynamic bearing parameters: a review,” Shock and Vibration Digest, vol. 36, no. 2, pp. 99–124, 2004. [12] C. Fulei, S. Xiaohui, and L. Wenxiu, “Lateral vibration of hydroelectric generating set with different supporting condition of thrust pad,” Shock and Vibration, vol. 18, no. 1-2, pp. 317–331, 2011. [13] Y. Xu, Z. Li, and X. Lai, “Dynamic model for hydro-turbine generator units based on a database method for guide bearings,” Shock and Vibration, vol. 20, no. 3, pp. 411–421, 2013. [14] M. N¨asselqvist, R. Gustavsson, and J.-O. Aidanp¨aa¨, “A methodology for protective vibration monitoring of hydropower units based on the mechanical properties,” Journal of Dynamic Systems, Measurement and Control, Transactions of the ASME, vol. 135, no. 4, Article ID 041007, 2013. [15] International Standard Organization, ISO 10816-Mechanical Vibration-Evaluation of Machine Vibration by Measurements on Non-Rotating Parts, International Standard Organization, Geneva, Switzerland, 2000. [16] G. C. Brito Jr., “Dynamic behaviour of rotating electrical machines’ stators,” in Proceedings of the 9th International Conference on Vibrations in Rotating Machinery, pp. 411–422, Exeter, UK, September 2008.
International Journal of Rotating Machinery [17] L. A. Vladislavlev, Vibration of Hydro Units in Hydroelectric Power Plants, Amerind Publishing, New Delhi, India, 1979. [18] W. Youlin, L. Shengcai, L. Shuhong, D. Hua-Shu, and Q. Zhongdong, Vibration of Hydraulic Machinery, Mechanisms and Machine Science, Springer, Dordrecht, Netherlands, 2013. [19] T. Dimond, A. Younan, and P. Allaire, “A review of tilting pad bearing theory,” International Journal of Rotating Machinery, vol. 2011, Article ID 908469, 23 pages, 2011. [20] G. B. Daniel and K. L. Cavalca, “Evaluation of the thermal effects in tilting pad bearing,” International Journal of Rotating Machinery, vol. 2013, Article ID 725268, 17 pages, 2013. [21] Itaipu, Special measurements in unity 14 bearings, 1987. [22] D. Downson, J. D. Hudson, and C. N. March, “An experimental investigation of the thermal equilibrium of steadily loaded journal bearings,” Proceedings of the Institution of Mechanical Engineers, Conference Proceedings, vol. 181, no. 2, 1966. [23] T. Someya, Journal-Bearing Databook, Springer, Berlin, Germany, 1989. [24] Itaipu, Mancais das Unidades Geradoras (Bearings of the Generating Units), Itaipu, Foz do Iguac¸u, Brazil, 2002.
International Journal of
Rotating Machinery
Engineering Journal of
Hindawi Publishing Corporation http://www.hindawi.com
Volume 2014
The Scientific World Journal Hindawi Publishing Corporation http://www.hindawi.com
Volume 2014
International Journal of
Distributed Sensor Networks
Journal of
Sensors Hindawi Publishing Corporation http://www.hindawi.com
Volume 2014
Hindawi Publishing Corporation http://www.hindawi.com
Volume 2014
Hindawi Publishing Corporation http://www.hindawi.com
Volume 2014
Journal of
Control Science and Engineering
Advances in
Civil Engineering Hindawi Publishing Corporation http://www.hindawi.com
Hindawi Publishing Corporation http://www.hindawi.com
Volume 2014
Volume 2014
Submit your manuscripts at https://www.hindawi.com Journal of
Journal of
Electrical and Computer Engineering
Robotics Hindawi Publishing Corporation http://www.hindawi.com
Hindawi Publishing Corporation http://www.hindawi.com
Volume 2014
Volume 2014
VLSI Design Advances in OptoElectronics
International Journal of
Navigation and Observation Hindawi Publishing Corporation http://www.hindawi.com
Volume 2014
Hindawi Publishing Corporation http://www.hindawi.com
Hindawi Publishing Corporation http://www.hindawi.com
Chemical Engineering Hindawi Publishing Corporation http://www.hindawi.com
Volume 2014
Volume 2014
Active and Passive Electronic Components
Antennas and Propagation Hindawi Publishing Corporation http://www.hindawi.com
Aerospace Engineering
Hindawi Publishing Corporation http://www.hindawi.com
Volume 2014
Hindawi Publishing Corporation http://www.hindawi.com
Volume 2014
Volume 2014
International Journal of
International Journal of
International Journal of
Modelling & Simulation in Engineering
Volume 2014
Hindawi Publishing Corporation http://www.hindawi.com
Volume 2014
Shock and Vibration Hindawi Publishing Corporation http://www.hindawi.com
Volume 2014
Advances in
Acoustics and Vibration Hindawi Publishing Corporation http://www.hindawi.com
Volume 2014