Experimental Design for Comparing Static Concurrency Analysis Techniques A.T. Chamillard Computer Science Department HQ USAFA/DFCS USAFA, CO 80840 USA +1 719 333 3131
[email protected]
Lori A. Clarke Computer Science Department University of Massachusetts Amherst, MA 01003 USA +1 413 545 1328
[email protected]
formally, experimentation can help develop estimates of average case performance for each of the techniques. In addition to performance, experimentation can provide information about the types of properties and programs each tool can verify, the accuracy of the analysis results, and the frequency of failure. Corbett [4, 5] carried out empirical studies comparing the performance of several tools in detecting deadlock in Ada tasking programs. Our goal was to extend Corbett's work by adding data flow analysis to the repertoire of techniques, by examining program-specific properties in addition to deadlock, by considering analysis accuracy and other measures of performance, and by carrying out careful statistical analysis of the results to check for various biases and to quantify the predictive power of our results. Thus, we undertook an experimental evaluation of several of the major analysis techniques as applied to many of the concurrency analysis programs that have appeared in the literature [2]. Others have lamented the limited number of empirical studies in software engineering [11]. Such studies can be extremely difficult to carry out, especially if human subjects are involved and the measures are subjective (e.g., code understanding and effectiveness of design methodologies). From this point of view, a comparison of static concurrency analysis techniques seems like a straightforward empirical study -- there are no human subjects in the experiment, and there is little subjectivity involved in the analysis of the results. Perhaps surprisingly, it was difficult to design an experiment that provides a fair and meaningful comparison of static concurrency analysis techniques. Essentially, we found that designing such an experiment requires a series of choices and tradeoffs between rational alternatives. This paper discusses these choices and tradeoffs, which we believe have significant implications for empirical research in software engineering. This paper does not present the actual experimental results, which are described in detail elsewhere [2]. In an ideal experiment, we would like to compare the performance of a number of static analysis techniques on a representative sample of concurrent programs, checking a
ABSTRACT Software engineering has suffered from a shortage of empirical studies. We recently undertook a study in an area that seems well suited to empirical investigation, comparing the performance of several static analysis tools for evaluating properties of concurrent software. During the course of that study, we encountered a number of significant issues that make designing a sound and unbiased study surprisingly difficult. It is these issues, and the tradeoffs they necessitate, that are the focus of this paper. Keywords Static analysis, comparison.
concurrency
analysis,
George S. Avrunin Math Department University of Massachusetts Amherst, MA 01003 USA +1 413 545 4251
[email protected]
empirical
INTRODUCTION Concurrent systems are inherently more complex and difficult to understand than sequential ones. Thus, it is imperative that cost-effective techniques be developed for checking that the behavior of these systems meets specified requirements. One class of techniques used for analyzing concurrent software is static analysis, where compile-time information is employed to prove properties about a system. A variety of static concurrency analysis techniques have been proposed, including reachability analysis, symbolic model checking, inequality necessary condition analysis, and data flow analysis. We are interested in understanding the relative strengths and weaknesses of these techniques in terms of their ability to prove properties. Although proving these properties is typically NP-hard and most of the static concurrency analysis techniques have exponential worst case analysis times, each has been shown to be applicable to some interesting problems. Thus, average case analysis times may help differentiate between the techniques in practice. While average case bounds are difficult to derive
1
representative sample of the kinds of properties the developers of such programs would be interested in checking. We would like to compare the performance of the techniques in a way that would include the full cost of using those techniques, including human resources. In the real world, no such ideal experiment is possible. First, we must actually compare analysis tools, rather than techniques, although the results of this comparison will be affected, perhaps very seriously, by the details of the implementations of those tools. Of course, software developers will actually use analysis tools, not techniques. Unfortunately, most of the tools available now are closer to research prototypes than to production releases. The results may therefore give little information about which techniques are most useful, especially if some of the implementations are particularly inefficient. Second, to get a representative sample of concurrent programs, we would like to randomly select the programs for the experiment from the population of all concurrent programs. This is not feasible for several reasons. We need to restrict the experiment to concurrent programs written in languages with well-defined concurrency constructs. Because Ada is one of the few commonly used languages supporting concurrency, we restricted our experiment to concurrent Ada programs. The population of concurrent Ada programs available for such an experiment is fairly limited, however. Aside from a number of toy programs used in the concurrency analysis literature to illustrate the features of analysis techniques, we have been able to obtain access to only a few "real" programs. We have no way to determine whether even these real programs are typical. Our access to specifications for these programs is even more limited, so we cannot expect that the properties we choose to check will match the properties the developers would have regarded as most important. Finally, the tools developed to implement each of the techniques use different input representations for the program to be analyzed and the property to be checked, so ensuring the tools are all checking the same program and the same property is difficult. Moreover, because of our inexperience using many of the tools, we may overlook special property formulation methods that would be obvious and natural for experts. For all these reasons, biases against one or more of the techniques can be introduced into the experiment in a variety of ways, and careful experiment design is required to minimize the sources of bias and to detect bias when it cannot be eliminated. In this paper, we discuss a number of difficult issues that must be taken into account when we design this kind of experiment. These issues include the choice of programs and properties for analysis, the problem of ensuring that each tool is applied to the same programs and properties, and decisions about how to measure and compare the performance of the tools. These
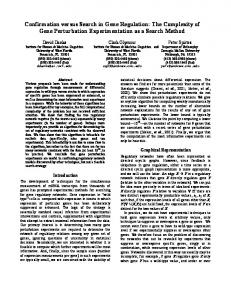
issues involve tradeoffs between conflicting goals, and decisions on one may effect others in subtle ways. We illustrate these issues by describing their impact on a small example. The following section provides an overview of the experiment. The third section describes the tradeoffs made in the design of the experiment, followed by our conclusions and a discussion of future work. OVERVIEW OF THE EXPERIMENT This section provides an overview of our experiment, including the programs included in the experiment, the tools used for analysis, the properties included in the experiment, and the measurements we used to evaluate performance. Programs in the Experiment We intend to undertake a two part study. For the first part, which has been completed [2], we focused on the wellunderstood, toy programs from the literature. During the second part, we intend to examine "real" programs, but have delayed this until after we have a better understanding of the experiment design issues. For the first part of our study, we selected 11 scalable programs from the concurrency analysis literature for our experiment. Some of the programs had already been coded in Ada by members of the Arcadia consortium to demonstrate testing and analysis tools, while for others we acquired the INCA inputs used by Corbett [5] and converted them to Ada programs. To illustrate our description of the tradeoffs involved in designing an experiment to compare the various concurrency analysis tools, we consider one of these programs, the readers/writers problem. The readers/writers problem includes a set of readers and a set of writers that may be simultaneously accessing the same document, with the restriction that when a writer is accessing the document no readers or other writers can be accessing the document at that time. Our solution for the readers/writers problem uses a task for each reader, a task for each writer, and a single task to control access to the document. An example program showing one reader and one writer can be found in Figure 1. To increase the size of the example program, we add additional readers and writers with the same structure as reader_1 and writer_1. Tools in the Experiment In our experiment, we considered the reachability analysis tools SPIN and SPIN plus Partial Orders (SPIN+ PO), the symbolic model checking tool SMV, the inequality necessary condition analysis tool INCA, and the data flow analysis tool FLAVERS. Although there are a number of other tools, these tools represent most of the main approaches to static analysis of concurrent software.
2
task body reader_1 is begin loop control.start_read; control.stop_read; end loop; end reader_1;
task body control is Readers : Natural range 1 .. 1 := 0; Writer : Boolean := false; begin loop select when (not Writer) => accept start_read; Readers := Readers + 1; or accept stop_read; Readers := Readers - 1; or when (not Writer) and (Readers = 0) => accept start_write; Writer := true; or accept stop_write; Writer := false; end select; end loop; end control;
task body writer_1 is begin loop control.start_write; control.stop_write; end loop; end writer_1;
Figure 1. Ada Program for 1 Reader/1 Writer SPIN The Simple Promela INterpreter (SPIN) [8] performs reachability analysis, in which the reachable states of the program being analyzed are enumerated and the property of interest is checked on the reachable state space. The program is described in the PROMELA language [8], a language that was developed for specification of communication protocols. SPIN automatically checks for deadlock. Other properties to be checked must be specified using never claims or assertions. never claim, the property is represented as an FSA that should never reach an accept state. Assertions are expressions that evaluate to true or false and are inserted at user-selected points in a PROMELA program. If at any time during the state space generation a potential deadlock state is found, the FSA for a never claim reaches an accept state, or an assertion evaluates to false, the tool reports the error and terminates.
support the use of rendezvous, we did not consider them for this experiment. SMV The Symbolic Model Verifier (SMV) [9] performs symbolic model checking [1], in which the program state space is represented symbolically rather than explicitly. Although SMV was originally designed as a hardware verification tool, it can also be used for analysis of concurrent software. The program is described in the form of a transition relation for the program states. The property of interest is specified in the temporal logic Computation Tree Logic (CTL). If the property is ever false, SMV reports the violation and terminates. INCA The INCA tool implements the Inequality Necessary Condition Analysis technique [3], in which necessary conditions for an execution of the system to violate a property are formulated as a set of inequalities. The program is specified in an Ada-like language or in the SExpression Design Language (SEDL). Properties are given as ω-star-less expressions, which specify sequences of event symbols. If there is no integer solution to the set of inequalities representing the program and the property to be checked, the necessary conditions for an execution to violate the property cannot be met and the property must hold for all executions.
SPIN + Partial Orders In the worst case, the size of the reachable state space can grow exponentially in the number of tasks in the program. The partial orders approach of Godefroid and Wolper attempts to reduce the size of the reachable state space through the use of sleep sets [7]. This method has been implemented as an addition to SPIN, and thus we refer to the resulting tool as SPIN+PO. Like SPIN, the SPIN+PO tool takes input in the form of PROMELA and checks for deadlock automatically. The current version of SPIN+PO does not support the use of never claims for the specification of the property of interest, so non-deadlock properties are specified as assertions embedded in the PROMELA input. SPIN+PO checks those assertions, just as SPIN does during state space generation, and reports a violation and terminates if an assertion evaluates to false. We note that other partial order additions [10] to SPIN have been implemented, but since they do not currently
FLAVERS The FLow Analysis VERifier for Software (FLAVERS) tool [6] performs data flow analysis to check properties of concurrent programs. The tool accepts a set of Control Flow Graphs (CFGs), annotated with the events of interest, as the specification of the program to be analyzed. The property of interest is specified as a Quantified Regular Expression (QRE), which gives a regular expression for a set of event symbols and specifies whether the expression
3
should hold on all (or no) paths. Checking for deadlock using FLAVERS is not currently supported. Many other properties, however, can be specified as QREs. If the data flow analysis detects a path through the program on which the property is violated, the tool reports the property error.
example, the Writer variable in the control task of the readers/writers program ensures that only a single writer can be writing at a time. The Readers variable ensures that there is never a situation in which the reader is reading at the same time the writer is writing. By modeling the values of one or both of these variables, we can generate representations that more accurately describe the control task behavior than one in which neither variable is modeled.
Properties in the Experiment In our experiment, we checked for potential deadlock in all the programs in the experiment. We also selected one or two additional program-specific properties to check key aspects of the functional behavior of each program. Many of these additional properties check some form of mutual exclusion, although other kinds of properties were checked as well. We selected three properties to check for the readers/writers program. The first of these is deadlock, which occurs when the program reaches a non-terminal state in which none of the tasks can continue executing. The second property checks whether a reader can read an empty document. The third property checks whether two writers can ever be writing at the same time. Another property one would expect to check for this program is whether a reader and a writer can be accessing the document at the same time. We do not describe this property further because it is quite similar to the third property above.
Measurements in the Experiment We are interested in using the results of our experiment to characterize the performance of each tool. One way to characterize this performance is in terms of the consumption of resources, especially analysis time. Another useful measurement is the failure rate for each tool. The analysis can fail because the tool takes longer than a specified period of time to complete the analysis, exhausts available memory, terminates with some internal error, or a program generated by the tool cannot be compiled (for SPIN and SPIN+PO). The time chosen is somewhat arbitrary, though clearly some time limit is necessary. Similarly, the memory available is limited by the configuration of the machine used for the experiment, rather than by some canonical memory limit. The performance of the tools is also affected by the accuracy of their analysis results. Given the relative simplicity of the programs included in our experiment, we can determine the correct answer for each of the analyses and can, therefore, recognize spurious results reported by an analysis tool. Although this is an important characteristic of performance, it can be very difficult to measure for larger, more complex programs than those used in our experiment.
Improving Analysis Accuracy In general, we would like any static analysis technique to be conservative; for a given property, the analysis must not overlook cases where the property fails to hold. To ensure conservativeness, or in some cases to improve tractability, techniques often overestimate the behavior of the program being analyzed. This overestimate can lead to inaccuracy in the analysis results. If a tool reports that a property does not hold, when in fact the cases where it does not hold do not correspond to actual program behaviors, then this is called a spurious result.. For example, if the program representation contains paths that can never be executed in the program (commonly called infeasible paths), the tool may report that the property fails to hold when it only fails on infeasible paths. Users exert some control over analysis accuracy by deciding which program variables are modeled. A representation of the program that allows all variables in the program to have all possible values at each point that they are used is certainly conservative, but is likely to include a large number of infeasible paths. If information about the values of the variables at certain points in program executions can be determined statically and incorporated into the analysis, the accuracy of the analysis will be improved. When we include the actual values of a variable in a program representation, we say we have modeled that variable. As part of our experiment, we improved the accuracy of the analysis results by selectively modeling variables. For
EXPERIMENTAL DESIGN In this section, we discuss some of the issues and tradeoffs we faced during the design of our experiment. Ada Programs Used A comparison of tool performance for a specific program and property can be useful. Since the size of the programs included in the experiment can be increased by including more tasks into the system, it is also interesting to consider how the performance of the tools changes as the problem size is increased. Toward this end, we collected experimental data for a range of program sizes. There are a number of ways we could select the sizes of the programs. One way is to find a range of sizes that all the tools can analyze, which allows comparison between the analysis tools on the same input domain of programs, properties, and sizes. This was the approach taken by Corbett [5] and in our experiment. By choosing to consider only those sizes that can be analyzed by all the tools, however, we may restrict some of the tools to only a
4
small portion of their domains of applicability [4] and may introduce significant bias against those tools if they incur large overhead on small programs but can be used on very large programs. A second approach would therefore be to select different sizes of the programs for each tool based on the range of sizes that can be analyzed by that tool. This approach gives a clearer picture of each tool’s performance, especially in terms of failures, but also precludes direct comparison of the analysis times used by each tool. Yet a third approach would be to select the range of program sizes based on the most effective tool for that program and to measure the failures of the other tools. We note below that the decision about which range of sizes to include in the experiment has implications for a number of other issues. The performance of the analysis tools can be very sensitive to minor changes in the Ada program. For example, the control task in the readers/writers program has two unguarded select alternatives, at the stop_read and stop_write entries, but the structure of the reader and writer tasks ensures that no calls will be made to these entries unless a reader is currently reading or a writer is currently writing, respectively. INCA yields spurious results when checking for freedom from deadlock because of the unguarded select alternatives. Adding guards to these alternatives does not change the semantics of the program, but when we include these guards and model both the Writer and Readers variables we are able to eliminate the spurious results from INCA. It might be argued on stylistic grounds that adding the guards makes the control task more robust and easier to understand or, to the contrary, more complex and less clear. The concern is that such small differences in programming style can lead to significant variations in the performance of the analysis tools.
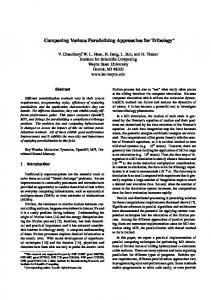
conversion was required for FLAVERS. For the remaining tools, we converted each CFG to SEDL using another conversion tool. The INCA tool uses the SEDL as the program representation, so no further conversion was required for INCA. The INCA tool was then used to generate a set of FSAs that were then converted to the program representations for SPIN, SPIN+PO, and SMV using a slightly modified version of Corbett’s conversion tool. The FSAs generated by INCA are not a form that an "expert" would use to formulate the program being analyzed, which implies that we may be introducing significant biases by using these FSAs. There is some question, however, about whether it is even possible to have each of the tools analyze exactly the same program. For example, PROMELA semantics are not exactly the same as Ada semantics. Specifying a PROMELA program to behave exactly as the corresponding Ada program would behave may not be possible. We applied extensive effort to try to ensure the tools are analyzing the same program, but because of differing tool semantics we may not have been completely successful. While we believe our approach to this problem is reasonable, there may be other approaches that are more successful at providing equivalent programs to each of the tools. The CFGs that are automatically generated from the Ada program are a general abstraction of program control flow and were not explicitly developed to support one or more of the analysis tools evaluated. Similarly, the FSAs that are created to represent the program are a general abstraction and were not tuned to one or more of the analysis tools. While we know that the CFGs and FSAs are valid representation of the program, using these representations could introduce bias in the experiment in some unknown manner. Our approach for creating a PROMELA program for SPIN and SPIN+PO closely follows that described by Corbett [5], with the difference that our technique uses an Ada program rather than a set of FSAs as the model of the program. In addition, we use a separate message channel for each entry in the program, while Corbett uses a separate message channel for each pair of communicating processes for each entry. Our approach is conceptually closer to the semantics of the underlying Ada program. Despite these differences, our PROMELA input is very similar to that of Corbett, and both approaches generate essentially the same state space.
Translating the Ada Programs To try to ensure the analysis tools were evaluating the same program, we started with Ada programs and converted those programs into the program representations for each tool. Because these conversions are difficult and potentially error-prone to perform manually, we used a largely automated conversion process. This process, depicted in Figure 2, took advantage of the tools we had on hand, and no attempt was made to optimize it. With this process, each Ada program was first converted to a set of CFGs using an automated conversion tool. The FLAVERS tool uses CFGs as input directly, so no further FLAVERS
INCA
SPIN FSAs to PROMELA
Ada Program
Ada to CFGs
CFGs
CFGs to SEDL
SEDL
SPIN+PO
FSAs FSAs to SMV
Figure 2. Translation Process
5
PROMELA SMV Input
SMV
Specifying each process as a distinct FSA is not standard PROMELA "programming style". This may introduce some bias, since SPIN could potentially take advantage of multiple instantiations of process types to provide more efficient state space generation. Our approach would preclude the use of such specialized techniques. Our approach, however, greatly facilitates the process of translating from an Ada program to a PROMELA program. Similarly, the standard SMV input specification using processes does not allow two processes to change state simultaneously to represent synchronous (rendezvous) communication. SMV supports an alternative input specification style in terms of the state transition relation for the system, and we have used this style. This input specification style may bias our results against SMV somewhat, since techniques that organize the OBDDs to efficiently represent the multiple, duplicate processes can not be used. In addition, by using the transition relation for the system, we are forcing SMV to consider the entire state space of that system, rather than letting it represent the state space symbolically as it was designed to do. Thus, although we made extensive efforts to accurately translate each program into equivalent representations for each tool, we cannot be sure that these representations are indeed precisely equivalent or that we have not inadvertently introduced bias against one or more of the tools.
the properties, for each of the tools. To illustrate the differences in property specifications, in Figure 3 we provide a SPIN never claim, SMV specification, INCA query, and FLAVERS QRE for checking that no reader reads an empty document. Note that checking this property involves recognizing the event that reader_1 has started reading and recognizing all events where some writer starts writing. We encountered several occasions on which we found it necessary to add additional flags to the PROMELA input to order to recognize when particular events have occurred. While it is sometimes possible to infer the event occurrences from the sequence of states passed through by the processes, thereby avoiding adding these flags, this can be difficult for non-trivial programs. We therefore found it effective to use flags to keep track of the occurrence of events of interest. For instance, when a writer writes, we set a wrote flag to true as the writer moves from one state to the next; we made use of this flag in the property specification shown in Figure 3. We also found it necessary to add additional flags when checking an assertion that involves the states of more than one process. Similarly, we found it intuitive to check event sequence properties with SMV by including flags that keep track of the occurrence of events of interest. It is also possible in SMV to avoid including these additional flags by specifying the property as an alternative CTL formula. Because adding the flags could increase the size of the state space, thereby adversely affecting the analysis times for SMV, we checked the event sequence properties using both specification techniques. We found that, in general, the alternative CTL specifications seemed more complicated (i.e., contained more terms a temporal logic operators) than those using additional flags, but this was not always the case. INCA queries are specified in terms of intervals, where events of interest are typically used to specify the start or end of the intervals. For some of the properties in the experiment, we found it intuitive to specify the INCA query using two intervals, which can cause a significant growth in the size of the inequality system. In these cases,
Representing Properties The next problem is to guarantee that the tools are evaluating the same properties. Automatic translation is even more difficult for property specifications than for program representations because the semantics of the specification techniques are so different. For example, FLAVERS QREs are in terms of events while SPIN never claims and SMV SPECs are in terms of process states, and SPIN assertions must be embedded as program statements. Without an automated property translation process, our only assurance that we are specifying equivalent properties is a careful, manual reasoning process applied to each of
SMV Specification AG ( reader_1_read -> any_writer_wrote )
SPIN Never Claim never { do :: (wrote == true) -> break -- if any writer writes, exit loop -- if reader_1 reads, go to accept state :: reader__1[reader_1_pid]@state_2 -> goto accept :: else -> skip -- if neither of above, loop back od; do :: skip -- infinite loop; property not possible od; accept: -- accept state of never claim do :: skip -- infinite loop; reader_1 reading before od; -- some writer writes }
INCA Query (defquery "no_r1w" "nofair" (omega-star-less (sequence (interval :initial t :ends-with '((rend "reader_1;control.start_read")) :forbid '((rend "writer_1;control.start_write")))))) FLAVERS QRE {reader_1_read, any_writer_wrote} none [-reader_1_read, any_writer_wrote]*; reader_1_read; [reader_1_read, any_writer_wrote]*
Figure 3. Example Property Specifications to Check that No Reader Reads an Empty Document
6
we also used an alternative property specification involving a single interval. With the small, academic programs in the experiment, we knew which properties should be violated for each program, property, and set of modeled variables. If we specified a property that we knew should not be violated and the analysis reported that the property was violated, we iteratively modified our property specification until we achieved the “correct” analysis result, or could no longer see reasonable ways to modify the property specification. In some cases, specifying the property was very difficult and reaching a correct property specification required many iterations. We used this iterative process to try to factor out our inexperience using the tools, since the original spurious results were caused by our incorrect property specifications rather than by weaknesses in the tools. We believe that the spurious results measured in the experiment, using the final versions of the property specifications, therefore more accurately represent the strengths and weaknesses of the tools rather than our skill (or lack of it) specifying the properties. It can be argued, of course, that our original property specifications should be used, since they may better reflect how a “ typical” user would specify the properties. Additionally, an analyst analyzing a real concurrent program probably does not know the “correct” analysis result, and so would not necessarily know when to iteratively modify the property specification. Ensuring that each tool checks the same property is difficult. The property specifications that we chose for each tool imply the high-level property that we wanted to check but there are many other ways of specifying these properties, even for a single tool. The particular property specifications that we used could therefore introduce bias against one or more of the tools. Moreover, we have no evidence that the set of properties we selected are representative of the kinds of properties system developers would be most interested in checking. For instance, our choice of properties could reflect our past analysis experience, which was largely with event-based methods. We believe our experience with this experiment, however, indicates real differences between the applicability of statebased and event-based methods.
intractable. One approach would be to add accuracy to the program representations incrementally. With this approach, we would start without modeling variables, and would incrementally model additional variables until the analysis results meets accuracy requirements. Another approach [4, 5] would model all variables initially, or at least all variables that directly impact the events in the property. If we discovered that this variable modeling led to intractable analyses, we would incrementally remove variable modeling until the analysis was tractable. For real programs, we believe an analyst would probably select a set of variables that seemed most relevant, rather than starting at either extreme. Checking for Bias We want to ensure that our experimental design avoids bias against one or more of the tools as much as possible. There are a number of potential sources of bias introduced by the choices we make about which programs to analyze, how to translate the programs, and how to formulate the properties in the experiment. We can check statistically whether some of these potential biases affect our experimental results. For example, the sizes of the Ordered Binary Decision Diagrams (OBDDs) used by SMV are sensitive to the order of the variables in the SMV input. To account for this, we checked the tool's performance using the variable ordering that results from our automatic translation and also ran the tool with the REORDER option, which applies a heuristic reordering algorithm before generating the OBDDs for the system. Also, SMV tends to be more efficient when processes are used rather than an explicit specification of the global transition relation, since using the transition relation forces SMV to consider the entire state space of the program. As noted, modeling the semantics of the Ada rendezvous using the semantics of the SMV processes is not possible, however, and would preclude our using the FSAs generated from our CFGs for the SMV input. We set a higher priority on the requirement that the programs be the same for each tool, at the risk of introducing bias against one or more of the tools. There is also a potential bias introduced when we use additional flags and embed operations on those flags in the system transitions in order to check certain properties. Since this could degrade SMV's performance by increasing the size of the state space, we also specified event sequence properties using an alternative CTL specification that does not require additional flags. We specified properties for SPIN using both never claims and assertions to ensure that our choice of property specification technique does not bias our results against SPIN. Since SPIN+PO requires the use of assertions, we used assertions in SPIN to allow comparison of the results. It may be the case that using never claims yields better
Improving Accuracy As discussed above, we model certain variables in the program being analyzed to improve the accuracy of the analysis. The choice of which variables to model may well introduce bias against some of the tools. For example, SPIN, SPIN+PO, SMV, and INCA all run faster when both variables are modeled in the readers/writers program. The problem is that, for a program that contains a large number of variables, trying to model all the variables might make building the program representations or performing the analysis on those representations
7
performance by SPIN, however, so we specified properties using never claims as well. In our implementation of the readers/writers problem, none of the accept statements have bodies. This does not affect the tools using inputs based on FSAs because the accept bodies are collapsed into single FSA states. Similarly, it does not affect FLAVERS, since this tool optimizes the empty accept bodies away. It is not clear, however, whether this affects the performance of INCA. Therefore, for INCA we ran the analysis cases on a version of the program that had no accept bodies and on a version containing accept bodies. We also note that most examples of INCA input that we have seen represent sets of identical tasks as arrays of task types, while the Ada program we used as a model contains each reader and writer task specified uniquely. Since it is unclear how this affects INCA performance, we ran the analysis cases on INCA with a conversion from the Ada program and with a conversion from a version with arrays of reader and writer tasks. Finally, for some properties, we found it intuitive to specify the INCA query using two intervals, which can cause a significant growth in the size of the inequality system. In these cases, we also specified the queries using single intervals and ran the analysis cases using both types of queries. Unless it can be formally established that these variations have no effect on the experimental results, it is important that any experiment using these tools check for potential bias. The variations, or configurations, that we considered in our experiment are shown in Table 1. For statistical analysis it is necessary to run each (tool, configuration, program, size, property) tuple a number of times. The number of combinations and associated runs for each is surprisingly large, which significantly increases the amount of time required to run the experiment. To check for potential biases, we perform a standard form of hypothesis testing. In hypothesis testing, a null Tool
Property Style
SPIN
Never Claims Assertions Additional Variables Additional Variables Alternate CTL Spec Alternate CTL Spec Multiple Intervals Multiple Intervals Multiple Intervals
SMV
INCA
hypothesis (H0) and an alternative hypothesis (H1) are formed, a set of data is collected, and the probability of collecting that set of data given the null hypothesis is calculated. If this probability is very small (less than 0.05 is typically considered significant), we can reject the null hypothesis (and accept the alternative hypothesis) with a small probability of doing so incorrectly. If we do not reject the null hypothesis, we have not proved it -- we have simply been unable to reject it given the data at hand. To explain this technique, we discuss checking to see whether using assertions rather than never claims introduces bias against SPIN, but the methodology for the checking the other biases is identical. The null hypothesis for our example is that analysis times using assertions are equal to analysis times using never claims. For our alternative hypothesis, we check whether the analysis times are different. If the set of analysis times for each tuple for SPIN represent a normal or near-normal distribution, we can use a two sample t-test to perform our hypothesis testing. Although we can use a two sample ttest to check the possibility of bias for a given tuple, we also would like to know whether bias has been introduced over all the programs, sizes and properties. To do this, we can use a similar technique, called the paired-sample ttest. Similar non-parametric statistical tests can be used if the analysis times are not normally distributed. The results of these tests in our experiment indicated that the only statistically significant results were for SMV, using additional flags as opposed to using an alternative CTL specification without those flags. For the programs and properties in our experiment, using the additional flags yielded faster analysis times than using the alternate CTL specification. However, these results do not prove that these potential areas of bias will not affect an experiment using other programs, properties, or program sizes. For example, our statistical tests indicated that we did not introduce bias into our experiment using two
REORDER
Accept Bodies
All Arrays
No No
No Yes No Yes
Multiple Intervals Additional Constraints Additional Constraints
Yes Yes No No
No Yes No Yes No Yes
Additional Constraints Additional Constraints
Yes Yes
No Yes
Table 1. Tool Configurations
8
intervals, rather than one, in our INCA queries, but we know that this choice would introduce bias for larger program sizes. Therefore, any experiment using the tools in our experiment should incorporate a means of checking for any identified areas of potential bias.
case, but also includes some (indirect) measure of consistency. Another point of comparison for analysis times is the average ranking for each tool. For each case, we rank the tools (1 = fastest, 2 = second fastest, etc.) based on analysis time. For each tool, we then average these rankings across all cases and use this average for comparison, where tools with the smallest average ranking would fare best in this comparison. This average can still be affected by outliers, but because the worst ranking a tool can have on a given case is given by the number of tools in the experiment, the effect of outliers is not of much concern. Because it is an average, this measure also (indirectly) includes consistency. Unfortunately, using the average ranking might penalize a tool that performs very well on some programs but very poorly on others. A comparison measure should be able to detect this as well. The choice of what to compare for analysis times is a difficult one. All of the above measures have advantages and disadvantages, and it is probably the case that a number of measures should be used. It would also be interesting to measure the rates at which analysis time and consumption of other resources, such as memory, grow as the size of the programs being analyzed increases. Corbett proposed a measure of such growth for individual programs for a single property [5]. It is not clear how we can extend this calculation to combine data from multiple programs and properties. In addition, although Corbett provides some justification for his calculation of growth rate, it is not clear that this measure will always capture the true growth. Another issue is how to compare tool failures. In our experiment, any analysis that took longer than 5 hours CPU time was classified as a failed analysis. The selection of 5 hours is somewhat arbitrary, but in an experimental environment we need to choose a limit to ensure the experiments run in a reasonable period of time. Analysis cases that exhausted available memory, terminated with some internal error, or could not be compiled (for SPIN and SPIN+PO) were also classified as failures. One way to compare failures is to compare the counts of failure cases for each tool; the tools with the lowest number of failed cases would fare best in the comparison. For this comparison to be meaningful, all the tools need to be run on the same analysis cases. Another way to compare failures is to use percentages of failures. For each tool, we calculate the percentage of analysis cases on which that tool failed. We can then compare these percentages across the tools, where the tools with the lowest failure percentages would fare best in the comparison. The tools need to be run on the same analysis cases for this comparison to be truly meaningful, however, which makes this comparison equivalent to a comparison of failure counts.
Measurement Comparisons In our experiment we wanted to compare analysis times, failures, and spurious results. Ultimately, there does not appear to be a single measure that will fully characterize these aspects of the tools. Instead, we need to use a combination of measures. For example, we would like to measure the analysis time required for each tool to analyze a particular program and property. The first question is "What exactly constitutes the analysis time used by the tool?". We could consider the time each tool takes to generate the analysis results from its native input as the analysis time. This time does not include the cost of translating the Ada programs into each tool's input language as part of the analysis time for that tool, on the grounds that this translation is an artifact of our methodology. On the other hand, this translation is necessary to use the tools on Ada programs, and an analyst using one of these tools as part of the development of a concurrent Ada program would certainly want to know how long the full analysis would take, starting from the Ada code. Analysis time can therefore also be defined to include timing information for all the translation steps in the analysis process and for the compilation of the C programs generated by SPIN and SPIN+PO. One way to compare analysis times is to compare the mean analysis times for each tool, where the tools with the lower mean times would fare best in the comparison. Unfortunately, outliers can have a significant effect on the mean. For example, a tool with consistently small analysis times, except for a few very large analysis times, could easily have a larger mean analysis time than a tool that has consistently larger analysis times but no outliers. Also, if a tool fails on a large number of cases but has small analysis times for those cases on which it does not fail, this tool would have a lower mean analysis time than a tool that fails less often but is slower on the cases for which it does not fail. Another way to do the comparison is to count the number of cases for which each tool has the fastest analysis time; tools with the largest numbers of "fastest cases" would fare best in this comparison. This measure also has problems, however. Specifically, a tool that consistently had the second or third fastest analysis times, but seldom had the fastest, would do worse in this comparison than a tool that had the fastest analysis times more often than the first tool, but generally had the slowest analysis times. We would like a measure that not only captures how well a tool compares to the others for each
9
A third issue is how to compare spurious results. One way is to use counts of the spurious results for comparisons. Because a spurious result would only be counted on an analysis case that did not fail, however, and because the tools are unlikely to fail on the exact same number of cases, comparing spurious result counts is problematic. Another way to compare spurious results is to use percentages of spurious results for comparison. For each tool, we calculate the percentage of analysis cases on which the tool yielded spurious results. This comparison will only be truly meaningful if each of the tools has a significant number of non-failing analysis cases and there are not significant differences in this number for each of the tools. It is difficult to immediately discern and compare the percentage of successful analysis cases for the tools by using only failure or spurious result percentages. We define a successful analysis cases as one that runs to completion (does not fail) and yields the correct answer (does not give a spurious result). The percentage of successful analysis cases may provide a better point of comparison than failure or spurious result percentages used in isolation. One important quantity that we did not measure in our experiment is how much user effort is required to apply each of the analysis tools. This effort includes adding flags to the PROMELA and SMV inputs for some of the properties, specifying the properties using each tool's specification formalism, and determining the cause of spurious results using each tool's output. Especially given the iterative property specification process described above, user effort can be a significant amount of time. Unfortunately, measuring user effort in an unbiased manner would require an experiment using multiple human subjects, with the extensive additional experimental design concerns such a human experiment entails.
can not describe the programs using standard SMV style, since rendezvous semantics is not supported. Our experiment design places a strong emphasis on analysis of the same program by all the tools, at the risk of biasing the results based on our conversion of the program to the inputs for each tool. Limiting the maximum program size to that handled by the worst tool (for that program and property) can affect the results of our checks for bias. For example, we found in our experiment that specifying INCA queries using two intervals rather than one did not affect the analysis time. As we increase the size of the programs past the maximum size in the experiment, however, we find that the number of intervals in the query has a significant effect on analysis time, where using a single interval is faster for larger programs. We applied all the tools to the same program sizes to allow a direct comparison of analysis times. Similarly, as noted above, some of the tools ran faster in our experiment when all variables were modeled. Thus, the choice of a strategy for modeling variables may effect tool performance. These are just some examples demonstrating how the decisions that we make about one issue can have a subtle impact on other issues. CONCLUSIONS We have conducted an experiment comparing a number of static concurrency analysis tools, checking several properties on each of several Ada programs appearing in the concurrency analysis literature. This paper describes a number of important issues and tradeoffs we faced during the design of that experiment. To ensure that an empirical comparison is valid, the experiment must be designed with great care. While an empirical comparison of static concurrency analysis tools appeared to be a relatively straightforward endeavor, it was surprisingly difficult to design an unbiased experiment. In this paper, we have presented the significant issues and tradeoffs involved in designing such an experiment. These issues include the difficulties associated with selecting programs for the experiment, ensuring each tool analyzes the same program, selecting realistic properties and ensuring each tool checks the same property, avoiding or at least recognizing biases introduced in the experiment, and deciding what to measure and how to compare and interpret those measures. The results of our experiment have changed our future plans. One of our goals was to develop predictive models for each of the tools based on characteristics of the programs and properties in the experiment. While our predictive models for failure were encouraging, our predictive models for analysis time were disappointingly weak. We believe that it will be difficult to develop such predictive models because the performance of each tool seems to be so sensitive to a wide variety of issues and
Interactions I entirely possible that our experiment design introduces bias into the comparison in more subtle ways than has been discussed above. For example, the sizes of the PROMELA programs grow quickly because we use FSAs as their basis, which can affect analysis time and certainly impacts the largest size SPIN and SPIN+PO can analyze. If we instead described the programs using "standard" PROMELA style, the PROMELA programs would be much smaller, potentially leading to smaller analysis times. Corbett discusses how difficult it is to correctly translate an Ada program into PROMELA, however, even for experts [5]. The growth in input size is even more pronounced for SMV, where the transition relation grows exponentially as the size of the program increases. As discussed above, we
10
interdependencies. As noted above, for the second part of this study we plan to perform case studies on several "real" programs we have acquired, but we believe that most of the tools will not be robust enough to handle such programs. Conducting the case studies will probably entail a large amount of effort trying to generate representations of the programs that the tools can successfully use. Empirical comparisons of static concurrency analysis tools are essential to determine which techniques are useful and to provide valuable feedback to researchers in concurrency analysis. Carrying out such a comparison initially appeared to be fairly straightforward, avoiding many of the most difficult problems plaguing empirical work in software engineering. In fact, however, even this relatively straightforward experimental work turns out to involve a large number of difficult issues and to require tradeoffs between conflicting goals. Despite these problems, such work is extremely important. We believe our findings, as reported in this paper, should help others undertake similar studies. Acknowledgments We thank Jay Corbett, Patrice Godefroid, and Rajesh Prabhu for their helpful contributions to our experiment. This research was supported in part by the Air Force Materiel Command, Rome Laboratory, and the Defense Advanced Research Projects Agency under contract F30602-94-C-0137, and by NSF grant CCR-9407182.
[4]
James C. Corbett. An empirical evaluation of three methods for deadlock analysis of Ada tasking programs. In Proceedings of the 1994 International Symposium on Software Testing and Analysis (ISSTA), pages 228-239, Seattle WA, August 1994.
[5]
James C. Corbett. Evaluating deadlock detection methods for concurrent software. Transactions on SoftwareEngineering, 22(3):161-180, 1996.
[6]
Matthew B. Dwyer and Lori A. Clarke. Data flow analysis for verifying properties of concurrent programs. In Proceedings of the Second ACM SIGSOFT Symposium on Foundations of Software Engineering, pages 62-75, New Orleans LA, December 1994.
[7]
Patrice Godefroid and Pierre Wolper. Using partial orders for the efficient verification of deadlock freedom and safety properties. In Proceedings of the Third Workshop on Computer Aided Verification, LNCS vol. 575, pages 417-428, July 1991.
[8]
Gerard J. Holzmann. Computer Protocols. Cliffs, NJ,1991.
[9]
Kenneth L. McMillan. Symbolic Model Checking. Kluwer Academic Publishers, Boston, MA, 1993.
[10]
Doron Peled. Combining partial order reductions with on-the-fly model checking. In Proceedings of the 6th International Conference on Computer Aided Verification, pages 377-390, Stanford CA, June 1994.
[11]
Walter F. Tichy, Paul Lukowitz, Lutz Prechelt, and Ernst A. Heinz. Experimental evaluation in computer science; A quantitative study. The Journal of Systems and Software, 28(1):9-18, January 1995.
Design and Validation of Prentice-Hall, Englewood
References [1]
J.R. Burch, E.M. Clarke, K.L. McMillan, D.L. Dill, and L.J. Hwang. Symbolic model checking: 1020 states and beyond. In Proceedings of the Fifth Annual IEEE Symposium on Logic in Computer Science, pages 428-439, 1990.
[2]
A.T. Chamillard. An empirical comparison of static concurrency analysis techniques. Ph.D. Dissertation, University of Massachusetts, Amherst, 1996.
[3]
James C. Corbett and George S. Avrunin. Using integer programming to verify general safety and liveness properties. Formal Methods in System Design, 6(1):97-123, 1995.
11