The Astrophysical Journal Supplement Series, 224:44 (15pp), 2016 June
doi:10.3847/0067-0049/224/2/44
© 2016. The American Astronomical Society. All rights reserved.
EXPERIMENTAL ENERGY LEVELS AND PARTITION FUNCTION OF THE
12
C2 MOLECULE
Tibor Furtenbacher1, István SzabÓ1, Attila G. Császár1, Peter F. Bernath2, Sergei N. Yurchenko3, and Jonathan Tennyson3 1
Institute of Chemistry, Eötvös Loránd University and MTA-ELTE Complex Chemical Systems Research Group, H-1518 Budapest 112, P.O. Box 32, Hungary;
[email protected] 2 Department of Chemistry, Old Dominion University, Norfolk, VA, USA 3 Department of Physics and Astronomy, University College London, London WC1E 6BT, UK;
[email protected] Received 2016 February 22; revised 2016 April 26; accepted 2016 April 26; published 2016 June 24
ABSTRACT The carbon dimer, the 12C2 molecule, is ubiquitous in astronomical environments. Experimental-quality rovibronic energy levels are reported for 12C2, based on rovibronic transitions measured for and among its singlet, triplet, and quintet electronic states, reported in 42 publications. The determination utilizes the Measured Active RotationalVibrational Energy Levels (MARVEL) technique. The 23,343 transitions measured experimentally and validated within this study determine 5699 rovibronic energy levels, 1325, 4309, and 65 levels for the singlet, triplet, and quintet states investigated, respectively. The MARVEL analysis provides rovibronic energies for six singlet, six triplet, and two quintet electronic states. For example, the lowest measurable energy level of the a 3Pu state, corresponding to the J=2 total angular momentum quantum number and the F1 spin-multiplet component, is 603.817(5) cm−1. This well-determined energy difference should facilitate observations of singlet–triplet intercombination lines, which are thought to occur in the interstellar medium and comets. The large number of highly accurate and clearly labeled transitions that can be derived by combining MARVEL energy levels with computed temperature-dependent intensities should help a number of astrophysical observations as well as corresponding laboratory measurements. The experimental rovibronic energy levels, augmented, where needed, with ab initio variational ones based on empirically adjusted and spin–orbit coupled potential energy curves obtained using the DUO code, are used to obtain a highly accurate partition function, and related thermodynamic data, for 12C2 up to 4000 K. Key words: molecular data Supporting material: FITS file, machine-readable table 1. INTRODUCTION
astronomical observations and their modeling are supported by a number of laboratory studies (Wodtke & Lee 1985; Urdahl et al. 1988; Bao et al. 1991; Jackson et al. 1991; Blunt et al. 1995, 1996). To make maximum use of the observations one needs accurate rovibronic energy level information, the principal topic of the present paper. Both the Swan (Swings 1943; Gredel et al. 1989; Lambert et al. 1990; Rousselot et al. 2000) and the Deslandres– d’Azambuja (Gredel et al. 1989) bands have been observed in fluorescence from comets. Indeed, two singlet, X 1S+ g and 3S+, and d 3P , A 1Pu , and four triplet, a 3Pu , b 3Sc , g g u electronic states are needed to model C2 emission observed in comets. Two spin-forbidden transition systems, a 3Pu 3 + 1 + X 1S+ g and c Su X Sg , are needed to explain the observed intensities in the Swan band (Rousselot et al. 2000). The astronomical observations include solar spectra, where C2 forms an important component of the photospheric carbon abundance (Asplund et al. 2005). So, for example, C2 can be observed in the Sun’s photosphere at visible wavelengths using the Swan band (Asplund et al. 2005) and in the infrared via the Phillips and Ballik–Ramsay bands (Brault et al. 1982). Transitions in the Swan band have also been observed in peculiar white dwarfs (Hall & Maxwell 2008; Kowalski 2010) and the coronae borealis star V coronae australis (Rao & Lambert 2008), while the Phillips band is prominent, for example, in the carbon star HD19557 (Goebel et al. 1983). Transitions in the Ballik–Ramsay band have also been observed in carbon stars (Goorvitch 1990).
12
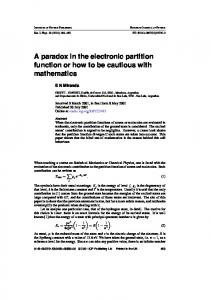
The rovibronic spectra of C2, involving singlet, triplet, and quintet electronic states, are rich and complex in features as well as in anomalies. This is true despite the fact that 12C2, hereafter simply called C2, is a homonuclear diatomic molecule containing only eight valence electrons. There are 62 electronic states corresponding to the 6 possible separated-atom limits formed by different pairs of the C(3P), C(1D), and C(1S) atoms. Eighteen of these states, six singlet, six triplet, and six quintet ones, correspond to the C(3P) + C(3P) asymptote. As summarized in Table 1 and Figure 1, the measured rovibronic spectroscopy of C2 is characterized by 19 known band systems, and a further three intercombination transitions, which cover the spectral range 0–55,000 cm−1 and now all three spin states. Due to the lack of detailed transition data (see Section 2.4 for details), only 14 band systems are considered in the present study. All the states considered, except the e 3Pg and the 4 3Pg states, share the same C(3P) + C(3P) separated-atom limit. The present study was initiated as, rather unusually, at least six of these bands have been used for astronomical observations, with another one having been proposed for such use. There are numerous astronomical observations of C2 spectra with a multitude of important applications for astrophysics. C2 spectra have been observed in comets (Mayer & O’Dell 1968), in high-temperature stars (Vartya 1970), translucent clouds (Sonnentrucker et al. 2007), and in the low-temperature interstellar medium (Souza & Lutz 1977). High-quality studies of rotational and spatial distributions of C2 in comets are available (Lambert 1978; Lambert et al. 1990). The 1
The Astrophysical Journal Supplement Series, 224:44 (15pp), 2016 June Singlet, Triplet, and Quintet Band Systems of Multiplicity Singlet
Furtenbacher et al.
Table 1 C2 for which Rovibronic Transitions Have Been Reported in the Literature. Band Systems Printed in Italics, due to Reasons Given Below, Are Not Considered in This Paper
12
Band System
Transition
A 1Pu –X 1S+ g 1 + D 1S+ u –X Sg F1Pu –X 1S+ g B 1Dg –A 1Pu 1 B¢ 1S+ g –A Pu 1 1 C Pg –A Pu C¢ 1Pg –A 1Pu 1 E 1S+ g –A Pu 11Du –A 1Pu 11Du –B 1Dg b 3S-g –a 3Pu d 3Pg –a 3Pu e 3Pg –a 3Pu f 3S-g –a 3Pu g 3Dg –a 3Pu 4 3Pg –a 3Pu d 3Pg –c 3S+ u e 3Pg –c 3S+ u 1 5Pu –1 5Pg a 3Pu –X 1S+ g 1 5 Pg –a 3Pu A 1Pu –b 3S-g
Phillips Mulliken Herzberg F Bernath B Bernath B¢ Deslandres–d’Azambuja Messerle–Krauss Freymark
Triplet
Goodwin–Cool A Goodwin–Cool B Ballik–Ramsay Swan Fox–Herzberg Herzberg f
Quintet Intercombination
Herzberg g Krechkivska–Schmidt Duck Kable–Schmidt Radi–Bornhauser triplet-singlet quintet-triplet singlet-triplet
Original Detection Phillips (1948a) Landsverk (1939) Herzberg et al. (1969) Douay et al. (1988b) Douay et al. (1988b) Deslandres & d’Azambuja (1905) Messerle & Krauss (1967) Freymark (1951) Goodwin & Cool (1988a) Goodwin & Cool (1988a) Ballik & Ramsay (1958) Swan (1857) Fox & Herzberg (1937) Herzberg et al. (1969) Herzberg et al. (1969) Krechkivska et al. (2015) Kokkin et al. (2006) Nakajima et al. (2009) Bornhauser et al. (2011) Chen et al. (2015) Bornhauser et al. (2011) Chen et al. (2015)
bands (Herzberg 1946; Little & Browne 1987; Caubet & Dorthe 1994) that can be prominent in such environments at atmospheric pressure. Studies of the spectra, and thus the band systems, of C2 date all the way back to Wollaston (1802) and the dawn of spectroscopy, when C2 emissions were first observed in flames. Detailed studies by Swan (1857) of the most prominent band of C2 also predate the development of the quantum mechanical tools required to interpret the spectroscopic results obtained. Over the following century and a half, a number of other bands have been detected and studied. Indeed, four band systems have been identified during the last decade (Kokkin et al. 2006; Nakajima et al. 2009; Bornhauser et al. 2011; Krechkivska et al. 2015). Table 1 lists the known band systems of C2 relevant for the present study. A large number of spectroscopic measurements exist for the different band systems of C2. All the studies that contain primary measured transitions at a reasonable level of accuracy are considered during the present analysis. The experimental papers found and analyzed by us are listed here based on the band systems: Phillips (Phillips 1948a; Ballik & Ramsay 1963b; Chauville et al. 1977; Erman et al. 1982; Davis et al. 1988a, 1988c; Douay et al. 1988a; Chan et al. 2004; Petrova & Sinitsa 2006; Nakajima & Endo 2013; Chen et al. 2015), Mulliken (Landsverk 1939; Mulliken 1939), BernathB (Douay et al. 1988b; Bao et al. 1991), BernathB′ (Douay et al. 1988b), Freymark (Freymark 1951; Blunt et al. 1996), Ballik–Ramsay (Ballik & Ramsay 1963a; Veseth 1975; Amiot et al. 1979; Roux et al. 1985; Yan et al. 1985; Davis et al. 1988b; Petrova & Sinitsa 2006; Bornhauser et al. 2011; Chen et al. 2015), Swan (Swan 1857; Raffety 1916; Callomon & Gilby 1963; Meinel & Messerle 1968; Phillips 1968; Phillips & Davis 1968; Brewer &
Interstellar C2 has been observed via the infrared Phillips band, for example, in the Perseus molecular complex (Hobbs 1979; Lambert et al. 1995; Iglesias-Groth 2011) and toward the Cyg OB2 association (Gredel et al. 2001). Emission features from the Swan band have been observed in the Red Rectangle (Wehres et al. 2010). Sonnentrucker et al. (2007) observed absorbotion in the Phillips, Mulliken and Herzberg F bands in their study of translucent clouds by the simultaneous use of observations from both space and ground-based telescopes. 3 The rovibrational manifolds of the X 1S+ g and a Pu states strongly overlap, as the corresponding electronic excitation energy is less than half of the vibrational spacing in either state. Lebourlot & Roueff (1986) suggested that long-wavelength transitions between levels in the a 3Pu –X 1S+ g band should provide a good method for monitoring interstellar C2. Rousselot et al. (1998) attempted to observe such lines in the Hale–Bopp comet, without success. The accurate rovibronic energy levels presented in this paper can be used to provide accurate transitions for such features. As for the other bands, at ultraviolet wavelengths the International Ultraviolet Explorer was used to observe C2 toward X Persei via the Herzberg F band (Lien 1984). The Hubble Space Telescope also has been used to monitor C2 absorption in the ultraviolet using both the Mulliken and the Herzberg F bands (Lambert et al. 1995; Hupe et al. 2012). Finally, we note that all of the bands mentioned are important in laboratory plasmas (Chen & Mazumder 1990; Duxbury et al. 1998; Hornkohl et al. 2011) and flames (Bleekrode & Nieuwpoort 1965; Amiot et al. 1979; Brockhinke et al. 1998; Lloyd & Ewart 1999; Smith et al. 2005; Goldman & Cheskis 2008). For example, there are particular vibrational bands of the Swan system known as the High Pressure (HP) 2
The Astrophysical Journal Supplement Series, 224:44 (15pp), 2016 June
Furtenbacher et al.
Martin 1992; Van Orden & Saykally 1998). Huber & Herzberg (1979) reported the analysis of seven singlet and seven triplet states. Weltner & Van Zee (1989) reviewed the then available experimental and theoretical results. The spectroscopic and kinetic properties of C2, including 23 electronic states studied prior to 1992, were reviewed by Martin (1992). Van Orden & Saykally (1998) reviewed the spectroscopy of small carbon clusters which, once again, covered the extensive spectroscopic literature available for C2. The present paper surveys all rovibronically resolved measurements made up to the end of 2015. A large number of ab initio computations have been performed on C2 (Kirby & Liu 1979; Bauschlicher & Langhoff 1987; Watts & Bartlett 1992; Boggio-Pasqua et al. 2000; Bruna & Grein 2001; Müller et al. 2001; Abrams & Sherrill 2004; Sherrill & Piecuch 2005a; Kokkin et al. 2007; Booth et al. 2011; Jiang & Wilson 2011; Schmidt & Bacskay 2011; Angeli et al. 2012; Boschen et al. 2013, 2014; Krechkivska et al. 2015, 2016). Notable among the sophisticated electronic structure computations are those of Bacskay (Kokkin et al. 2007; Schmidt & Bacskay 2011; Krechkivska et al. 2015, 2016); for example, they led to the observation of the Duck band and enabled the identification of the Krechkivska–Schmidt band system. Boschen et al. (2013) pointed out that “at the present state of the art, theoretical potential energy curves (PECs) that reproduce the rotationalvibrational levels to spectroscopic accuracy (1 cm−1) or near spectroscopic accuracy (10 cm−1) are considered highly accurate.” Reproduction of measured electronic excitation energies of C2 appears to be even more problematic; an accuracy of a few hundred cm−1 seems to be the norm. Thus, it is still of interest to perform accurate quantum chemical computations on C2 and its rovibronic states. Results of a preliminary, first-principles analysis are reported here (vide infra), used in particular for checking the experimental transitions and energy levels. The main body of the present work is a Measured Active Rotational-Vibrational Energy Levels (MARVEL; Furtenbacher et al. 2007; Furtenbacher & Császár 2012a) analysis of the measured rovibronic states of C2. Our analysis has been in progress for 4 years but a real breakthrough came with the study of Chen et al. (2015), who observed 16 forbidden transitions between singlet and triplet states. This study coupled, for the first time, the singlet and triplet components of the observed spectroscopic network (SN) (Császár & Furtenbacher 2011; Furtenbacher & Császár 2012b; Császár et al. 2016) of C2, allowing a much improved analysis of its rovibronic energy level structure. We analyze all the known bands of C2 with the exception of the five VUV bands due to Herzberg et al. (1969) and Goodwin & Cool (1988a, 1988b, 1989). These bands involve upper energy levels that arise from a single experiment and are too high for us to be able to independently validate them. Finally, when a complete set of accurate energy levels is available for a molecule, it can be used, via the direct summation technique, to compute accurate ideal-gas thermodynamic functions, most importantly the high-temperature internal partition function, Qint (T ). We do this here for C2, complementing and improving several previous efforts (Altman 1960; Clementi 1961; Irwin 1981; Sauval & Tatum 1984; Rossi et al. 1985; Gurvich & Veyts 1990), and arrive at very precise and accurate values for Qint (T ) of C2 up to 4000 K.
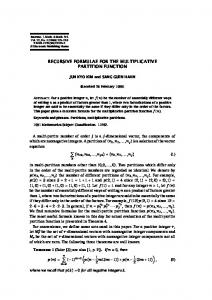
Figure 1. The band system of 12C2 showing the bands considered in this work. The dashed lines represent observed but unnamed intercombination bands.
Hagan 1979; Amiot 1983; Curtis & Sarre 1985; Suzuki et al. 1985; Urdahl et al. 1988; Chen & Mazumder 1990; Kaminski et al. 1997; Lloyd & Ewart 1999; Smith et al. 2005; Kokkin et al. 2006), Fox–Herzberg (Fox & Herzberg 1937), Deslandres–d’Azambuja (Deslandres & d’Azambuja 1905; Antić-Jovanović et al. 1985; van de Burgt & Heaven 1987; Urdahl et al. 1988), Messerle–Krauss (Messerle & Krauss 1967), Goodwin–Cool (Goodwin & Cool 1988a, 1988b, 1989), Duck (van de Burgt & Heaven 1987; Kokkin et al. 2006), Krechkivska–Schmidt (Krechkivska et al. 2015, 2016) and Radi–Bornhauser (Bornhauser et al. 2015), as well as various spin-changing intercombination bands (Bornhauser et al. 2011; Chen et al. 2015). It is interesting to note that for a long time a triplet state, now named a 3Pu , was believed to be the lowest electronic state of C2 and not a singlet state, the true ground electronic state, X 1S+ g . The source of the confusion, detailed in Ballik & Ramsay (1959), is that the energy difference between the two electronic states is only about one half of the vibrational fundamental of either state so that the Swan system can be seen in absorption in many sources. The spectroscopy and the spectroscopic constants of C2 have been the subject of several reviews (Huber & Herzberg 1979; Weltner & Van Zee 1989; 3
The Astrophysical Journal Supplement Series, 224:44 (15pp), 2016 June
Furtenbacher et al.
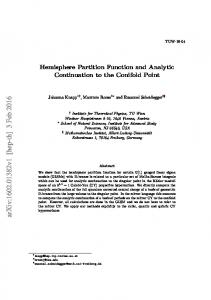
2. METHODOLOGICAL DETAILS 2.1. Experimental Spectroscopic Network of C2 The MARVEL (Furtenbacher et al. 2007; Furtenbacher & Császár 2012a) procedure and code is used in this study to obtain rovibronic energies of C2 by inverting all assigned experimental rovibronic transitions available in the literature for this molecule. MARVEL is based on the concept of SNs (Császár & Furtenbacher 2011; Furtenbacher & Császár 2012b; Császár et al. 2016): SNs are large, finite, weighted, rooted graphs, where the vertices are discrete energy levels (with associated uncertainties), the edges are transitions (with measured uncertainties), and in a simple picture the weights are provided by the transition intensities. No weights are considered during the present study. Within the experimental SN of a molecule there can be several rooted components and several floating ones. For many molecules the rooted components belong to ortho and para nuclear spin isomers. However, the nuclear spin of 12C is zero; thus, 12C2 has only one nuclear spin isomer and one root for its lowest electronic state, X 1S+ g. Transitions between electronic states of different spin multiplicity are spin forbidden; thus, until 2011 no lines were measured and assigned experimentally between the singlet and triplet and the triplet and quintet manifold of states of C2. First, Bornhauser et al. (2011) observed transitions linking triplet and quintet electronic states, leading to the first observation and characterization of a quintet band of C2. Later, Chen et al. (2015) managed to identify 16 spin-forbidden transitions between singlet and triplet states. These spin-forbidden transitions proved to be particularly important during the MARVEL analysis of the experimental spectra of C2. Using these forbidden transitions the experimental SN of C2 simplifies because now it contains only one principal component (PC). The label of the root of the PC is {0 + X 1S+ g 0 F1 e}, for the notation employed for the label see Section 2.3. The measured SN of C2 is shown pictorially in Figure 2; the singlet, triplet, and quintet energy levels are indicated with different colors. Since Figure 2 is a particular representation of a network (i.e., a graph), the arrangement of the nodes (energy levels) and links (transitions) is arbitrary, but clearly displays several important characteristics of the SN of C2. Figure 2 vividly shows, for example, how weakly the singlet rovibrational energy levels are connected to the triplet core.
Figure 2. Representation of the experimental spectroscopic network built in this study for 12C2. The blue, red, and green dots correspond to the singlet, triplet, and quintet rovibronic states, respectively. The dots represent energy levels and only some of the transitions are visible, especially those connecting the singlet and the triplet as well as the triplet and the quintet rovibrational states.
checked whether the labels of all experimental transitions follow the same convention. At the beginning, the MARVEL analysis of the spectra of C2 was complicated by the fact that there have been no truly highaccuracy variational or effective Hamiltonian rovibronic energy levels available for this molecule at higher energies. This situation greatly improved by the first-principles DUO (Yurchenko et al. 2016a) analysis performed as part of this study (vide infra), allowing at least a preliminary validation of the MARVEL levels up to 35,000 cm−1. 2.3. Labels and Quantum Numbers For MARVEL to work properly one needs appropriate and unique labels. The label used in the present study for a rovibronic energy level is built up from information concerning the uncoupled electronic state, the vibrational and rotational quantum numbers, and the symmetry of the rovibronic state. The label finally chosen for each energy level, {J, +/−, state, v, Fi, e/f}, fully characterizes the rovibronic states of a homonuclear diatomic molecule, such as C2, but contains redundant information (Brown & Carrington 2003; LefebvreBrion & Field 2004; Bernath 2016). Here J 0 is the quantum number corresponding to the total angular momentum (an integer value) characterizing the state, + - labels the total state parity, +1 -1, in terms of the laboratory-fixed inversion operator E * (Bernath 2016), “state” is the customary term symbol of the electronic state before spin–orbit coupling is 3 taken into account (e.g., X 1S+ g and b Sg ), and v is the vibrational quantum number. The Fi, i = 1, 2, ¼, 2S + 1, label denotes the spin multiplet components: for singlet states i=1,
2.2. MARVEL During a MARVEL analysis we simultaneously process all the available assigned and labeled experimental transitions. The energy levels are obtained from the set of transitions via a weighted linear least-squares inversion protocol. As the MARVEL technique has been employed to determine experimental-quality energy levels of nine isotopologues of water (Tennyson et al. 2009, 2010, 2013, 2014a, 2014b), of three isotopologues of H+ 3 (Furtenbacher et al. 2013a, 2013b), as well as of ammonia (Al Derzi et al. 2015) and ketene (Fábri et al. 2011), the interested reader is referred to these publications for details about the different stages of a MARVEL analysis. Since C2 has both regular and inverted triplet states (see the next subsection for details), for example, the a 3Pu and d 3Pg of C2 are inverted, during the MARVEL analysis it was 4
The Astrophysical Journal Supplement Series, 224:44 (15pp), 2016 June
Furtenbacher et al.
i.e., Fi º F1, for triplet states i = 1, 2, 3, which corresponds to the standard spectroscopic notation F1, F2 , and F3 ( F1, F2, F3 refer to levels with J = N + 1, N , N - 1, where N is the quantum number corresponding to the angular momentum exclusive of nuclear and electron spin and it is usually not a good quantum number), and for quintet states i = 1, 2, 3, 4, 5 (Whiting 1973). The convention (Bernath 2016) is such that whether the state is regular ( A > 0) or inverted ( A < 0 ), the energy order is always F3 > F2 > F1 for the triplet states. The g and u subscript in the “state” label indicate if the symmetry of the electronic state is “gerade” (positive) or “ungerade” (negative) in terms of the molecule-fixed inversion operator, i (Bernath 2016). The + - superscripts within the S+ - states indicate the parity of the electronic component with respect to vertical reflection, sv , in the molecular frame (Bernath 2016). The rotationless parity e/f is a widely used alternative to the total parity + -, this redundant information is included in our MARVEL label to help experimentalists. For C2 the allowed combination of the parity + - and the label g/u is (+, g) and (−, u). The rotationless parity e/f is then obtained as follows: (a) for the e states, the parity (+1 or −1) can be recovered as (-1)J , i.e., for the even values of J the parity of the e states is +1, while for odd Js it is −1; and (b) for the f states, the parity is recovered as (-1)J + 1, i.e., for even Js the parity is −1, and for odd Js it is +1. The rigorous electric dipole selection rules for the rovibronic transitions are J - J ¢ = 1, 0, , 0 « 0,
(1 )
+«- , g « u .
(2 )
these bands probe upper states that are too high in energy for reliable, independent theoretical predictions, it was decided to leave their inclusion in a MARVEL analysis for future work. We note that omitting the energy levels associated with these bands is not critical for the partition sums and thermodynamic data determined as part of this study. We also note that papers by Sorkhabi et al. (1997) and, Joester et al. (2007) refer to the so-called LeBlanc band 1 + comprising weak D 1S+ u –B′ Sg transitions; however, we could find no line data on this band or any papers by LeBlanc reporting it. Second, the set of comments below refer to data sources used in our MARVEL analysis and listed in Table 2. (2a) 06PeSi (Petrova & Sinitsa 2006). Uncertainty assumed to be 0.01 cm−1 (T. Petrova 2015, private communication). (2b) 04ChYeWoLi (Chan et al. 2004). The data used are extracted from 15ChKaBeTa (Chen et al. 2015). (2c) 97SoBlLiXu (Sorkhabi et al. 1997) and 39Landsver (Landsverk 1939). Uncertainty of these two sources is assumed to be 1.0 and 0.2 cm−1, respectively. (2d) 51Freymark (Freymark 1951). The stated uncertainty was doubled to 0.02 cm−1, as this seems to be a more adequate guess of the accuracy of these transitions. (2e) 85YaCuMeCa (Yan et al. 1985). Results recorded using magnetic rotation. The data are provided by R. F. Curl (2015, private communication). The uncertainty was increased to 0.005 cm−1, as values below this did not give consistent results during the MARVEL analysis. (2f) 85RoWaMiVe (Roux et al. 1985). This source presents an analysis of measurements by Amiot et al. (1979); the data were extracted from 15ChKaBeTa (Chen et al. 2015). (2g) 13BoSyKnGe (Bornhauser et al. 2013). New assignments and reassignments of the measurements by 13YeChWa (Yeung et al. 2013). (2h) 13YeChWa (Yeung et al. 2013). Assignments corrected following 13BoSyKnGe (Bornhauser et al. 2013). (2i) 03KaYaGuYu (Kaniki et al. 2003). 0.007 cm−1 uncertainty; includes 26 transitions with DW = 1. (2j) 85CuSa (Curtis & Sarre 1985), 85SuSaHi (Suzuki et al. 1985), 94PrBe (Prasad & Bernath 1994) and 10BoKnGe (Bornhauser et al. 2010). Data extracted from 13BrBeScBa (Brooke et al. 2013). (2k) 86HaWi (Hardwick & Winicur 1986). Data provided by J. L. Hardwick (2015, private communication). (2l) 98BrHaKoCr (Brockhinke et al. 1998). Uncertainty assumed to be 0.02 cm−1. (2m) 16KrBaWeNa (Krechkivska et al. 2016). Gives a single line position as part of the multiphoton spectroscopic measurement of the ionization energy of C2.
As mentioned, the nuclear spin statistical weight gns of the nuclear spin-zero 12C2 molecule for the (+, g) and (−, u) states is 1, while the (−, g) and (+, u) states have gns = 0. Therefore, the latter states do not appear in spectroscopic experiments on 12 C2. The MARVEL input set of measured transitions was checked for a corresponding labeling error. 2.4. Comments on the Data Sources First, we make comments on those observed bands of C2 which were not used in the MARVEL analysis. The situation with the Deslandres–d’Azambuja band is a remarkable one. The band was originally observed more than a century ago (Deslandres & d’Azambuja 1905) and as discussed in the Introduction, it has been observed in a number of astronomical objects. However, while a high-resolution line list is available for 13C2 (Antić-Jovanović et al. 1985) and there are a number of papers reporting laboratory observation of the band for 12C2 (Herzberg & Sutton 1940; Hornbeck & Herman 1949; Cisak et al. 1969; Urdahl et al. 1988; Sorkhabi et al. 1997), there are no high resolution line data for the band. A high resolution re-measurement of the band for 12C2 would be welcomed. Observation of the Messerle–Krauss band is reported in a single, short paper (Messerle & Krauss 1967), which provides no line data. Similarly, there are so far no published lines for the recently detected Kable–Schmidt band (Nakajima et al. 2009). The situation with the three Herzberg and two Goodwin– Cool VUV bands is somewhat different. There are papers reporting detailed spectra for each of these bands (Herzberg et al. 1969; Goodwin & Cool 1988b, 1989). However, each of them comes from a single uncorroborated measurement. As
Third, the next set of comments refers to sources listed in Table 3; these were not used in our MARVEL analysis for reasons listed below. (3a) 82ErLaMa (Erman et al. 1982). This source contains lifetime data but no transition frequencies. (3b) 68MeMe (Meinel & Messerle 1968). No actual line data given in the paper but 11BoSyKnGe (Bornhauser et al. 2011) presents some lines reassigned from this work that are included in our data set, see Table 2. 5
The Astrophysical Journal Supplement Series, 224:44 (15pp), 2016 June
Furtenbacher et al.
Table 2 Experimental Transitions Available in the Literature for Several Band Systems of 12C2 and Their Overall Characteristics, Including the Number of Measured (A) and Validated (V) Transitions (Trans.) References
Range(cm−1)
Method
Trans (A/V)
Comments
15ChKaBeTa 88DaAbPh 88DoNiBea 77ChMaMa 63BaRab 06PeSi 04ChYeWoLi 13NaEn 1 + Mulliken D 1S+ u −X Sg
Chen et al. (2015) Davis et al. (1988a) Douay et al. (1988a) Chauville et al. (1977) Ballik & Ramsay (1963b) Petrova & Sinitsa (2006) Chan et al. (2004) Nakajima & Endo (2013)
2372–8822 4012–6031 4067–7565 4371–11424 6312–14469 9405–9434 10719–14128 13182–16825
FTS D-FTS FTS FTS L L L LIF
319/318 191/191 241/238 774/770 574/532 8/8 293/293 77/73
L L L L L (2a) (2b) L
39Landsver 97SoBlLiXu 95BlLiSo Bernath B 1Dg –A 1Pu 88DoNiBeb 16ChKaBeTa 1 Bernath B′1S+ g –A Pu
Landsverk (1939) Sorkhabi et al. (1997) Blunt et al. (1995)
43051–43473 43062–43490 43224–43289
CAE LIF DL
171/167 179/165 9/8
(2c) (2c) L
Douay et al. (1988b) Chen et al. (2016)
1951–7152 1900–8422
FTS FTS
507/507 1001/1001
L L
88DoNiBeb 1 Freymark E 1S+ g −A Pu
Douay et al. (1988b)
5025–8365
FTS
237/237
L
97SoBlLiXu Sorkhabi et al. (1997) 51Freymark Freymark (1951) Ballik–Ramsay b 3S-g −a 3Pu
43510–43660 45069–48772
LIF L
66/65 376/354
(2c) (2d)
15ChKaBeTa Chen et al. (2015) 85YaCuMeCa Yan et al. (1985) 85RoWaMiVe Roux et al. (1985) 79AmChMa Amiot et al. (1979) 88DaAbSa Davis et al. (1988b) 06PeSi Petrova & Sinitsa (2006) 11BoSyKnGe Bornhauser et al. (2011) Swan d 3Pg −a 3Pu 13NaEn Nakajima & Endo (2013) 14NaEn Nakajima & Endo (2014) 13BoSyKnGe Bornhauser et al. (2013) 13YeChWa Yeung et al. (2013) 07TaHiAm Tanabashi et al. (2007) 48Phillips Phillips (1948a) 02TaAm Tanabashi & Amano (2002) 03KaYaGuYu Kaniki et al. (2003) 85CuSa Curtis & Sarre (1985) 94PrBe Prasad & Bernath (1994) 83Amiot Amiot (1983) 99LlEw Lloyd & Ewart (1999) 85SuSaHi Suzuki et al. (1985) 10BoKnGe Bornhauser et al. (2010) 11BoSyKnGe Bornhauser et al. (2011) Fox–Herzberg e 3Pg –a 3Pu 86HaWi Hardwick & Winicur (1986) 49Phillips Phillips (1948b) 98BrHaKoCr Brockhinke et al. (1998) Duck d 3Pg −c 3S+ u 13ChYeWa Chan et al. (2013) 13NaEn Nakajima & Endo (2013) 14NaEn Nakajima & Endo (2014) 07JoNaRe Joester et al. (2007) Krechkivska–Schmidt 43Pg- a 3Pu 15KrBaTrNa Krechkivska et al. (2015) 16KrBaWeNa Krechkivska et al. (2016) Intercombination a 3Pu −X 1S+ g
2102–9404 3673–4040 4643–8488 4856–9895 4897–5706 9388–9450 22991–23031
FTS L L L D-FTS L L
3510/3507 356/352 1309/1298 2168/2139 382/365 80/80 8/8
L (2e) (2f) L L L L
12596–23497 13673–13877 13847–13927 13849–14128 15149–23110 16151–44722 16877–17113 17731–17895 17736–17941 17915–21315 19354–20191 19354–19511 21101–21263 21343–21427 21389–23019
LIF LIF L HCD FTS discharge HCD L Doppler-free Jet cooled FTS L L L L
168/168 150/141 23/23 276/273 3853/3771 1181/1128 356/352 153/150 217/217 39/39 347/346 138/138 194/194 23/23 46/46
L L (2g) (2h) L
33036–33492 35092–42019 40205–40339
L discharge L
100/100 1833/1664 10/10
(2k) L (2l)
12074–12499 13030–16136 13650–13889 15007–17080
HCD LIF LIF LIF
221/210 513/513 205/196 235/234
L L L L
47921–48327 46736
REMPI L
67/67 1/1
L (2m)
FTS
32/32
L
Tag Phillips A
1P 1 + u −X Sg
15ChKaBeTa
Chen et al. (2015)
3501–8306
6
L (2i) (2j) (2j) L L (2j) (2j) L
The Astrophysical Journal Supplement Series, 224:44 (15pp), 2016 June
Furtenbacher et al.
Table 2 (Continued) Tag Intercombination A
References
Range(cm−1)
Method
Trans (A/V)
Comments
1/1
L
1P 3 u −b Sg
15ChKaBeTa Chen et al. (2015) Intercombination 1 5Pg –a 3Pu 11BoSyKnGe Bornhauser et al. (2011) Radi–Bornhauser 15 Pu - 15 Pg 15BoMaGo Bornhauser et al. (2015)
3940
FTS
21370–21447
FWM
68/68
L
21772–21839
FWM
57/57
L
Notes. Comments are given in Section 2.4. CAE = carbon arc emission, D-FTS = discharge FTS, DL = dye laser, FTS = Fourier Transform Spectroscopy, FWM = four-wave mixing, HCD = Hollow-Cathode Discharge source, LIF = Laser Induced Fluorescence, MD = Microwave Discharge, SJT = Supersonic Jet Technique, REMPI = resonance-enhanced multiphoton ionization. Table 3 Experimental Papers with Either No Data or with Data Not Included in the Present MARVEL Analysis Tag
Reference
Range(cm−1)
Method
Data
Comments
Phillips A 1Pu −X 1S+ g 82ErLaMa Swan d 3Pg −a 3Pu 63CaGi 68MeMe 68PhDa 88UrBaJa 90ChMa 97KaHuEw 94CaDo 99LlEw 05SmPaSc Ballik–Ramsay b 3S-g –a 3Pu 63BaRaa 1 + D 1S+ u −B′ Sg 91BaUrJa Duck d 3Pg −c 3S+ u 06KoReMoNa Kable–Schmidt e3Pg –c 3S+ u 09NaJoPaRe Herzberg 69HeLaMa 1 Freymark E 1S+ g −A Pu
Erman et al. (1982)
L
L
No
(3a)
Callomon & Gilby (1963) Meinel & Messerle (1968) Phillips & Davis (1968) Urdahl et al. (1988) Chen & Mazumder (1990) Kaminski et al. (1997) Caubet & Dorthe (1994) Lloyd & Ewart (1999) Smith et al. (2005)
L L L 21,280–25,930 L L L L L
L L L L L L L L CL
No No Yes No No No No Yes No
L (3b) (3c) L L (3d) (3e) (3f) L
Ballik & Ramsay (1963a)
L
L
Yes
(3g)
28,030–28,555
LIF
No
L
Kokkin et al. (2006)
L
L
No
L
Nakajima et al. (2009)
L
L
No
(3h)
Herzberg et al. (1969)
69,000–73,000
FD
Yes
(3i)
43,510–43,545
LIF
No.
23,800–31,250 21,000–24,500 21,280–25,930
E LIF LIF
L No No
(3j) (3k) (3l)
L
L
No
(3m)
L L L
L L L
No Yes Yes
(3n) (3o) (3p)
Bao et al. (1991)
96BlLiSo Blunt et al. (1996) Deslandres–d’Azambuja C 1Pg −A 1Pu 85AnBoPe Antić-Jovanović et al. (1985) 87VaHe van de Burgt & Heaven (1987) 88UrBaJa Urdahl et al. (1988) Messerle–Krauss C¢ 1Pg –A 1Pu 67MeKr Messerle & Krauss (1967) Goodwin–Cool 88GoCoa Goodwin & Cool (1988a) 88GoCob Goodwin & Cool (1988b) 89GoCo Goodwin & Cool (1989)
Note. Comments about these sources are given in Section 2.4. CL = chemiluminescence, E = emission, FD = flash discharge, LIF = laser-induced fluorescence.
(3c) 68PhDa (Phillips & Davis 1968). A book with an extensive list of lines, including higher bands but only 3607 of the 10910 lines, could not be validated; Tanabashi & Amano (2002) also found that these assignments did not match those of other work. It was therefore decided to omit these lines from the final compilation. (3d) 97KaHuEw (Kaminski et al. 1997). A precursor to 99LlEw (Lloyd & Ewart 1999).
(3e) 94CaDo (Caubet & Dorthe 1994). So-called HP band. (3f) 99LlEw (Lloyd & Ewart 1999). None of these data were selected by 13BrBeScBa (Brooke et al. 2013), so they were not considered in this study either. (3g) 63BaRaa (Ballik & Ramsay 1963a). Original observation by Ballik and Ramsay of their eponymous band. The work was re-assigned by Veseth (1975), but his results are not available. 7
The Astrophysical Journal Supplement Series, 224:44 (15pp), 2016 June
Furtenbacher et al.
(3h) 09NaJoPaRe (Nakajima et al. 2009). Report of a new C2 band but no data are provided and no follow-up study exists. (3i) 69HeLaMa (Herzberg et al. 1969). Report of three new VUV bands with line data. Upper states lie at too high energy for data to be validated. (3j) 85AnBoPe (Antić-Jovanović et al. 1985). Report of extensive data for 13C2 but with no data set for 12C2. (3k) 87VaHe (van de Burgt & Heaven 1987). Report of a “new” C2 band: 25 transitions from one (unknown) band were recorded with an uncertainty of 0.2 cm−1 and assigned J quantum numbers; these were supplied by M. C. Heaven (2015, private communication). The calculations of Bruna & Wright (1992) suggest that this band actually belongs to C+ 2 rather than C2. The band remains unassigned and the data were not included in our current analysis. (3l) 88UrBaJa (Urdahl et al. 1988). No transition data reported in the paper. (3m) 67MeKr (Messerle & Krauss 1967). Discovery paper giving many spectroscopic parameters but no primary transition data. (3n) 88GoCoa (Goodwin & Cool 1988a). Discovery paper: follow-up work with data in 88GoCob (Goodwin & Cool 1988b) and 89GoCo (Goodwin & Cool 1989). (3o) 88GoCob (Goodwin & Cool 1988b). New band 1 1Du – A 1Pu with line data. Upper states lie at too high energy for data to be validated. (3p) 89GoCo (Goodwin & Cool 1989). New band 1 1Du – B 1Dg with line data. Upper states lie at too high energy for data to be validated.
rotational angular momentum Rˆ on the molecular axis is zero). The DUO quantum numbers characterizing the computed rovibronic states are used to check and complete the MARVEL labels. It should be noted that DUO uses an approximate assignment scheme based on the largest contribution to the wavefunction expansion (Yurchenko et al. 2016a). Although this scheme is very robust, it can sometimes lead to ambiguous sets of quantum numbers, especially for states in strong resonance with other rovibronic states. Comparison of the DUO and MARVEL results helped us to identify problems in the experimental data, such as misassigned lines, duplicate transitions, and outliers. 3. RESULTS AND DISCUSSION 3.1. Term Values In its ground electronic state C2 has a fairly strong bond (Mulliken 1939; Müller et al. 2001; Sherrill & Piecuch 2005b; Su et al. 2011). The equilibrium bond distance of the X 1S+ g state at 1.2425 Å is short for a double bond (considerably shorter than the C=C bond of ethylene at re (C=C)=1.331 Å), but long for a triple bond (in C2H2 re (CC)=1.203 Å). This also means that the dissociation −1 energy of the X 1S+ g state is large, more than 50,000 cm , in fact. Compared to this, the energy differences among the several feasible asymptotes comprised by the low-lying 3P, 1D, and 1S states of the C atom are relatively minor. Furthermore, the structure of the molecular orbitals (MO) of C2 is such that a large number of low-energy singlet, triplet, and quintet valence states are feasible and many of them are part of experimentally measurable rovibronic transitions (see Table 1). In the X 1S+ g state the leading valence electron configuration is (core)(2sg )2 (2su )2 (1pu )4 . By promoting electrons from the weakly antibonding 2su and the strongly bonding 1pu MOs and populating the 3sg MO a large number of electronic states arise. Fortunately, for obtaining proper, temperature-dependent idealgas thermochemical quantities up to about 4000 K, it is sufficient to consider nine electronic states, four singlet, four triplet, and one quintet states (see Table 4). As mentioned already, all these lowest-energy electronic states correlate with the C(3P) + C(3P) separated-atom limit. Not too surprisingly for such a simple molecule, a large number of electronic structure computations are available for C2 in the literature (Kirby & Liu 1979; Bauschlicher & Langhoff 1987; Watts & Bartlett 1992; Boggio-Pasqua et al. 2000; Bruna & Grein 2001; Müller et al. 2001; Abrams & Sherrill 2004; Sherrill & Piecuch 2005a; Jiang & Wilson 2011; Boschen et al. 2013, 2014). There are several issues that make the electronic structure computations extremely challenging for C2. First, there is a quasi-degeneracy of the fully occupied 1pu and the empty 3sg MOs, explaining some of the unusual characteristics of the excited electronic states of C2. Second, the existence of several low-lying excited electronic states leads to the occurrence of a considerable number of avoided crossings among the PECs as the CC distance is varied. Third, as pointed out by Abrams & Sherrill (2004) based on full configuration interaction computations, at least in the cases of the X, B, and B′ states, methods based on an unrestricted Hartree–Fock (UHF) reference provide correct but methods based on a restricted HF (RHF) reference provide
2.5. Rovibronic Nuclear Motion Computations Using DUO In order to decide on their correctness, we have compared the experimental MARVEL rovibronic energies with their theoretical counterparts. The latter approximate but complete set of energy levels is based on empirical PECs, spin–orbit curves (SOC), and electronic angular momentum curves (EAMC) of C2 as given by Yurchenko et al. (2016b). The theoretical rovibronic energies were computed using a new diatomic nuclear motion program called DUO (Yurchenko et al. 2016a). DUO solves the fully coupled rovibronic Schrödinger equation variationally using a combination of discrete variable representation and rigid-rotor basis sets to represent the vibrational and the spin-rotational degrees of freedom in the Hund’s case(a) representation, respectively. The final PECs, SOCs, and EAMCs were obtained by refining ab initio curves obtained at the ic-MRCI/aug-cc-pVQZ level of electronic structure theory for the nine lowest electronic states 1 1 3 3 1 + 3 + of C2, X 1S+ g , A Pu , B Dg , B′ Sg , a Pu , b Sg , c Su , 3 5 d Pg , and 1 Pg- by fitting to the MARVEL energies. A detailed account of these computations will be reported elsewhere. DUO uses the following quantum numbers motivated by the Hund’s case (a) choice of the basis set: {J , + - , state, v , L , S , W},
where Λ, Σ, and W (W = L + S) are the signed quantum numbers corresponding to projections of the electronic, spin, and total angular momenta, respectively (the projection of the 8
The Astrophysical Journal Supplement Series, 224:44 (15pp), 2016 June
Furtenbacher et al.
Table 4 Empirical, Experimental (MARVEL), and Theoretical Te and T0 Term Values, in cm−1, of the Six Lowest-energy Singlet and Triplet and the Two Lowest-energy Quintet Electronic States of C2 State
T0
Te a
Empirical 0.0
b
X 1S+ g
Calc. 0.0
DUO 0.0
Empirical 0.0
MARVELb,c 0.0
J 0
F 1
a 3Pu b 3S-g
509 6233
720.0083(21)d 6439.08382(58)d
722.58 6437.00
603.828e 6250.164e
603.817(5) 6250.149(7)
2 0
1 3
A 1Pu c 3S+ u B 1Dg B′1S+ g
8374 9371 11966 15261
8391.4062(19)d 9124.2f 12082.34355(54)h 15410.33(36)h
8393.63 9172.30 12092.45 15401.52
8271.606e 9277g 11859g 15197g
8271.607(7) 9280.215(5) 11867.825(5) 15196.509(5)
1 1 2 0
1 2 1 1
d 3Pg 1 5Pg e 3Pg D 1S+ u 1 5Pu 4 3Pg E 1S+ g
20092 L L L L L L
20022.5f L 40796.7f 43239.8f L
20030.92 L L L L L L
19992g 29258.5922(48)i L L 51 049.799j L L
19983.953(8) 29860.921(5) 40422.691(50) 43230.499(138) 51651.142(20) 52106.042(94) 54936.672(150)
2 2 2 1 1 1 0
1 1 1 1 1 1 1
55034.7f
Notes. a Müller et al. (2001), MR-CISD values at the complete basis set (CBS) limit. b This work. c The lowest observed energy level in each electronic state is reported. J and F are the quantum numbers of this level. d From Chen et al. (2015). e Vibronic energies taken from the supplementary material of Chen et al. (2015). f From Babou et al. (2009). g Empirical vibronic energies taken from Chen et al. (2015). h From Chen et al. (2016). i From Bornhauser et al. (2011), relative to the v=0 level of the a 3Pu state. j From Bornhauser et al. (2015), relative to the v=0 level of the a 3Pu state. Table 5 1 + 1 + Vibrational Energy Levels of the X1S+ g , B¢ S g , and E S g States of C2 State
v
Calc.a
Expt.b
MARVELc
X1S+ g
1
1829.15
1827.4849(2)
1827.486(5)
B ¢ 1S+ g
2 3 4 5 6 7 8 9 1
3630.35 5402.78 7145.40 8856.84 10536.37 12178.69 13783.76 15346.69
3626.6835(2) 5396.6892(4) 7136.3507(6) 8844.1241(11) 10517.9659(39) 12154.9615(29) 13751.3944(38) 15302.8952(46) 1420.4850(4)
3626.681(10) 5396.686(9) 7136.350(6) 8844.124(7) 10517.950(7) 12154.961(6) 13751.393(3) 15302.893(7) 1420.488(9)
E1S+ g
2 3 4 1
L L L L
2840.0048(4) 4261.0686(4) 5681.5113(6) L
Table 6 The Lowest-energy States with J ¹ 0 of the Excited Vibrational Levels of the A1Pu and B1Dg Singlet States of C2
L 4261.071(1) L 1592.316(200)
Notes. All values are given in cm−1. All energies are relative to the appropriate v=0 vibrational level. a From 07KoBaSc (Kokkin et al. 2007). b From Chen et al. (2016). c 1 + This work, values of the v=0 vibrational levels of X1S+ g , B¢ Sg , and −1 are, in cm , 0.0, 15196.509, and 54936.664, respectively. E1S+ g
State
v
J
MARVELa
State
v
J
MARVELa
A1Pu
1 2 3 4 5 6 7 8 9 10 11 12 13 14 15 16
1 1 1 1 1 1 1 L 1 1 1 1 1 1 1 1
1584.008(4) 3143.805(5) 4679.323(6) 6190.503(7) 7677.273(4) 9139.523(9) 10577.184(13) L 13378.377(1) 14741.688(1) 16079.978(7) 17393.116(8) 18680.944(7) 19943.297(7) 21179.968(7) 22390.754(7)
B1Dg L L L L L L L L L L L L L L L
1 2 3 4 5 6 7 8 L L L L L L L L
2 2 2 2 2 2 2 3 L L L L L L L L
1384.440(2) 2746.010(9) 2746.010(9) 5400.804(8) 6694.148(10) 7964.836(3) 9214.047(3) 10446.668(5) L L L L L L L L
Notes. All values are given in cm−1. All energies are relative to the appropriate v=0 vibrational level. a J is the quantum number corresponding to the total angular momentum. The values of the v=0 vibrational levels of A1Pu and B1Dg are 8271.607(7) cm−1 ( J = 1) and 11867.825(5) cm−1 ( J = 2), respectively. The rule J ∣W∣ for Hund’s case (a) coupling explains the lack of the J=0 states for A 1Pu and the J = 0, 1 states for B 1Dg .
incorrect results. Fourth, one must account for the strong multireference character of the electronic states and the near degeneracies changing rapidly along the CC distance. Fifth, rather large atom-centered, fixed-exponent Gaussian basis sets are required for the correct and converged description of the
valence states. These difficulties explain why this deceptively simple diatomic molecule is still one of the favorites of developers of modern wavefunction-based electronic structure 9
The Astrophysical Journal Supplement Series, 224:44 (15pp), 2016 June
Furtenbacher et al. Table 7 Excited Vibronic Levels for the Four Lowest-energy Triplet States of C2 with J=0 and F3 State
v
MARVELa
a 3Pu
1 2 3 4 5 7 8 9 10 11 1
1617.985(10) 3212.620(9) 4783.940(5) 6331.973(1) 7855.893(100) 10835.820(1) 12290.393(1) 13721.623(5) 15129.564(1) 16514.369(1) 1448.103(8)
2 3 1 2 3 5 6 7 1 2 3 4 5 6 7 8 9 10
2874.028(2) 4277.927(1) 2031.833(8) 4034.776(7) 6007.745(8) 9859.060(1) 11734.338(10) 13573.601(1) 1753.500(7) 3469.636(10) 5145.247(6) 6776.153(1) 8356.139(7) 9880.362(7) 11337.658(1) 12722.024(1) 14025.567(1) 15245.388(2)
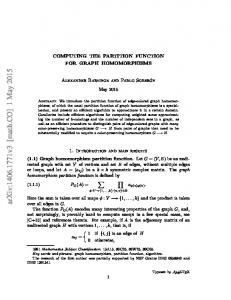
b 3S-g Figure 3. The MARVEL term values for the eight lowest-energy singlet and triplet states shown as a reduced-energy diagram, after subtraction of 1.81J (J + 1) cm−1 from the energy E of the state.
c 3S+ u
techniques (Watts & Bartlett 1992; Müller et al. 2001; Boschen et al. 2013). Using CI methods, 27 bound valence states of C2 were computed by Fougere & Nesbet (1966). Kirby & Liu (1979) obtained results for all 62 electronic states in the valence manifold, including weakly bound and repulsive ones. Pouilly et al. (1983) obtained results for Rydberg states, as well. Electronic states with Te values up to 75,000 cm−1 (this is in fact the F 1Pu state) have been studied, but for the present investigation the energy cut-off value was chosen to be 35,000 cm−1. This limits the number of singlet, triplet, and quintet states to 4, 4, and 1, respectively, 9 states altogether. None of the higher-lying states will be considered in what follows. Note that RKR potential curves are given for several singlet, triplet, and quintet states in Martin (1992). In this study, the so-called T0 values obtained for the electronic states define directly the lowest measurable term energies of the states (thus, they may not necessarily correspond to J = 0). It is not that simple to determine the Te values of the excited electronic states of C2, as these are not measurable quantities. This can only be achieved if the zero-point vibrational energy of all the states is determined. However, since all states are coupled in the DUO computations, these do not come directly from our joint MARVEL and DUO analysis. In particular, for the singlet Π and Δ electronic states there are no transitions to J=0 upper rovibronic states.
d 3Pg
Notes. All values are given in cm−1. Energies in each electronic state are relative to the appropriate v=0 (J = 0, F3) vibrational level. a The (v = 0, J = 0, F3) energy values are 632.730, 6250.149, 9280.834, and 3 20009.011 for the a 3Pu , b 3S-g , c 3S+ u , and d Pg states, respectively.
have full coverage of the energy levels required during the thermochemical analysis. This coverage is provided in this study by DUO energy levels (vide infra). Due to the strength of the CC bond in all the electronic states studied, the vibrational fundamental is substantial in almost all the bound electronic states of C2. In fact, for the ground electronic state the harmonic wavenumber is close to 2000 cm−1, a high value for a relatively heavy molecule. Thus, the number of vibrational states is not that high, despite the large dissociation energy. In particular, Boschen et al. (2013) computed 57, 54, 49, and 36 bound vibrational levels 1 1 1 + for the X 1S+ g , A Pu , B Dg , and B′ Sg states, respectively. The number of vibrational levels characterized by our MARVEL analysis is considerably smaller, only 9, 16, 8, and 3, respectively. The vibrational energies presented for the triplet electronic states given in Table 7 cannot be compared easily with existing literature values, since the MARVEL values are for a specific spin component of a rovibronic energy level. The largest “vibrational fundamental” ( J = 0) corresponding to the electronic states studied here is that of the c 3S+ u state, at 2031.833cm−1. Consequently, this state must have the strongest CC bond.
3.2. Vibrational Energy Levels Figure 3 shows all MARVEL term values below 35,000cm−1 for four singlet and four triplet states, where 1.81J (J + 1) cm−1 has been subtracted from the computed energies to make the figure clearer: this means that nearhorizontal sequences of levels for a particular electronic state are all associated with something one could call a single vibrational level. Figure 3 shows that the largest total angular momentum quantum numbers, Jmax , are 74, 75, 86, and 70 for 1 3 3 the X 1S+ g , A Pu , a Pu , and b Sg states, respectively. As expected, as the vibrational excitation increases, the Jmax value usually decreases. Finally, note that the coverage of rovibronic levels up to 35,000 cm−1 from experiment is not complete; assuming rigid rotation, data up to about J=144 are needed to 10
The Astrophysical Journal Supplement Series, 224:44 (15pp), 2016 June
Furtenbacher et al.
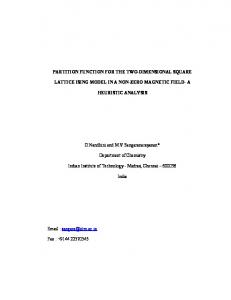
Figure 5. Sources of uncertainty in the internal partition function of 12C2 up to 4000 K. The solid (black) line shows the uncertainty that arises from the uncertainties of the known energy levels. The dashed (red) curve represents the convergence error, in percent, due to energy levels not included in the analysis.
Figure 4. Completeness of the rovibronic MARVEL energies as a function of the excitation energy.
3.3. Rovibrational Energy Levels The rotational constant of C2 for the X 1S+ g state is relatively small, about 1.81 cm−1. This results in a large number of rotational states for each vibrational level. As part of this study, DUO results were obtained up to J=144. They served to check whether a MARVEL energy level is viable or not and they were generated to help the thermochemical analysis of this study (vide infra). The lowest missing MARVEL energy level is at 7800 cm−1; up to this energy the coverage is complete. As Figure 4 shows, as the energy increases there are more and more experimentally unknown energy levels. The coverage drops below 10% at about 30,000 cm−1. It is interesting to note how close some of the rovibrational energy differences are to each other. Take the 3Pu state as an example. The v = 1 - v = 0 energy difference for J=0 is 1617.985 cm−1. The highly similar energy differences for the different spin components (J = 1, F = 2), (J = 1, F = 3), (J = 2, F = 1), (J = 2, F = 2), and (J = 2, F = 3), are 1618.063, 1617.941, 1617.985, 1617.902, and 1617.831, respectively. The reason behind this observation is that each spin component of each vibrational level of the a 3Pu state has a slightly different effective value for their rotational constant due to both electronic and vibrational effects, and these energy differences include rotational energies. The first-principles DUO energies, where such interactions are taken explicitly into account, result in similar energy differences.
using a mixture of experimental (MARVEL) and theoretical (DUO) energy levels. DUO provides the full set of energies for the nine electronic states considered during the determination of the ideal-gas thermochemistry of C2. While this is a complete set, the energy levels are of limited accuracy. Thus, whenever possible, the DUO energy levels are replaced by the incomplete but accurate set of MARVEL rovibronic energies. The final energies are used to compute the internal partition sum, its first (Q¢) and second (Q) moments, and the isobaric specific heat capacity (Cp ) as a function of temperature. Inaccuracies in Qint (T ) have three sources of origin. The first is the intrinsic uncertainty of the energy levels. The second is the lack of a complete set of bound rovibronic energy levels. The third is associated with the treatment, including the possible neglect, of the unbound states. The main source of uncertainty in Qint (T ) can be estimated straightforwardly using the uncertainty of each energy level and an error propagation formula. All experimental (MARVEL) energy levels have an associated uncertainty, while an uncertainty of 5.0 cm−1 was assumed for the uncertainties of all the DUO levels. (Note that this uncertainty estimate is rather pessimistic.) Figure 5 (solid line) shows the impact of the uncertainties of the energy levels on the uncertainty of Qint (T ). It can be seen that up to about 2500 K this type of uncertainty is dominant, but its maximum value, occurring at the lowest temperatures, is still less than 0.01%. Estimation of the second type of error is hard since (a) the exact number of the energy levels is unknown, and (b) the value of the partition function grows monotonically as more and more energy levels are considered in the direct sum. Therefore, only an approximate convergence can be reached at higher temperatures during the direct summation. To check the convergence of the partition function we need a larger set of energy levels; therefore, we computed approximate rovibronic energy levels for all the electronic states considered, using the spectroscopic constants published by Gurvich & Veyts (1990) up to 70,000 cm−1. Using the spectroscopic constants of 27 electronic states we could determine 332347 extra energy levels above 35,000 cm−1. Figure 5 (dashed line) shows the difference
4. THERMOCHEMICAL PROPERTIES OF C2 Altman (1960) and Clementi (1961) seem to be the first to address the thermochemical properties of the C2 molecule. They both based their analyses on spectroscopic constants available to them and included several, but not all necessary, electronic states in their study. More recent thermochemical studies include those by Irwin (1981), Sauval & Tatum (1984), and Rossi et al. (1985). The most reliable results appear to have been given by Gurvich & Veyts (1990). The internal partition function, Qint (T ), of C2 is computed here via the direct summation recipe (Vidler & Tennyson 2000) 11
The Astrophysical Journal Supplement Series, 224:44 (15pp), 2016 June
Furtenbacher et al.
Figure 6. The percentage differences of our partition function from Irwin (1981; solid, black) and from Sauval & Tatum (1984; dashed, red). Figure 7. Comparison of our Cp results with JANAF (Chase et al. 1985) (solid), Gurvich & Veyts (1990) (dashed), ESA (Capitelli et al. 2005) (dotted), and Altman (1960) & Clementi (1961) (dashed–dotted, see text) values.
(in percent) of the two data sets, (MARVEL + DUO) and (MARVEL + DUO + approximate energy levels). Although up to 2000 K the partition function is fully converged (the difference is less than 10−6%), above 2000 K the difference begins growing appreciably. Nevertheless, the maximum uncertainty is still less than 0.1% at 4000 K, which is acceptable for probably all practical applications. In the case of C2, no consideration of unbound states (Szidarovszky & Császár 2015) is necessary, due to the large dissociation energy of C2. The Q, Q¢, Q, and Cp results are given in Table 10 in 100 K intervals. The full set of results at 1 K increments is given in the machine readable version of the table in the electronic edition. Figure 6 shows the result of the comparison of our Qint (T ) with those of Irwin (1981) and Sauval & Tatum (1984). It can be seen that the earlier studies always yield smaller numbers for the partition function of C2 than the present study. A possible explanation is that we use a larger (more complete) set of energy levels. Note that the temperature range of the two earlier works begins from 1000 K. Figure 7 shows the difference between our Cp results and the JANAF (Chase et al. 1985), Gurvich & Veyts (1990), ESA (Capitelli et al. 2005), and Altman (1960) and Clementi (1961) data. Altman (1960) reported Cp values from 0 to 6000 K, but Clementi (1961) corrected his values above 2000 K. While there is good agreement with the ESA and Altman & Clementi data at low temperatures, the difference begins to increase with the temperature. Conversely, for Gurvich and JANAF, the differences, especially compared to those of Gurvich & Veyts, are surprisingly large at lower temperatures. Babou et al. (2009) also found this discrepancy concerning the Gurvich & Veyts (NASA) data at lower temperatures; nevertheless, they could not explain this strange behavior. We believe that the problem originates from the incorrect usage of Te values in Gurvich & Veyts (1990). The standard (spectroscopic) energy expansions use Te as a minimum-to-minimum excitation energy; in this case the rovibronic energy levels of the upper electronic state will be shifted by the difference of the zeropoint energies, by about 0.5 Dwe . To get the correct energies, the T0 values should be used instead of the Te values. The first excited electronic state usually lies above the ground state; therefore, this relatively small shift does not cause a significant
Table 8 Coefficients of the Fit (see Equation (3)), to the Internal Partition Function of 12C2 Coefficient a0 a1 a2 a3 a4 a5 a6
0–200 K
201–4000 K
3.6577362306 −7.0625294443 5.4057108902 −2.0744319852 0.4447612738 −0.0504276952 0.0023610646
186.8558092069 −139.9034556834 42.4445304374 −6.6283715970 0.5612382751 −0.0241572167 0.00040521942
problem if left out of consideration. However, in the case of C2, where the relative energy of the a 3Pu state is smaller than the vibrational fundamental of either state, the incorrect use of Te leads to wrong Cp values at lower temperatures. Table 8 gives coefficients of the least squares fit to our computed partition function using the traditional form of Vidler & Tennyson (2000) logQint =
6
å ai (logT )i .
(3)
i=0
In order to get the best reproduction of the directly computed values, the fit had to be performed in two separate temperature ranges. The first range is 0–200 K, the other is 201–4,000 K. These fits can reproduce the values of logQ reasonably accurately, within 0.1% in either region. Nevertheless, to take full advantage of the high accuracy of the present thermochemical reults for C2, the numerical results of the Supplementary Information should be used. This supplementary information also contains the transitions file that forms the input for MARVEL, and that can be augmented with any future spectroscopic data on C2 and rerun, and the associated energies file that is the output from the MARVEL run. 12
The Astrophysical Journal Supplement Series, 224:44 (15pp), 2016 June
Furtenbacher et al.
Table 9 Temperature-dependent Thermochemical Data for T/K 100.0 200.0 300.0 400.0 500.0 600.0 700.0 800.0 900.0 1000.0 1100.0 1200.0 1300.0 1400.0 1500.0 1600.0 1700.0 1800.0 1900.0 2000.0 2100.0 2200.0 2300.0 2400.0 2500.0 2600.0 2700.0 2800.0 2900.0 3000.0 3100.0 3200.0 3300.0 3400.0 3500.0 3600.0 3700.0 3800.0 3900.0 4000.0
12
C2
Qint (T )
¢ (T ) Qint
(T ) Qint
19.3786(1) 41.6629(1) 78.0529(1) 133.6964(1) 207.5463(1) 297.5930(1) 402.3796(1) 521.0433(1) 653.1204(1) 798.3910(1) 956.7878(1) 1128.3464(1) 1313.1770(1) 1511.4500(2) 1723.3857(2) 1949.2475(3) 2189.3369(4) 2443.9883(6) 2713.5652(8) 2998.4562(11) 3299.0714(15) 3615.8393(19) 3949.2042(24) 4299.6233(32) 4667.5647(49) 5053.5054(88) 5457.929(17) 5881.327(33) 6324.193(64) 6787.02(11) 7270.32(21) 7774.59(36) 8300.33(61) 8848.04(98) 9418.2(15) 10011.4(23) 10628.0(35) 11268.6(52) 11933.7(75) 12624(11)
19.3839(8) 55.1971(7) 137.7708(7) 260.3942(7) 411.2436(7) 585.6218(7) 782.8055(7) 1003.3874(7) 1248.2596(7) 1518.3519(7) 1814.6138(7) 2138.0495(7) 2489.7472(7) 2870.8933(7) 3282.7725(13) 3726.7596(19) 4204.3059(28) 4716.9251(38) 5266.1783(51) 5853.6614(65) 6480.9933(83) 7149.806(11) 7861.740(17) 8618.434(34) 9421.521(74) 10272.63(15) 11173.38(32) 12125.37(63) 13130.2(12) 14189.4(21) 15304.7(36) 16477.4(60) 17709.2(98) 19001(15) 20355(23) 21773(35) 23256(52) 24805(74) 26421(105) 28106(146)
40.242(8) 170.867(15) 453.195(28) 812.605(39) 1225.949(48) 1700.047(59) 2244.006(70) 2863.969(87) 3564.19(15) 4348.50(38) 5221.04(92) 6186.5(19) 7250.5(37) 8418.9(65) 9698(10) 11095(15) 12616(22) 14269(30) 16060(41) 17996(53) 20084(66) 22332(81) 24744(98) 27329(116) 30092(135) 33039(156) 36178(178) 39513(201) 43051(225) 46798(251) 50760(280) 54941(316) 59348(363) 63986(429) 68859(528) 73971(673) 79328(882) 84933(1172) 90789(1562) 96899(2076)
Cp (T )/JK−1mol−1 29.7333(2) 40.2915(2) 43.1578(2) 39.7816(2) 37.2546(2) 36.0862(2) 35.6865(2) 35.6538(2) 35.7888(2) 36.0006(2) 36.2499(2) 36.5204(3) 36.8053(5) 37.1015(7) 37.4068(10) 37.7195(14) 38.0375(17) 38.3585(21) 38.6803(25) 39.0006(29) 39.3173(33) 39.6285(36) 39.9326(40) 40.2281(43) 40.5139(50) 40.7893(63) 41.0535(92) 41.306(14) 41.546(23) 41.775(36) 41.991(56) 42.195(83) 42.38(12) 42.56(17) 42.73(23) 42.89(32) 43.03(42) 43.16(56) 43.28(71) 43.39(91)
Note. The uncertainties associated with the data are given in parentheses. (This table is available in its entirety in machine-readable form.)
5. SUMMARY
The recent observation of singlet–triplet intercombination bands by Chen et al. (2015) helped us to achieve linking all rovibronic levels of 12C2 into a single huge component within its experimental SN; thus, individual intercombination lines can now be predicted accurately using the results of our study. This is a significant step toward the astronomical detection of these transitions (Lebourlot & Roueff 1986). To further aid this work and other astronomical studies involving C2, a full rovibronic line list for 12C2 is currently being constructed using the variational code DUO by Yurchenko et al. (2016b), as part of the ExoMol project (Tennyson & Yurchenko 2012). As of now, the full set of MARVEL results comprising a file of validated transition frequencies and a file containing the resulting rovibronic energy levels is given in the supplementary information of this paper. The highly accurate but limited set of experimental (MARVEL) energy levels augmented with the much less accurate but much more complete set of DUO energy levels has been used to compute ideal-gas thermochemical
This study utilizes the MARVEL technique to accurately determine close to 6000 experimental rovibronic energies of 12 C2 for six singlet, six triplet, and two quintet electronic states, including the eight lowest valence states, which gives coverage up to 35,000 cm−1. We survey all available laboratory highresolution spectroscopic studies to provide input data for this process, resulting in 23,343 transitions connecting the 14 electronic states. While there are many spectroscopic studies available, 42 were analyzed to yield the transitions analyzed, and there has been significant recent activity, including the identification of several new band systems, there are also surprising gaps. For example, there is a detailed, fully rovibronically resolved study of the Deslandres–d’Azambuja (C 1Pg –A 1Pu ) band system for 13C2 (Antić-Jovanović et al. 1985), but even a century after the original observation of this band (Deslandres & d’Azambuja 1905) there is no available high-resolution study for 12C2. 13
The Astrophysical Journal Supplement Series, 224:44 (15pp), 2016 June
Furtenbacher et al.
12
functions for C2 up to 4000 K. The accuracy of the partition function is better than 0.1% even at the highest temperatures, considerably exceeding the accuracy of all previous studies. This assures that the accuracy of the present isobaric heat capacity of 12C2 is significantly better than that of any previous study.
Capitelli, M., Colonna, G., Giordano, D., et al. 2005, Tables of Internal Partition Functions and Thermodynamic Properties of High-Temperature Mars-Atmosphere Species from 50 K to 50000 K, Tech. Rep., ESA Scientific Technical Review (Noordwijk: ESA) Caubet, P., & Dorthe, G. 1994, CPL, 218, 529 Chan, M.-C., Yeung, S.-H., Wang, N., & Cheung, A. S.-C. 2013, JPCA, 117, 9578 Chan, M.-C., Yeung, S.-H., Wong, Y.-Y., et al. 2004, CPL, 390, 340 Chase, M. W., Davies, A. C., Downey, J. R., et al. 1995, JPCRD, 14, Suppl. Chauville, J., Maillard, J. P., & Mantz, A. W. 1977, JMoSp, 68, 399 Chen, W., Kawaguchi, K., Bernath, P. F., & Tang, J. 2015, JChPh, 142, 064317 Chen, W., Kawaguchi, K., Bernath, P. F., & Tang, J. 2016, JChPh, 144, 064301 Chen, X., & Mazumder, J. 1990, ApPhL, 57, 2178 Cisak, H., Dabrowska, K., & Rytel, M. 1969, AcPP, 36, 497 Clementi, E. 1961, ApJ, 133, 303 Császár, A. G., & Furtenbacher, T. 2011, JMoSp, 266, 99 Császár, A. G., Furtenbacher, T., & Árendás, P. 2016, JPCA, submitted Curtis, M., & Sarre, P. 1985, JMoSp, 114, 427 Davis, S. P., Abrams, M. C., Phillips, J. G., & Rao, M. L. P. 1988a, JOSAB, 5, 2280 Davis, S. P., Abrams, M. C., Sandalphon, Brault, J. W., & Rao, M. L. P. 1988b, JOSAB, 5, 1838 Davis, S. P., Phillips, J. G., Rao, M. L. P., & Abrams, M. C. 1988c, JOSAB, 5, 2280 Deslandres, H., & d’Azambuja, L. 1905, Comptes Rendus, 140, 917 Douay, M., Nietmann, R., & Bernath, P. F. 1988a, JMoSp, 131, 250 Douay, M., Nietmann, R., & Bernath, P. F. 1988b, JMoSp, 131, 261 Duxbury, G., Stamp, M. F., & Summers, H. P. 1998, PPCF, 40, 361 Erman, P., Larsson, M., Mannfors, B., & Lambert, D. L. 1982, ApJ, 253, 983 Fábri, C., Mátyus, E., Furtenbacher, T., et al. 2011, JChPh, 135, 094307 Fougere, P. F., & Nesbet, R. K. 1966, JChPh, 44, 285 Fox, J. G., & Herzberg, G. 1937, PhRv, 52, 638 Freymark, H. 1951, AnP, 8, 221 Furtenbacher, T., & Császár, A. G. 2012a, JQSRT, 113, 929 Furtenbacher, T., & Császár, A. G. 2012b, JMoSt, 1009, 123 Furtenbacher, T., Császár, A. G., & Tennyson, J. 2007, JMoSp, 245, 115 Furtenbacher, T., Szidarovszky, T., Fábri, C., & Császár, A. G. 2013a, PCCP, 15, 10181 Furtenbacher, T., Szidarovszky, T., Mátyus, E., Fábri, C., & Császár, A. G. 2013b, J. Chem. Theory Comput., 9, 5471 Goebel, J. H., Bregman, J. D., Cooper, D. M., et al. 1983, ApJ, 270, 190 Goldman, A., & Cheskis, S. 2008, ApPhB, 92, 281 Goodwin, P. M., & Cool, T. A. 1988a, JChPh, 88, 4548 (Erratum: Goodwin, P. M., 1989, JChPh 90, 1296) Goodwin, P. M., & Cool, T. A. 1988b, JChPh, 89, 6600 Goodwin, P. M., & Cool, T. A. 1989, JMoSp, 133, 230 Goorvitch, D. 1990, ApJS, 74, 769 Gredel, R., Black, J. H., & Yan, M. 2001, A&A, 375, 553 Gredel, R., van Dishoeck, E. F., & Black, J. H. 1989, ApJ, 338, 1047 Gurvich, L., & Veyts, I. 1990, Thermodynamic Properties Of Individual Substances: Elements and Compounds, Thermodynamic Properties of Individual Substances Series (London: Taylor and Francis) Hall, P. B., & Maxwell, A. J. 2008, ApJ, 678, 1292 Hardwick, J. L., & Winicur, D. H. 1986, JMoSp, 115, 175 Herzberg, G. 1946, PhRv, 70, 762 Herzberg, G., Lagerqvist, A., & Malmberg, C. 1969, CaJPh, 47, 2735 Herzberg, G., & Sutton, R. B. 1940, Can. J. Res., 18a, 74 Hobbs, L. M. 1979, ApJL, 232, L175 Hornbeck, G. A., & Herman, R. C. 1949, JChPh, 17, 842 Hornkohl, J. O., Nemes, L., & Parigger, C. 2011, in Spectroscopy, Dynamics and Molecular Theory of Carbon Plasmas and Vapors, ed. L. Nemes, & S. Irle (Singapore: World Scientific), 139 Huber, K. P., & Herzberg, G. 1979, Molecular Spectra and Molecular Structure IV. Constants of Diatomic Molecules (New York: Van Nostrand Reinhold Company) Hupe, R. C., Sheffer, Y., & Federman, S. R. 2012, ApJ, 761, 38 Iglesias-Groth, S. 2011, MNRAS, 411, 1857 Irwin, A. W. 1981, ApJS, 45, 621 Jackson, W. M., Bao, Y., & Urdahl, R. S. 1991, JGR, 96, 17569 Jiang, W., & Wilson, A. K. 2011, JChPh, 134, 034101 Joester, J. A., Nakajima, M., Reilly, N. J., et al. 2007, JChPh, 127, 214303 Kaminski, C. F., Hughes, I. G., & Ewart, P. 1997, JChPh, 106, 5324 Kaniki, J., Yang, X. H., Guo, Y. C., et al. 2003, PNSci, 13, 736 Kirby, K., & Liu, B. 1979, JChPh, 70, 893
We thank Robert Curl, John Hardwick, Michael Heaven, and Jian Tang for supplying the (unpublished) data from their spectroscopic experiments, and Tatiana Petrova and Peter Radi for comments on their data. Peter Radi is also thanked for his comments on the manuscript. This work has received support from the European Research Council under Advanced Investigator Project 267219, and the Scientific Research Fund of Hungary (grant OTKA NK83583). Collaboration of the UCL and ELTE groups has greatly benefited from the support of two COST actions, CoDECS (CM1002) and MOLIM (CM1405). Some funding was provided by the NASA Laboratory Astrophysics Program.
REFERENCES Abrams, M. L., & Sherrill, C. D. 2004, JChPh, 121, 9211 Al Derzi, A. R., Furtenbacher, T., Yurchenko, S. N., Tennyson, J., & Császár, A. G. 2015, JQSRT, 161, 117 Altman, R. L. 1960, JChPh, 32, 615 Amiot, C. 1983, ApJS, 52, 329 Amiot, C., Chauville, J., & Mailllard, J.-P. 1979, JMoSp, 75, 19 Angeli, C., Cimiraglia, R., & Pastore, M. 2012, MolPh, 110, 2963 Antić-Jovanović, A., Bojović, V., Pesić, D. S., et al. 1985, JMoSp, 110, 86 Asplund, M., Grevesse, N., Sauval, A. J., Prieto, C. A., & Blomme, R. 2005, A&A, 431, 693 Babou, Y., Riviere, P., Perrin, M.-Y., & Soufiani, A. 2009, IJT, 30, 416 Ballik, E. A., & Ramsay, D. A. 1958, JChPh, 29, 1418 Ballik, E. A., & Ramsay, D. A. 1959, JChPh, 31, 1128 Ballik, E. A., & Ramsay, D. A. 1963a, ApJ, 137, 61 Ballik, E. A., & Ramsay, D. A. 1963b, ApJ, 137, 84 Bao, Y., Urdahl, R. S., & Jackson, W. M. 1991, JChPh, 94, 808 Bauschlicher, C. W., & Langhoff, S. R. 1987, JChPh, 87, 2919 Bernath, P. F. 2016, Spectra of Atoms and Molecules (3rd ed.; Oxford: Oxford Univ. Press) Bleekrode, R., & Nieuwpoort, W. C. 1965, JChPh, 43, 3680 Blunt, V. M., Lin, H., Sorkhabi, O., & Jackson, W. M. 1995, JMoSp, 174, 274 Blunt, V. M., Lin, H., Sorkhabi, O., & Jackson, W. M. 1996, CPL, 257, 347 Boggio-Pasqua, M., Voronin, A., Halvick, P., & Rayez, J. 2000, JMoSt (THEOCHEM), 531, 159 Booth, G. H., Cleland, D., Thom, A. J. W., & Alavi, A. 2011, JChPh, 135, 084104 Bornhauser, P., Knopp, G., Gerber, T., & Radi, P. P. 2010, JMoSp, 262, 69 Bornhauser, P., Marquardt, R., Gourlaouen, C., et al. 2015, JChPh, 142, 094313 Bornhauser, P., Sych, Y., Knopp, G., Gerber, T., & Radi, P. P. 2011, JChPh, 134, 044302 Bornhauser, P., Sych, Y., Knopp, G., Gerber, T., & Radi, P. P. 2013, CPL, 572, 16 Boschen, J. S., Theis, D., Ruedenberg, K., & Windus, T. L. 2013, Theor. Chem. Acc., 133, 1425 Boschen, J. S., Theis, D., Ruedenberg, K., & Windus, T. L. 2014, Theor. Chem. Acc., 133, 1425 Brault, J. W., Delbouille, L., Grevesse, N., et al. 1982, A&A, 108, 201 Brewer, L., & Hagan, L. 1979, HTemS, 11, 233 Brockhinke, A., Hartlieb, A. T., Kohse-Hoinghaus, K., & Crosley, D. R. 1998, ApPhB, 67, 659 Brooke, J. S., Bernath, P. F., Schmidt, T. W., & Bacskay, G. B. 2013, JQSRT, 124, 11 Brown, J., & Carrington, A. 2003, Rotational Spectroscopy of Diatomic Molecules (Cambridge: Cambridge Univ. Press) Bruna, P., & Grein, F. 2001, CaJPh, 79, 653 Bruna, P. J., & Wright, J. S. 1992, JPhCh, 96, 1630 Callomon, J. H., & Gilby, A. C. 1963, CaJPh, 41, 995
14
The Astrophysical Journal Supplement Series, 224:44 (15pp), 2016 June
Furtenbacher et al.
Kokkin, D. L., Bacskay, G. B., & Schmidt, T. W. 2007, JChPh, 126, 084302 Kokkin, D. L., Reilly, N. J., Morris, C. W., et al. 2006, JChPh, 125, 231101 Kowalski, P. M. 2010, A&A, 519, L8 Krechkivska, O., Bacskay, G. B., Troy, T. P., et al. 2015, JPCA, 119, 12102 Krechkivska, O., Bacskay, G. B., Welsh, B. A., et al. 2016, JChPh, 144, 144305 Lambert, D. L. 1978, MNRAS, 182, 249 Lambert, D. L., Sheffer, Y., Danks, A. C., Arpigny, C., & Magain, P. 1990, ApJ, 353, 640 Lambert, D. L., Sheffer, Y., & Federman, S. R. 1995, ApJ, 438, 740 Landsverk, O. G. 1939, PhRv, 56, 769 Lebourlot, J., & Roueff, E. 1986, JMoSp, 120, 157 Lefebvre-Brion, H., & Field, R. W. 2004, The Spectra and Dynamics of Diatomic Molecules (Amsterdam: Elsevier) Lien, D. J. 1984, ApJL, 287, L95 Little, C. E., & Browne, P. G. 1987, CPL, 134, 560 Lloyd, G. M., & Ewart, P. 1999, JChPh, 110, 385 Martin, M. 1992, J. Photochem. Photobio. A: Chem., 66, 263 Mayer, P., & O’Dell, C. R. 1968, ApJ, 153, 951 Meinel, H., & Messerle, G. 1968, ApJ, 154, 381 Messerle, G., & Krauss, L. 1967, ZNatA, A 22, 2015 Müller, T., Dallos, M., Lischka, H., Dubrovay, Z., & Szalay, P. G. 2001, Theor. Chem. Acc., 105, 227 Mulliken, R. S. 1939, PhRv, 56, 778 Nakajima, M., & Endo, Y. 2013, JChPh, 139, 244310 Nakajima, M., & Endo, Y. 2014, JMoSp, 302, 9 Nakajima, M., Joester, J. A., Page, N. I., et al. 2009, JChPh, 131, 044301 Petrova, T., & Sinitsa, L. 2006, OptSp, 101, 871 Phillips, J. G. 1948a, ApJ, 107, 387 Phillips, J. G. 1948b, ApJ, 110, 73 Phillips, J. G. 1968, JMoSp, 28, 233 Phillips, J. G., & Davis, S. P. 1968, The Swan System of the C2 Molecule (Berkeley and Los Angeles: Univ. California) Pouilly, B., Robbe, J. M., Schamps, J., & Roueff, E. 1983, JPhB, 16, 437 Prasad, C. V. V., & Bernath, P. F. 1994, ApJ, 426, 812 Raffety, C. W. 1916, PMag, 32, 546 Rao, N. K., & Lambert, D. L. 2008, MNRAS, 384, 477 Rossi, S. C. F., Maciel, W. J., & Benevides-Soares, P. 1985, A&A, 148, 93 Rousselot, P., Laffont, C., Moreels, G., & Clairemidi, J. 1998, A&A, 335, 765 Rousselot, R., Hill, S. M., Burger, M. H., et al. 2000, Icar, 146, 263 Roux, F., Wannous, G., Michaud, F., & Verges, J. 1985, JMoSp, 109, 334 Sauval, A. J., & Tatum, J. B. 1984, ApJS, 56, 193 Schmidt, T. W., & Bacskay, G. B. 2011, JChPh, 134, 224311
Sherrill, C., & Piecuch, P. 2005a, JChPh, 122, 124104 Sherrill, C. D., & Piecuch, P. 2005b, JChPh, 122, 124104 Smith, G. P., Park, C., Schneiderman, J., & Luque, J. 2005, CoFl, 141, 66 Sonnentrucker, P., Welty, D. E., Thorburn, J. A., & York, D. G. 2007, ApJS, 168, 58 Sorkhabi, O., Blunt, V. M., Lin, H., et al. 1997, JChPh, 107, 9842 Souza, S. P., & Lutz, B. L. 1977, ApJL, 216, L49 Su, P., Wu, J., Gu, J., et al. 2011, J. Chem. Theory Comput., 7, 121 Suzuki, T., Saito, S., & Hirota, E. 1985, JMoSp, 113, 399 Swan, W. 1857, RSET, 21, 411 Swings, P. 1943, MNRAS, 103, 86 Szidarovszky, T., & Császár, A. G. 2015, JChPh, 142, 014103 Tanabashi, A., & Amano, T. 2002, JMoSp, 215, 285 Tanabashi, A., Hirao, T., Amano, T., & Bernath, P. F. 2007, ApJS, 169, 472 (Erratum: 2007 ApJS 170 261) Tennyson, J., Bernath, P. F., Brown, L. R., et al. 2009, JQSRT, 110, 573 Tennyson, J., Bernath, P. F., Brown, L. R., et al. 2010, JQSRT, 111, 2160 Tennyson, J., Bernath, P. F., Brown, L. R., et al. 2013, JQSRT, 117, 29 Tennyson, J., Bernath, P. F., Brown, L. R., et al. 2014a, Pure Appl. Chem., 86, 71 Tennyson, J., Bernath, P. F., Brown, L. R., et al. 2014b, JQSRT, 142, 93 Tennyson, J., & Yurchenko, S. N. 2012, MNRAS, 425, 21 Urdahl, R. S., Bao, Y., & Jackson, W. M. 1988, CPL, 152, 485 van de Burgt, L. J., & Heaven, M. C. 1987, JChPh, 87, 4235 Van Orden, A., & Saykally, R. 1998, ChRv, 98, 2313 Vartya, M. S. 1970, ARA&A, 8, 87 Veseth, L. 1975, CaJPh, 53, 299 Vidler, M., & Tennyson, J. 2000, JChPh, 113, 9766 Watts, J. D., & Bartlett, R. J. 1992, JChPh, 96, 6073 Wehres, N., Romanzin, C., Linnartz, H., Van Winckel, H., & Tielens, A. G. G. M. 2010, A&A, 518, A36 Weltner, W., & Van Zee, R. J. 1989, ChRv, 89, 1713 Whiting, E. E. 1973, Computer Program for Determining Rotational Line Intensity Factors for Diatomic Molecules (Washington, DC: National Aeronautics and Space Administration) Wodtke, A. M., & Lee, Y. T. 1985, JPhCh, 89, 4744 Wollaston, W. H. 1802, RSPTA, 92, 365 Yan, W.-B., Curl, R., Merer, A. J., & Carrick, P. G. 1985, JMoSp, 112, 436 Yeung, S.-H., Chan, M.-C., Wang, N., & Cheung, A. S.-C. 2013, CPL, 557, 31 Yurchenko, S. N., Lodi, L., Tennyson, J., & Stolyarov, A. V. 2016a, CoPhC, 202, 262 Yurchenko, S. N., Tennyson, J., et al. 2016b, MNRAS, submitted
15