Experimental Evaluation of TCP Performance and Fairness in an 802.11e Test-bed Anthony C.H. Ng,
David Malone,
Douglas J. Leith
Hamilton Institute NUI Maynooth, Ireland
Hamilton Institute NUI Maynooth, Ireland
Hamilton Institute NUI Maynooth, Ireland
[email protected]
[email protected]
[email protected]
ABSTRACT
We have constructed an 802.11e hardware testbed network and in this paper our aim is make use of this testbed to perform experimental measurement and validation of 802.11e operation. As a first step, in this paper we seek to compare our expectations (from theory and simulation) with the behaviour of an actual 802.11e implementation. This allows us to identify the limitations of such predictions. There is an extensive literature containing simulation [3, 4] and analytic [5, 6] studies/comparisons of the 802.11 and 802.11e MAC mechanisms. A number of experimental studies, albeit in the context of 802.11 rather than 802.11e, also suggest that there may exist some gap between theoretical predictions and practical performance [7, 8]. In this paper we also build upon this validation work to explore how the flexibility provided by the 802.11e protocol can be exploited to mitigate damaging cross-layer interactions between the MAC and transport layers. The paper is organised as follows. Section 2 describes the setup of our testbed and in Section 3 we discuss some of the practical issues encountered during our measurements. Section 4 presents a basic validation of the TXOP, AIFS and CWmin adjustable 802.11e parameters using the testbed. This subset of parameters, also known as WME (Wireless Multimedia Extensions), includes the maximum duration that a station can transmit without contending for access (TXOP); the initial value of the contention window (CWmin); and how long the medium must be sensed idle before the counter may be decremented (AIFS). Finally, in Section 5, we carry out a case study of some known problems with TCP’s performance that is caused by cross-layer interaction between the transport layer congestion control action and the 802.11 MAC layer contention mechanism. We demonstrate that the 802.11e parameters can be used to significantly improve TCP performance.
In this paper we present measurements made using an 802.11e wireless testbed. We demonstrate experimentally how the new 802.11e [1] QoS parameters behave in our testbed. We describe the testing methodology used to validate the operation of the 802.11e TXOP, AIFS and CWmin parameters and compare the experimental results to existing analytical models. We also discuss a number of practical issues encountered during our measurements. We then use the testbed to demonstrate some known problems with TCP’s performance caused by cross-layer interaction between the TCP congestion control algorithm and the MAC layer CSMA/CA contention mechanism. Finally, we study how these problems can be mitigated using the flexibility provided by the 802.11e parameters via the scheme suggested in [2].
Categories and Subject Descriptors C.2.2 [Network Protocols]: Protocol verification; C.2.5 [Local and Wide-Area Networks]: TCP/IP
General Terms Measurement, Performance, Experimentation
Keywords 802.11, 802.11e, test-bed, TCP, fairness.
1.
INTRODUCTION
The new 802.11e MAC protocol [1] extends the standard 802.11 CSMA/CA contention mechanism by allowing the adjustment of MAC parameters that were previously fixed. While the 802.11e protocol has been extensively studied in the literature, this work is almost entirely confined to analytical and simulation studies. Owing to the lack of available hardware, there have been very few experimental studies evaluating the performance of the new 802.11e protocol. Hardware is, however, now available which allows us to investigate 802.11e operation in a real testing environment.
2. WIRELESS TESTBED CONFIGURATION The 802.11e wireless testbed is configured in infrastructure mode. It consists of a desktop PC acting as an access point (AP), and 12 PC-based embedded Linux boxes based on the Soekris net4801 [9] acting as client stations. All systems are equipped with an Atheros 802.11b/g PCI card with an external antenna. The system hardware configuration is summarised in Table 1. All nodes, including the AP, use a Linux 2.6.8.1 kernel and a version of the MADWiFi [10] wireless driver modified to allow us to adjust the 802.11e CWmin, AIFS and TXOP parameters. All of the systems are also equipped with a 100Mbps wired Ethernet
Permission to make digital or hard copies of all or part of this work for personal or classroom use is granted without fee provided that copies are not made or distributed for profit or commercial advantage and that copies bear this notice and the full citation on the first page. To copy otherwise, to republish, to post on servers or to redistribute to lists, requires prior specific permission and/or a fee. SIGCOMM’05 Workshops, August 22–26, 2005, Philadelphia, PA, USA. Copyright 2005 ACM 1-59593-026-4/05/0008 ...$5.00.
17
11 STAs Upload To AP UDP
Dell GX 280 Soekris net4801 D-Link DWL-G520 default 64KB 199 packets 200 packets
2.8Ghz P4 266Mhz 586 Atheros AR5212 used 1MB 10 packets 10 packets
700
600
500 Throughput(kbits/sec)
Hardware 1× AP 12× node WLAN Buffers TCP interface tx driver tx
Table 1: Testbed Summary
400
300
200
100
port, which is used for control of the testbed from a PC. Specific vendor features on the wireless card, such as turbo mode, are disabled. All of the tests are performed using the 802.11b physical maximal transmission rate of 11Mbps with RTS/CTS disabled and the channel number explicitly set. Since the wireless stations are based on low power embedded systems, we have tested these wireless nodes to confirm that the hardware performance (especially the CPU) is not a bottleneck for wireless transmissions at the 11Mbps PHY rate used. The configuration of the various network buffers is also detailed in Table 1. In particular, we have increased the size of the TCP buffers to ensure that we see true AIMD behaviour (with small TCP buffers TCP congestion control is effectively disabled as the TCP congestion window is determined by the buffer size rather than the network capacity). We have also carried out tests investigating the impact of the size of interface and driver queues and obtain similar results for a range of settings. Several software tools are used within the testbed to generate network traffic and collect performance measurements. To generate wireless network traffic and to measure throughput we use mgen[11] and iperf[12] for UDP and TCP respectively. While many different network monitoring programs and wireless sniffers exist, no single tool provides all of the functionality required and so we have used a number of common tools including tcpdump[13]. Network management and control of traffic sources is carried out using ssh over the wired network.
3.
0
1
2
3
4
5
6 STA id
7
8
9
10
11
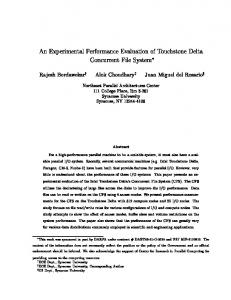
Figure 1: Performance of 11 UDP uploads. Note that station 11 is at a slight advantage. 11 STAs Upload To AP
Throughput(kbits/sec)
1500
1000
500
0
1
2
3
4
5
6 STA id
7
8
9
10
11
Figure 2: Performance of 11 TCP uploads. TCP’s congestion control magnifies station 11’s advantage.
WIRELESS MEASUREMENT the MAC layer contention mechanism. UDP traffic is inelastic and therefore does not suffer from the cross-layer interaction evident with TCP traffic, so we use UDP for calibration. For testing purposes we use parallel UDP uploads, from the wireless stations to the AP, lasting 5 minutes. We repeat each test 4 times and between each test we fine tune the throughput of each station by manually adjusting the position. Because of the varying nature of the wireless environment, we have found that it is extremely difficult to ensure that all stations achieve identical throughputs. Our adjustments do, however, ensure that the average throughput over multiple tests are within about 10% for all stations. In this context, it is interesting to note that even changes of a few centimetres in a stations position can result in up to a 30% change in the throughput performance. Moreover, based on our experience, the variation in throughput for a particular node can be as much as 15–20% from run to run. Tests which run over 60s show similar variation to 5-minute tests. However, tests with duration below 30s show a larger variation. This gives an indication of the variation that we can expect in later results.
It is well known that the performance of wireless communication links is dependent on many factors including the specific location and orientation of each device as this influences the radio environment [7]. Before proceeding further, we therefore took care to adjust the physical layout of the wireless stations to ensure that under baseline conditions all of the wireless stations experience a comparable radio environment. We note that the calibration of the throughput for each competing station is particularly important, as we observe that unfairness may be magnified by cross-layer effects. For example, consider a network where one station has a slight advantage. The UDP upload performance of each station in such a network is shown in Figure 1. Repeated experiments show that the there exists random fluctuations in performance between each station except station 11, which consistently performs better. When TCP rather than UDP traffic is now used, station 11’s throughput is significantly greater than that of the other station’s, see Figure 2. As discussed later, this arises due to cross-layer interactions between the transport layer congestion control algorithm and
18
We have analysed these variations by graphing throughput against time. Occasionally, a stations throughput fluctuates greatly during a test, while the average throughput over the test remains relatively unaffected. The root cause of these fluctuations is not clear at present. However, by reviewing the throughput trace of a test we may identify any measurements with unusually high variations. This also indicates that aggregate throughput alone may not be the best performance indicator.
4.
Relative Throughput against TXOP parameter 5.5 5
Relative Throughput
4.5
VALIDATION OF TXOP, AIFS AND CWMIN
The 802.11 standard specifies a CSMA/CA mechanism to regulate transmissions. Briefly, on detecting the wireless medium to be idle for a period DIFS, each station initializes a counter to a random number selected uniformly from the interval [0,CW-1]. Time is slotted and this counter is decremented each slot that the medium is idle. An important feature is that the countdown halts when the medium becomes busy and only resumes after the medium is idle again for a period DIFS. On the counter reaching zero, the station transmits a packet. If a collision occurs (two or more stations transmit simultaneously), CW is doubled and the process repeated. On a successful transmission, CW is reset to the value CWmin and a new countdown starts for the next packet. The new 802.11e MAC enables the values of DIFS (called AIFS in 802.11e) and CWmin to be set on a per class basis for each station i.e. traffic is directed to up to four different queues at each station, with each queue assigned different MAC parameter values. The TXOP parameter in 802.11e also specifies the time that a station can spend transmitting on the medium once it wins a transmission opportunity. A station uses its TXOP by transmitting packets more closely together than permitted in 802.11b, such that other stations will not have resumed decrementing their backoff counter after the end of the previous transmission. Hence, provided the value of TXOP is sufficiently large, multiple packets may be transmitted by a station at each transmission opportunity. In this section we study the impact of the 802.11e AIFS, CWmin and TXOP parameters on the throughput performance. We consider two stations competing to transmit 1400 byte (similar results are obtained for other packet sizes) UDP packets at a rate sufficient to saturate the medium, i.e. such that the transmit queue at each station is permanently backlogged and thus each station always has a packet to send when it wins a transmission opportunity. We consider the stations’ relative throughputs, measured by observing successful packet arrivals at the AP. Naturally, when the stations have the same parameters we expect a throughput ratio of one. The effect of TXOP seems relatively easy to understand: it should increase the relative throughput for stations with larger TXOP values as they can transmit more data for each transmission opportunity they win. TXOP is specified in units of time (microseconds in the MadWiFi driver), and the increase in throughput will be quantised by packet size. Figure 3 shows the relative throughput achieved by two competing stations when TXOP is fixed at the default value of one packet for the first station while the TXOP value of the second station is gradually increased. We can see that the relative throughput increases, as expected, with steps at multiples of the transmission duration for single packet. In this case each step is separated by around 1270us, the
4 3.5 3 2.5 2 1.5 1
0
1000
2000
3000 4000 TXOP in unit of us
5000
6000
7000
Figure 3: TXOP’s impact on the relative throughput of two stations.
time required to transmit a 1400 UDP byte packet with an 11Mbs PHY. The effect on performance of the AIFS parameter is much more complex than that of TXOP. AIFS is the duration that the medium must be idle after a transmission before a station can resume its backoff countdown. In 802.11b this parameter is called DIFS and is fixed at 50 microseconds, but 802.11e allows this value to be increased by multiples of the 802.11 slot length. To understand the influence of the AIFS parameter recall that the MAC countdown halts when the wireless medium becomes busy and resumes after the medium is idle again for a period AIFS. In addition to the initial delay of AIFS before countdown starts, a station accumulates an additional delay for every packet sent on the medium by other stations, leading to a reduction in the number of transmission opportunities that can be gained by a station as AIFS is increased. This effect is, however, load dependent. When the network is lightly loaded, we expect that AIFS differences have little impact on throughput. However, as the network load increases, stations with longer AIFS will rapidly become penalised. Under saturated conditions, existing analytic models[6] predict that the throughput share of a stations falls exponentially as AIFS is increased. We measured the impact of AIFS on the throughputs of two stations with saturated traffic and our results are shown in Figure 4. Here, the AIFS value of one station is held fixed at the default value of zero slots while the AIFS value of the second station is gradually increased. It can be seen that AIFS has a strong impact on the relative throughput. Also shown on this graph are the predictions of the analytic model of Battiti and Li [6]. We can see that there is good agreement between this model for AIFS values ≤ 10 but that the model becomes inaccurate for larger values of AIFS. This discrepancy is attributed to the Markov chain used to model the station with the longer AIFS period not being a good approximation as the degree of prioritisation becomes very high. The impact on throughput of the CWmin parameter is relatively straightforward. We expect the throughput of a station to be roughly inversely proportional to its CWmin value, as a smaller CWmin means a smaller delay between transmissions. This intuition is confirmed by analytic mod-
19
efficient and reasonably fair sharing of wireless capacity between competing data flows. Unfortunately, cross-layer interactions between the 802.11 MAC and the flow/congestion control mechanisms employed by TCP typically lead to gross unfairness between competing flows, and indeed sustained lockout of flows. While the literature relating to WLAN fairness at the MAC layer is extensive, this issue of transport layer TCP fairness has received far less attention. Early work by Balakrishnan and Padmanabhan [14] studies the impact of path asymmetries in both wired and wireless networks, while more recently Detti et al.[15] and Pilosof et al.[16] have specifically considered TCP unfairness issues in 802.11 infrastructure WLANs and Wu et al. [17] study TCP in the context of single-hop 802.11 ad hoc WLAN’s. With the exception of [17], all of these authors seek to work within the constraints of the basic 802.11 MAC and thus focus solely on approaches that avoid changes at the MAC layer. However, as noted in [2], the roots of the problem lie in the MAC layer enforcement of per station fairness. Hence, it seems most natural to seek to resolve this issue at the MAC layer itself. Here we follow an approach similar to that proposed in [2], although that work is confined to analytic modelling and simulation testing. The scheme proposed uses simple settings of the 802.11e parameters, which should be suitable across a wide range of situations. In order to address TCP’s performance problems, two problems must be solved: asymmetry between the TCP data and TCP ACK paths that disrupts the TCP congestion control mechanism, and network level asymmetry between TCP upload and download flows.
Relative Throughput against AIFS parameter 30 Analytical Model Experimental Results
Relative Throughput
25
20
15
10
5
0
0
5
10 15 AIFS in unit of 20us timeslot
20
25
Figure 4: AIFS’s impact on the relative throughout of two stations. Relative Throughput against CWmin 20 18
Analytical Model Experimental Results
16
Relative Throughput
14 12 10 8 6 4
5.1 TCP Performance Issues
2 0 −3
−2 −1 0 1 2 3 CWmin Shift (0 corresponds to the default CWmin 32)
The first issue is that TCP implicitly assumes sufficient reverse path bandwidth to carry its ACK traffic. Asymmetry in the forward and reverse path packet transmission rate that leads to significant queueing and dropping of TCP ACKs can disrupt the TCP ACK clocking mechanism, hinder congestion window growth and induce repeated timeouts. With regard to the latter, a timeout is invoked at a TCP sender when no progress is detected in the arrival of data packets at the destination. This may be due to data packet loss (no data packets arrive at the destination), TCP ACK packet loss (safe receipt of data packets is not reported back to the sender), or both. TCP flows with only a small number of packets in flight (e.g. flows which have recently started or which are recovering from a timeout) are much more susceptible to timeouts than flows with large numbers of packets in flight since the loss of a small number of data or ACK packets is then sufficient to induce a timeout. Hence, when ACK losses are frequent a situation can easily occur where a newly started TCP flow loses the ACK packets associated with its first few data transmissions, inducing a timeout. The ACK packets associated with the data packets retransmitted following the timeout can also be lost, leading to further timeouts (with associated doubling of the retransmit timer) and so creating a persistent situation where the flow is completely starved for long periods. During TCP uploads, the wireless stations queue data packets to be sent over the wireless channel to their destination and the returning TCP ACK packets are queued at the AP to be sent back to the source station. The basic 802.11 MAC layer, however, enforces station-level fair ac-
4
Figure 5: CWmin’s impact on the relative throughput of two stations.
els[6]. The tuning of the CWmin parameter in the 802.11e standard is quite coarse: the parameter is constrained to be a power of two. Figure 5 plots measurements of relative throughput for two stations. The CWmin value of one station is held constant at the default value of 32 while the CWmin value of the second station is varied in powers of two. Also shown are analytic predictions using the model in [6]. It can be seen that the measurements are in good agreement with the analytic model and the overall impact of CWmin is in line with our expectations.
5.
TCP PERFORMANCE
Existing work on 802.11e tuning algorithms is largely informed by the quality of service requirements of newer applications such as VoIP. However, current network traffic continues to be dominated by data traffic (web, email, media downloads, etc.), which is largely carried by TCP. Although lacking the time critical aspect of voice traffic, data traffic server-client applications do place quality of service demands on the wireless channel. In particular, within the context of infrastructure WLANs, there is a requirement for
20
6 Uploads and 6 Downloads for 180 sec 1200
1000
1000
800
800
Throughput(kbits/sec)
Throughput(kbits/sec)
12 TCP Uploads to AP for 180 sec 1200
600
400
0
1
2
3
4
5
6
7 8 STA id
9
10
11
12
1
2
3
4
5
6
7 8 STA id
9
10
11
12
Figure 7: Performance of 6 TCP uploads (1–6) and 6 TCP (7–12) downloads with 802.11b parameters.
Figure 6: Performance of 12 TCP uploads with default 802.11b parameters. cess to the wireless channel. That is, n stations competing for access to the wireless channel are each able to secure approximately a 1/n share of the total available transmission opportunities. Hence, if we have n wireless stations and one AP, each station (including the AP) is able to gain only a 1/(n + 1) share of transmission opportunities. By allocating an equal share of packet transmissions to each wireless station, with TCP uploads the 802.11 MAC allows n/(n + 1) of transmissions to be TCP data packets yet only 1/(n+1) (the AP’s share of medium access) to be TCP ACK packets. For larger numbers of stations, n, this MAC layer action leads to substantial forward/reverse path asymmetry at the transport layer and associated poor performance, see Figure 6. We have observed that significant unfairness develops quite quickly: even three competing upload flows are sufficient to degrade performance. Symmetry can be restored by configuring the AP such that TCP ACKs effectively have unrestricted access to the wireless medium while the other stations divide the channel capacity not used by the AP fairly amongst themselves as per the standard 802.11 mechanism. Rather than allowing unrestricted access to all traffic sent by the AP, recall that in 802.11e the MAC parameter settings are made on a per class basis. Hence, we collect TCP ACKs into a single class (i.e. queue them together in a separate queue at the AP) and confine prioritisation to this class1 . The rationale for this approach to differentiating the AP makes use of the transport layer behaviour. Namely, allowing TCP ACKs unrestricted access to the wireless channel does not lead to the channel being flooded. Instead, it ensures that the volume of TCP ACKs is regulated by the transport layer rather than the MAC layer. In this way the volume of TCP ACKs will be matched to the volume of TCP data packets, thereby restoring forward/reverse path symmetry at the transport layer. When the wireless hop is the bottleneck, data packets will be queued at wireless stations for transmission and packet drops will occur there, while TCP ACKs will pass freely with minimal queueing i.e. the standard TCP semantics are recovered. The second TCP performance issue, namely asymmetry 1
400
200
200
0
600
AP wireless station
Upload ACKs Download data Download ACKs Upload data
AIFS (slots) 0 4 0 4
CWmin 4 32 32 32
TXOP (packets) 1 nd 1 1
Table 2: TCP 802.11e MAC parameters. between TCP upload and download flows is closely related to the above. All download data packets are transmitted by the AP. Hence, regardless of the number of TCP download flows, download throughput is constrained by the ability of the AP to win transmission opportunities. Considering now a mix of competing upload and download TCP flows, suppose we have nu upload flows and nd download flows. The download flows (regardless of the number nd of download flows) gain transmission opportunities at the roughly same rate as a single TCP upload flow. That is, roughly 1/(nu + 1) of the channel bandwidth is allocated to the download flows and nu /(nu + 1) allocated to the uploads. As the number nu of upload flows increases, gross unfairness between uploads and downloads can result. The upload/download fairness issue is clearly demonstrated in Figure 7. Here 6 TCP uploads (stations 1–6) compete with 6 TCP downloads (stations 7– 12) on a standard 802.11 network. There is unfairness both between uploads and downloads and within the uploads.
5.2 Restored Fairness with 802.11e Following the above discussion and [2], we consider the 802.11e network parameter settings shown in Table 2. It can be seen that TCP ACKs are prioritised at both the AP and the wireless stations. To restore fairness between TCP uploads and downloads, TCP data packets at the AP are prioritised by setting TXOP on the AP to allow the transmission of nd data packets at each transmission opportunity. The impact on fairness between competing TCP upload flows of prioritising TCP ACKs is shown in Figure 8. It can be seen that fairness is restored (to within the intrinsic 10– 15% intra-test variation noted previously). Figure 9 shows the corresponding measured performance with a mixture of TCP uploads and downloads. It can be seen that fairness is
In our tests packet classification is based on packet size.
21
Our testbed experimentation has also highlighted that physical factors, such as antennas and node placement, have a significant impact on performance. While this is itself not unexpected, the sensitivity to very small changes in position and orientation was felt to be surprising. While this might be due to antenna issues, power levels and detection thresholds might also play a role and an investigation of this is the subject of ongoing work.
12 TCP Uploads to AP for 180 sec 600
Throughput(kbits/sec)
500
400
300
200
7. ACKNOWLEDGEMENTS This work was supported by Science Foundation Ireland grant 03/IN3/I396.
100
0
1
2
3
4
5
6
7 8 STA id
9
10
11
8. REFERENCES
12
[1] IEEE P802.11E/D9.0 Draft Standard, August 2004. [2] D.J. Leith, P. Clifford, “Using the 802.11e EDCF to Achieve TCP Upload Fairness over WLAN Links”, WiOpt, April 2005. [3] Q. Ni, “ns-802.11e EDCF for IEEE 802.11e Wireless LAN”, http://www-sop.inria.fr/planete/qni/, November 2002. [4] S. Wieth¨ olter and C. Hoene, “Design and verification of an IEEE 802.11e EDCF simulation model in ns-2.26,” Technische Universit¨ at Berlin, Tech. Rep. TKN-03-019, November 2003. [5] G. Bianchi, “Performance analysis of IEEE 802.11 distributed coordination function,” IEEE Journal on Selected Areas in Communications, vol. 18, no. 3, pp. 535–547, March 2000. [6] R. Battiti, B. Li, “Supporting service differentiation with enhancements of the IEEE 802.11 MAC protocol: models and analysis”, Technical Report DIT-03-024, University of Trento, May 2003. [7] E. Pelletta, H. Velayos, “Performance measurements of the saturation throughput in IEEE 802.11 access points”, WiOpt, April 2005. [8] M. Franceschinis, M. Mellia, M. Meo, M. Munafo, “Measuring TCP over WiFi: A Real Case”, WiNMee 2005, April 2005. [9] Soekris Engineering, http://www.soekris.com/. [10] Multiband Atheros Driver for WiFi(MADWiFi), http://sourceforge.net/projects/madwifi/, October 2004 version. [11] MGEN, The Multi-Generator Toolset, http://mgen.pf.itd.nrl.navy.mil/. [12] Iperf — The TCP/UDP Bandwidth Measurement Tool, http://dast.nlanr.net/Projects/Iperf/. [13] tcpdump, http://www.tcpdump.org/. [14] H. Balakrishnan, V. Padmanabhan, “How Network Asymmetry Affects TCP”, IEEE Communications Magazine, April 2001, pp60–67. [15] A. Detti, E. Graziosi, V. Minichiello, S. Salsano and V. Sangregorio, “TCP fairness issues in IEEE 802.11 based access networks”, submitted paper. [16] S. Pilosof, R. Ramjee, Y. Shavitt, P. Sinha, “Understanding TCP fairness over Wireless LAN”, INFOCOM 2003, 1–3 April 2003. [17] H. Wu, Y. Peng, K. Long, S. Cheng, J. Ma, “Performance of Reliable Transport Protocol over IEEE 802.11 Wireless LAN: Analysis and Enhancement”, INFOCOM 2002, 23–27 June 2002.
Figure 8: Performance of 12 TCP uploads using suggested 802.11e parameters. Note improved fairness. 6 Uploads and 6 Downloads 700
600
Throughput(kbits/sec)
500
400
300
200
100
0
1
2
3
4
5
6
7 8 STA id
9
10
11
12
Figure 9: Performance of 6 TCP uploads (1–6) and 6 TCP downloads (7–12) with suggested parameters.
restored both within and between TCP upload and download flows. Although space restrictions prevent us including additional results, we have measured similar levels of fairness across a range of conditions, including varying numbers of upload and download stations, situations where the number of uploads and downloads is not the same and adding background inelastic traffic, confirming the effectiveness of the proposed solution.
6.
CONCLUSIONS
We have used our testbed to demonstrate that the 802.11e parameters CWmin, TXOP and AIFS work largely in line with analytic and simulation predictions. One notable exception is the discrepancy between the analytic model of [6] and experimental measurements for large AIFS values, which we attribut to the Markov chain used in the model. In this paper we also demonstrate that the flexibility provided by the 802.11e MAC can be used to alleviate certain cross-layer interactions and yield significant improvements to TCP’s performance over 802.11. Future work will include the extensions to voice and mixed voice/data networks.
22