Experimental Evaluation of ZigBee and IEEE 802.15.4 for Data-Intensive Body Sensor Networks Diogo Gomes, José A. Afonso
Helena Fernandez-Lopez
Centre Algoritmi/Dept. of Industrial Electronics University of Minho Guimarães, Portugal
[email protected]
Life and Health Sciences Research Institute ICVS University of Minho Braga, Portugal
[email protected]
Abstract—This paper presents results concerning an experimental performance evaluation of ZigBee and IEEE 802.15.4 networks applied to the transport of data-intensive traffic generated by body sensor network applications. The experimental platform is based on the Z-Stack and TIMAC software stacks and the CC2530 device, from Texas Instruments. Three quality of service metrics are evaluated: goodput, delivery ratio and delay. Results are provided for both star and tree topologies. It was observed that the overhead introduced by the stack implementation has a significant impact on the performance results. Overall, the performance of the ZigBee star topology was very good, even in the worst conditions, provided the acknowledgement mechanism was enabled. A router deadlock problem detected in other ZigBee implementations was not observed with the Z-Stack. However, we identified two different situations, triggered by periods of high traffic load, on which the ZigBee router stops relaying packets, causing a significant degradation on the network performance.
I.
INTRODUCTION
A Body Sensor Network (BSN) consists in a group of devices distributed over the human body and a wireless network that supports communications. BSNs can be used to monitor various physiological signs like electroencephalogram (EEG), electrocardiogram (ECG), temperature, blood pressure, electromyogram (EMG) and oximetry. BSN-based monitoring can provide benefits in the diagnosis and treatment of patients without constraining their normal activities. It allows the patient to move freely inside or outside the hospital environment while providing continuous monitoring, which can be very useful when a long period of monitoring is required. For example, many cardiac diseases are associated with episodic abnormalities, such as transient surges in blood pressure or arrhythmias [1], which cannot always be detected using conventional monitoring equipment. BSNs have the potential to provide early detection and prevention of such pathologies, replacing expensive therapies later on. ZigBee is a widespread adopted protocol in wireless sensor network applications; however, most of these applications generate low traffic load, such as the case where a user presses a switch to turn on/off a lamp. On the other hand, some BSN applications are data-intensive, generating a considerable amount of traffic. It is the case of some physiological sensors, like ECG and EEG, which need to be sampled several times per second for the desired signal to be recorded. This paper presents the results and discussion concerning an experimental performance evaluation of the utilization of ZigBee and IEEE
©2012 SAAEI
802.15.4 networks to support BSN applications, with particular emphasis on data-intensive scenarios. Three relevant quality of service (QoS) metrics are considered: goodput, delivery ratio and delay. The evaluation scenario uses traffic parameters extracted from a real implementation of a motion capture application based on several sensor modules, each one containing multiple inertial and magnetic sensors [2]. When one of these sensor modules is attached to an object, its orientation in 3D space can be obtained. Likewise, when several modules are attached to different segments of a user’s body, the movements of monitored parts can be tracked. The task of the BSN is to send the data wirelessly from the sensor modules to a PC attached to a base station while satisfying the QoS requirements. Several works in the literature present performance evaluation results regarding IEEE 802.15.4 and/or ZigBee protocols, for different application scenarios, based on analytical models [3][4][5] or simulations [6][7]. This paper, on the other hand, concerns the evaluation of ZigBee and IEEE 802.15.4 through the execution of experimental tests, which provide a different insight on the performance of these systems, by taking into account variables present in real-world implementations that have impact in the performance but are overlooked in most theoretical models, such as the processing load in network nodes. This paper is organized as follows. The next section provides a brief description of the relevant characteristics of the IEEE 802.15.4 and ZigBee standards in the context of this paper. Section III presents the evaluation platform used in the experimental tests. Section IV describes the evaluation scenarios and presents the results and discussion concerning the experimental tests performed. Finally, Section V presents the conclusions. II.
IEEE 802.15.4 AND ZIGBEE
The IEEE 802.15.4 standard [8] specifies both the physical (PHY) and medium access control (MAC) layers for low power, low rate and low cost wireless network devices. The PHY layer uses direct sequence spread spectrum (DSSS) and defines different transmission rates and bands: 250 kbps for the 2.4 GHz band, 20/40 kbps for 868/915 MHz band, among other possible optional configurations. The MAC layer defines two different operation modes: a non-beaconed mode, which uses an unslotted CSMA-CA (Carrier Sense Multiple Access Collision Avoidance) algorithm, and a beaconed mode, where
531
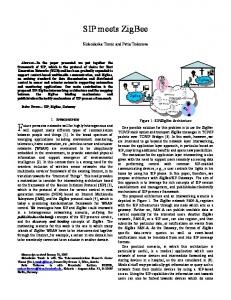
the network coordinator transmits a periodic beacon allowing synchronization with a superframe structure, which uses slotted CSMA-CA algorithm. The MAC layer provides also an optional guaranteed time slot (GTS) mechanism, which allows the allocation of dedicated bandwidth for devices; however, this mechanism is limited to a maximum of seven GTS allocations. Figure 1 represents the unslotted CSMA-CA algorithm. CCA (Clear Channel Assessment) is performed on each iteration of the algorithm, and indicates if the channel is idle or not. Before performing CCA, this algorithm waits for a random interval between 0 and (2BE - 1) unit backoff periods (aUnitBackoffPeriod), where BE, the backoff exponent, takes the value of macMinBE at the beginning of the algorithm and increases at each iteration until it reaches macMaxBE. When the CCA declares that the channel is idle, the algorithm ends with success status and the transmission may start; otherwise a new iteration is initiated. The algorithm may perform CCA at most macMaxCSMABackoffs times. Once this value is exceeded, the algorithm declares channel access failure. The values of the parameters used on the CSMA-CA algorithm are specified in TABLE I. Unslotted CSMA-CA
function devices (FFD) and reduced function devices (RFD). A FFD usually is mains powered and operates as a network coordinator or router. A RFD is typically a battery powered end device. The protocol supports star, tree and mesh topologies. In star topology, the devices communicate directly with the coordinator. Tree and mesh topologies allow to increase the range of the network by introducing routers that relay the traffic from end devices. The mesh topology also permits multipath routing, which enhances the reliability and scalability of the network. The ZigBee stack is based on the Open Systems Interconnection (OSI) model. Each layer performs a specific set of services for the layer above. The stack is divided into four distinct layers: physical (PHY), medium access control (MAC), network (NWK) and application (APL). The IEEE 802.15.4 standard defines the two lower layers of ZigBee: PHY and MAC. ZigBee does not use all the IEEE 802.15.4 specification. For instance, the GTS scheme is not used due to the high complexity of introducing it in mesh or tree topologies. The NWK layer is introduced to add multihop network communication and it is responsible to create and maintain the network, discover new routes, assign the devices short addresses, among others tasks. The APL layer supports up to 240 applications on the same device. III.
NB = 0, BE = macMinBE
The experimental platform used to produce the results presented on this paper was developed and tested using the ZigBee and IEEE 802.15.4 stack implementations provided by Texas Instruments, a leading supplier of ZigBee products. The hardware platform is based on the CC2530 development kit, which is also provided by Texas Instruments.
BE
Delay for Random(2 -1) unit backoff periods
Perform CCA
Channel idle?
EVALUATION PLATFORM
N
A. CC2530 Development Kit The CC2530 development kit contains the SmartRF05EB evaluation board, which provides several peripherals to the user, such as LCD, LEDs, UART, SPI, USB, joystick and buttons, and the CC2530EM evaluation module, which contains the CC2530 system-on-chip, an antenna adapter and two crystal oscillators. The CC2530 [11] integrates an 8051 microcontroller, a high performance RF transceiver compatible with the IEEE 802.15.4 standard in the 2.4 GHz band, 8 KB of RAM and up to 256 KB of Flash memory.
NB = NB + 1, BE = min(BE + 1, macMaxBE)
Y Success NB > macMaxCSMABackoffs
N
Y Failure
Figure 1. Unslotted CSMA-CA algorithm. TABLE I. IEEE 802.15.4 parameters. Parameter The maximum number of backoff periods that CSMA-CA shall execute until declares channel access failure. (macMaxCSMABackoffs) The minimum value of the CSMA-CA backoff exponent. (macMinBE) The maximum value of the CSMA-CA backoff exponent. (macMaxBE) The number of symbols forming a unit backoff period. (aUnitBackoffPeriod). A symbol corresponds to 16 µs. The maximum number of retransmissions allowed by the 802.15.4 MAC layer after a transmission failure. (aMaxFrameRetries)
Value [0,5], default = 4 [0-3], default = 3 5 20 3
ZigBee [9][10] is a standard protocol designed for low power devices used on wireless monitoring and control systems. The standard defines two types of devices: full
B. Z-Stack and TIMAC Z-Stack is the ZigBee software stack provided by Texas Instruments. The version used in this work is the Z-StackCC2530-2.4.0-1.4.0 and it supports the two stack profiles of the ZigBee 2007 specification: ZigBee and ZigBee Pro. The ZStack software is organized on the following components: OSAL (Operating System Abstraction Layer), HAL (Hardware Abstraction Layer), ZigBee and IEEE 802.15.4 Stack, Application and MT (Monitor and Test) interface. The OSAL component consists on the operating system provided to control all the running tasks and provides the API (Application Programming Interface) for communication and synchronization between tasks. The HAL is a set of drivers to access all available peripherals. The ZigBee and IEEE 802.15.4 Stack provides the implementation of the ZigBee 2007 layers. The Application component refers to the set of applications
532
running on the device. A device may be controlled by one of the Texas Instruments PC test tools, so the MT component provides the interface between these tools and the device.
packet contains the payload plus the overhead introduced by the ZigBee stack.
TIMAC is the Texas Instruments implementation of the IEEE 802.15.4 standard. The version used in this work is the TIMAC-CC530-1.3.1. The components of this implementation are the OSAL, HAL, IEEE 802.15.4 and Application. IV.
EXPERIMENTAL EVALUATION
The performance of ZigBee and IEEE 802.15.4 were evaluated in two different scenarios. In the first scenario the maximum goodput (application level throughput) supported by Z-Stack was measured and compared with a theoretical model. The main objective was to evaluate the effect of the overhead introduced by both the protocol and the stack implementation in the throughput provided to the application. In the second scenario the delivery ratio and maximum and mean delay were measured in the scope of a motion capture application. These scenarios were evaluated on both star and 2-hop tree topologies in a ZigBee network operating on channel 26, which was chosen due to the absence of interference from nearby WiFi networks, verified using a spectrum analyzer. Relevant IEEE 802.15.4 parameters and the respective values are specified in TABLE I (for the variable parameters, the default values were used). For the tests where the acknowledgement (ACK) mechanism was enabled, the MAC layer makes, at most, aMaxFrameRetries retransmissions of a packet before it discard the packet. The ACK frame length specified by the IEEE 802.15.4 standard is 88 bits, and the overhead introduced by all ZigBee layers in the evaluation scenarios accounts for a total of 264 bits. All tests finish after the coordinator has received 5000 packets from the end devices. The tests presented in this paper used the ZigBee Pro stack profile, but the same tests were performed using ZigBee stack and the results shown no significant differences. The periodic ZigBee Pro link status messages and IEEE 802.15.4 data requests commands were disabled. The tests were made in the absence of hidden-nodes, since all network devices were in the radio range of each other. A. Maximum Goodput In this scenario a single end device transmits packets to the network coordinator. In the star topology, the transmission is direct, while in the 2-hop tree topology the end device transmits packets to a network router (its parent), which relay the packets to the coordinator. In order to determine the maximum network goodput, the end device transmits packets in burst. For the experimental tests, two modes were implemented. In mode 1, the application layer generates and sends packets to the lower layer, one after another, as fast as it can. In mode 2, the application layer waits for the indication that the ACK has arrived before sending the next packet. Figure 2 represents the times associated with the transmission of a packet using the unslotted CSMA-CA algorithm of the IEEE 802.15.4 standard. The transmission period is composed by the random backoff interval (TBackoff), the transceiver turnaround time (TTA) from RX to TX, the packet transmission time (TPacket), a turnaround time from TX to RX and, finally, by the ACK transmission time (TACK). The
Figure 2. IEEE 802.15.4 CSMA-CA associated times.
The theoretical maximum goodput is obtained using Equation 1. The average transmission period is calculated using the mean backoff interval (1.12 ms). The turnaround time is defined in IEEE 802.15.4 standard and corresponds to 192 µs. The ACK transmission time is 352 µs, while the packet transmission time depends on the payload length. In a 2-tree network topology, it is assumed that the transmission period is duplicated due to the packet relay from the router to the coordinator. ݐݑ݀ܩൌ
௬ௗ ௧ ሾ௧௦ሿ ௩ ்௦௦௦ ௗ ሾ௦ሿ
(1)
It was not possible to obtain experimental results concerning the maximum goodput in mode 1 with the 2-hop tree topology, because the router blocked consecutively during the respective tests. Through the use of a packet sniffer, it was observed that the router relays packets for just few seconds, then blocks for around 8 seconds, after what it becomes available again and the process repeats. Several other tests were performed in different conditions, but this problem only occurred in tests where the router was subject to very high traffic load received from one or more end devices. One possible explanation for this problem is that the router experiences an overload situation where it is not able to handle packet relaying at the NWK layer when new packets are constantly being received at the MAC layer, which is a higher priority task in the implementation of the Z-Stack. The router blocking problem does not occur when mode 2 is used. In this case, the time spent by the end device waiting for the reception of the ACK indication at application level may give the router sufficient time to relay the packet. Figure 3 presents both the theoretical and measured maximum goodput for star and 2-hop tree topologies using the Z-Stack, as a function of the payload length. The theoretical maximum goodput with the 2-hop tree is half of the star topology, as expected, due to the traffic duplication on the router. The experiment reveals that the measured values are significantly smaller than the corresponding theoretical values. This difference is caused by the delay between layers introduced by the Z-Stack operating system when packets are processed by the system tasks. This delay is being measured and characterized, in order to be introduced in a model that takes into account the influence of the stack implementation in the network performance. The model will then be used to produce more accurate results on theoretical and simulation analyses. Although IEEE 802.15.4 networks provide a data rate of 250 kbps in the 2.4 GHz band, the measured maximum
533
goodput with 90-byte payload, in all experiments, was well below: 95 kbps (mode 1) and 54 kbps (mode 2) for the star topology, and 40 kbps (mode 2) for the 2-hop tree topology. The difference between the raw data rate and the theoretical maximum goodput is due to the overheads introduced by the protocol (backoff periods, packet headers, etc.). The remaining difference is due to the overhead introduced by the stack implementation (such as the processing delay referred in the previous paragraph). The payload length could not be increased further due to the maximum packet length limitation imposed by the IEEE 802.15.4 standard. 140
Maximum Goodput [kbit/s]
120 100 80 60 40 20 0
10
20
30
40
50
60
70
80
90
results, therefore the following figures present results concerning the performance observed using mode A. These results were obtained with the IEEE 802.15.4 data request mechanism disabled, but the same tests performed with the end devices transmitting data request commands every second showed no relevant differences. Figure 4 shows the topologies used to evaluate the performance of the networks. In the star topology, the end devices transmit the packets directly to the coordinator and in the 2-hop tree topology the end devices transmit to the router, which relays the packets to the coordinator. Since the IEEE 802.15.4 standard does not define a network layer, in TIMAC the router role of the 2-hop tree topology is simulated using a peer-to-peer network where all end devices transmit the packets to a device, which relays the packets to the coordinator. A trigger signal controlled by the coordinator is used to generate a periodic interruption on the end devices according to the transmission period. The main objective of the trigger is to create a scenario of contention where all the end devices try to access the medium at same time, which represents the worst case scenario. For the delay test, an end device was designated to be the reference for the measured values.
Packet Payload Length [byte] Star - Theoretical Star - Measured in mode 1 Star - Measured in mode 2 Tree - Theoretical Tree - Measured in mode 2
Figure
3. Maximum goodput for star and tree topologies.
During the performance tests, it was detected that one of the ZigBee sublayers, more specifically the Application Support Sublayer (APS), does not filter duplicated packets for the applications. This behavior is inconsistent with the APS characteristics defined in the ZigBee 2007 specification [9]. B. Reliability and Delay In this evaluation scenario, the delivery ratio and delay were measure in a contention environment where multiple end devices generate packets to the coordinator simultaneously. The delivery ratio represents the ratio of successfully delivered packets to the number of packets generated by the source node application and the delay is the time since the packet is delivered for transmission by the source node application layer until it reaches the destination node application layer. The tests were performed with both Z-Stack and TIMAC to observe the system behavior when supported by these two different architectures. These experimental evaluations were performed in the scope of a BSN motion capture application. Each end device transmits packets with the same amount of information, which is required to determine the orientation in 3D space of the body segment where the device is attached. Two different traffic configurations were used to test the network performance: mode A and mode B. In mode A, the packet length is 89 bytes and packets are transmitted in 200 milliseconds intervals. In mode B, each packet has 62 bytes and the transmission period is set to 100 milliseconds. The packet length in mode A is larger because packets have to carry twice the number of motion capture sensor samples. In both modes, the stack overhead is 33 bytes (264 bits). Both modes generated similar
Figure 4. Configurations used to measure delivery ratio and delay.
The same router blocking problem described in the previous scenario was observed in this scenario for the 2-hop tree topology with the acknowledgement mechanism enabled, although less frequently. Therefore, in order to allow the evaluation of the delivery ratio and delay during the period where the router is not blocked, the number of packets received by the coordinator before the experiment ends was reduced from 5000 to 1000 packets in this particular case. Figure 5 presents the measured delivery ratio with Z-Stack in mode A as a function of the number of sensor nodes for the star and 2-hop tree topologies. For the star topology, the delivery ratio was close to 100% when the acknowledgment mechanism was used. However, the delivery ratio for the 2-hop tree topology with 3 to 5 end devices was lower (around 96%) in the same conditions. It was verified that the packet delivery errors in these cases are associated to the operation of the route maintenance protocol, which manages the quality of the links and could not be disabled. Due to the high traffic load generated by the end devices, the route maintenance protocol initiates the router discovery procedure frequently (each 5 seconds, on average, in the experiments with 3 to 5 end devices). During this procedure, which lasts for around 250 ms, the router interrupts the packet relaying, causing packet drops due to buffer overflow.
534
1 0,95
Delivery Ratio
0,9 0,85 0,8 0,75 0,7 0,65 0,6
1
2 Star - with ACK Tree - with ACK
3 Number of Sensor Nodes
4
5
Star - without ACK Tree - without ACK
Figure 5. Delivery ratio measured with Z-Stack for an increasing number of sensor nodes.
In [12], the author observed a phenomenon called router deadlock where, after the router receives a packet from an end device, it rejects packets form other end devices until it relays the first packet to the next hop. This phenomenon was observed with the Jennic implementation of the ZigBee stack on JN5139 devices, and it was shown to have a significant negative impact in the delivery ratio of the network. During the tests performed in this work, which uses the Texas Instruments implementation of the ZigBee stack (ZStack), it was observed that router has the capability to interrupt the backoff process of CSMA-CA algorithm to receive and buffer new packets. Therefore, the router deadlock phenomenon does not occur with this ZigBee implementation and, consequently, the delivery ratio is not negatively affected. Figure 6 illustrates the behavior observed with the Z-Stack. In this example, the router receives two packets from different end devices first, and only after that it relays the packets.
Figure 6. Transmission model for tree topologies with Z-Stack.
Figure 7 presents the delivery ratio with TIMAC with an increasing number of sensor nodes transmitting in mode A for the star and 2-hop tree topologies. In order to compare the TIMAC performance with Z-Stack, the lengths of the transmitted packets have been equaled to those that were transmitted in the Z-Stack measurements, since the two stacks have different overheads. This was achieved adding 16 bytes (128 bits) of dummy information to the packets. The results with the acknowledgement mechanism enabled are worse than the ones obtained using the Z-Stack. This difference is explained by the fact that the Z-Stack network layer may retransmit a packet if the MAC layer has failed to transmit it. By default, the Z-Stack network layer is configured to perform one retransmission attempt. Since all retransmission mechanisms are disabled when the acknowledgments are not used, the better results observed with the Z-Stack for the tree topology without ACK are due to the router network layer, which has the capability to buffer the received packets and relay them when the end devices are idle. On the contrary, the application that simulates the router in the TIMAC relays immediately the received packets. 1 0,95 0,9 0,85 Delivery Ratio
When the acknowledgments are disabled, the delivery ratio decreases significantly in both topologies as the number of sensor nodes increases, because the network traffic also increases, increasing the occurrence of channel access failures and collisions. These results confirm the importance of the acknowledgment mechanism to the reliability of the system.
0,8 0,75 0,7 0,65 0,6 0,55 0,5
1
2 Star - with ACK Tree - with ACK
3 Number of Sensor Nodes
4
5
Star - without ACK Tree - without ACK
Figure 7. Delivery ratio measured with TIMAC for an increasing number of sensor nodes.
Figure 8 and Figure 9 show the measured average and maximum delay, respectively, as a function of the number of sensor nodes for both Z-Stack and TIMAC operating in mode A, considering the use of the acknowledgment mechanism and both the star and 2-hop tree topologies. The TIMAC delays are lower than those measured with the Z-Stack due to the lower processing load introduced by the TIMAC. As expected, the average and maximum delays increase along with the number of sensor nodes, because the medium access contention, collisions and retransmissions also increase. For 3 to 5 end devices, the maximum delay for the tree topology with Z-Stack increased significantly. This higher delay is consequence of the packet buffering that occurs during the router discovery procedure triggered the route maintenance protocol. In mode B, the observed delays were slightly smaller due to the smaller packet length, which decreases the packet transmission time. The delay results presented in this paper do not include the packetization delay, which approaches the value of the transmission period for the first sample of the packet and decreases for the subsequent samples.
535
problem, which is also caused by high traffic loads and lasts several seconds, was also observed. These results suggest that a mechanism to distribute the traffic load generated by dataintensive devices along the time, in order to reduce contention, can be beneficial to prevent router overload and, consequently, increase the network performance.
60
Average Delay [ms]
50 40 30
Future work includes the refinement of a simulation model of the IEEE 802.15.4/ZigBee protocols, in development, through the characterization and incorporation of the measured stack implementation delays, in order to allow the production of more accurate simulation results.
20 10 0
1
2
3 Number of Sensor Nodes
Star - Z-stack Tree - Z-Stack
4
5
ACKNOWLEDGMENT Star - TIMAC Tree - TIMAC
Figure 8. Average delay as a function of the number of sensor nodes for both Z-Stack and TIMAC.
This work is funded by FEDER funds through “Programa Operacional Fatores de Competitividade – COMPETE” and by National Funds through FCT – Portuguese Foundation for Science and Technology in the scope of the Project FCOMP-01-0124-FEDER-022674.
REFERENCES
1000
Maximum Delay [ms]
[1]
100
10
1
1
2 Star - Z-stack Tree - Z-Stack
3 Number of Sensor Nodes
4
5
Star - TIMAC Tree - TIMAC
Figure 9. Maximum delay as a function of the number of sensor nodes for both Z-Stack and TIMAC.
V.
CONCLUSIONS AND FUTURE WORK
This paper presented an experimental performance analysis of ZigBee and IEEE 802.15.4 for BSN applications, with particular emphasis on high traffic load conditions and using traffic parameters from a motion capture application. The study is based on the Texas Instruments implementation of ZigBee (Z-Stack) and IEEE 802.15.4 (TIMAC). Results confirm the importance of the acknowledgment mechanism to the reliability of the system. The router deadlock problem detected in other ZigBee implementations was not observed with the ZStack. In the 2-hop tree configuration, tests have shown that successive periods of high traffic load can cause the ZigBee router to start the route discovery procedure, with negative impact on the delay and delivery ratio. A router blocking
B. Lo and G. Z. Yang, “Key technical challenges and current implementations of body sensor networks”, 2nd International Workshop on Body Sensor Networks (BSN 2005), London, UK, April 2005. [2] H. D. Silva, P. Macedo, J. A. Afonso and L. A. Rocha, “Design and implementation of a Wireless Sensor Network applied to Motion Capture”, 1st Portuguese Conference on Wireless Sensor Networks (CNRS 2011), Coimbra, Portugal, March 2011, pp. 45-52. [3] Z. Chen, C. Lin, H. Wen and H. Yin, “An Analytical Model for Evaluating IEEE 802.15.4 CSMA/CA protocol inLow-rate wireless application”, 21st International Conference on Advanced Information Networking and Applications Workshops (AINAW 2007), Ontario, Canada, May 2007, pp. 899- 904. [4] X. Liang and I. Balasingham, “Performance Analysis of the IEEE 802.15.4 based ECG Monitoring Network”, Seventh IASTED International Conferences Wireless and Optical Communications, Montreal, Canada, June 2007, pp. 99-104. [5] J. S. Choi and M. C. Zhou, “Performance analysis of ZigBee-based body sensor networks”, IEEE International Conference on Systems Man and Cybernetics (SMC 2010), Istanbul, Turkey, October 2010, pp. 24272433. [6] J. Zheng and M. J. Lee, “A Comprehensive Performance Study of IEEE 802.15.4”, Sensor networks operation, Vol. 4, 2006, pp. 1-14. [7] G, Lu, B. Krishnamachari, C. S. Raghavendra, “Performance Evaluation of the IEEE 802.15. 4 MAC for Low-Rate Low-Power Wireless Networks”, IEEE International Conference on Performance, Computing, and Communications (IPCCC 2004), Phoenix, Arizona, USA, April 2004, pp. 701-706. [8] IEEE Std 802.15.4-2006 – Part 15.4: Wireless Medium Access Control (MAC) and Physical Layer (PHY) Specifications for Low-Rate Wireleess Personal Area Networks (WPANs), September 2006. [9] ZigBee Standards Organization, ZigBee Specification, Document 053474r17, January 2008. [10] D. Gislason, "Zigbee Wireless Networking", Newnes, 2008. [11] Texas Instruments, "A True System-on-Chip Solution for 2.4-GHz IEEE 802.15.4 and ZigBee Applications", CC2530 datasheet, February 2011. [12] H. F. López, “Remote Vital Signs Monitoring Based on Wireless Sensor Networks”, PhD thesis, University of Minho, 2011.
536
Powered by TCPDF (www.tcpdf.org)