Jan 1, 1985 - varier le rapport eau sur savon (X) à température constante (chemin II). ... 03BD et 03B3 mesurées le long des deux chemins sont proches.
Experimental evidence for a continuous variation of effective critical exponents in a microemulsion system A.M. Bellocq, P. Honorat, D. Roux
To cite this version: A.M. Bellocq, P. Honorat, D. Roux. Experimental evidence for a continuous variation of effective critical exponents in a microemulsion system. Journal de Physique, 1985, 46 (5), pp.743-748. .
HAL Id: jpa-00210016 https://hal.archives-ouvertes.fr/jpa-00210016 Submitted on 1 Jan 1985
HAL is a multi-disciplinary open access archive for the deposit and dissemination of scientific research documents, whether they are published or not. The documents may come from teaching and research institutions in France or abroad, or from public or private research centers.
L’archive ouverte pluridisciplinaire HAL, est destin´ee au d´epˆot et `a la diffusion de documents scientifiques de niveau recherche, publi´es ou non, ´emanant des ´etablissements d’enseignement et de recherche fran¸cais ou ´etrangers, des laboratoires publics ou priv´es.
J.
Physique 46 (1985) 743-748
Classification Physics Abstracts 78.35 64.70J -
-
MAl
1985, 1
E 743
82.70K
Experimental evidence for a continuous variation of effective critical exponents in
a
microemulsion system Bellocq, P.
A. M.
Honorat and D. Roux
Centre de Recherche Paul Pascal, CNRS (GRECO Microémulsions), Domaine Universitaire, 33405 Talence Cedex, France
(Reçu
le 8 octobre 1984,
accepté le 3 janvier 1985)
Nous présentons des résultats obtenus par diffusion de la lumière en différents points d’une ligne criRésumé. tique d’un système microémulsion quaternaire. Cette ligne débute par un point critique extreme. Les points critiques ont été approchés, soit en faisant varier la température à composition constante (chemin I), soit en faisant varier le rapport eau sur savon (X) à température constante (chemin II). Pour chaque point critique examiné, les valeurs des exposants critiques 03BD et 03B3 mesurées le long des deux chemins sont proches. Elles varient continûment des valeurs d’Ising à des valeurs très petites quand le point critique considéré s’approche du point critique extreme. Ce comportement critique complexe est analysé à l’aide des résultats du diagramme de phase. 2014
We present light scattering results obtained for a four-component microemulsion system in several Abstract distinct positions of a critical line. This line starts at a critical end point The critical points were approached either by raising the temperature at fixed composition (path I) or by increasing the water over surfactant ratio X at constant temperature (path II). For each critical point investigated, the critical exponents 03BD and 03B3 associated with the X variable (path II) are close to those obtained with the temperature (path I). They vary continuously from the Ising values to largely smaller ones as the critical end point is approached. This complex critical behaviour is discussed in relation with the phase diagram findings. 2014
1. Introducfiom
Over the past few years a large number of papers have been devoted to the experimental study of critical phenomena in mixtures involving surfactants. Two-, three-, four-, and even five-component systems were investigated [1-11]. This current experimental interest in the critical behaviour of micellar and microemulsion solutions is due, to a great extent, to the very intricate results obtained so far. Indeed, if some experimental results [1-8] are in agreement with those found in pure or usual binary fluids, other data indicate a more complex behaviour [9-11]. In most cases, the critical phenomenon is measured by its critical exponents v and y which characterize, respectively, the divergences of the correlation length and the osmotic compressibility of the solution. The experimental values of v and y for pure compounds or binary mixtures are in good agreement with the Ising values [12] (v 0.63, 1.24). In some surfactant solutions, the values y measured correspond to either negative [10] or positive [11]. deviations from the Ising indices. This behaviour is far from being understood. All the critical points investigated so far are lower critical points. =
=
Several theoretical treatments for such points in binary solutions of small molecules have been developed on the basis of decorated lattice models [13]. These models account for the strongly asymmetric coexistence curves found for a wide variety of mixtures which present a lower critical point and a closed-loop coexistence curve. They exhibit non-classical critical
behaviour at both upper and lower critical solution temperatures. These models also predict that when the upper and lower critical point coalesce at a critical double point, the exponent fl which describes the shape of the coexistence curve in the vicinity of the critical point is renormalized at the critical double point to the value fl* 2 p [14]. Recently, doubled exponents (v and y) have been experimentally found near the vanishing miscibility gap of the =
pseudobinary mixture guaiacol + (glycerol/water) [15]. In 1970, Griffiths and Wheeler [16] pointed out the importance of the field variables in multicomponent systems. In contrast to densities, the fields have the property that they take an identical value in all the
phases
which
are
in
thermodynamic equilibrium.
Article published online by EDP Sciences and available at http://dx.doi.org/10.1051/jphys:01985004605074300
744
Temperature, pressure and chemical potential fields, whereas concentration or refractive index
are are
densities. These authors also indicate that the direction parallel to the coexisting surface in the space of fields is singled out by the phase transition itself. Theoretical predictions also state that along such a path the critical behaviour is described by the same exponents whatever the field considered. The main difficulty is to find an appropriate field variable, different from temperature or pressure, which may be experimentally controlled. In most of the surfactant systems investigated, the critical point was approached by raising temperature. Recently, two of us [4] have found evidence that in the oil rich part of microemulsion phase diagrams, the water over surfactant ratio X has the property of a field variable; for example, it behaves as a chemical potential. Particularly, they have shown that the variable X can be used similarly as temperature to approach a critical point [4, 6]. In order to improve our understanding of the critical behaviour in surfactant solutions we have undertaken a systematic light scattering investigation of microemulsion systems [4, 6]. We present in this paper results obtained for different points of a critical line of a quaternary mixture. Each critical point has been approached along two different paths, either by raising temperature at fixed composition (path I) or
by increasing X
at constant
temperature (path II).
The mixture investigated contains water, SDS and pentanol. 2. Phase
dodecane,
diagram
We have
Fig. 1. of the
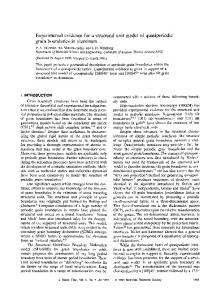
Schematic representations of the phase diagram pentanol-dodecane water-SDS system. la) At fixed
-
temperature in the dodecane concentration-alcohol concentration-X space. lb) At X constant in the dodecane concentration-alcohol concentration-temperature space. Region 1 :: microemulsion. Region 2 : two-phase region. Region 3 : liquid crystalline phase. Region 4 : polyphasic
recently reported preliminary results on the phase diagram of the quaternary system made of water, dodecane, sodium dodecyl sulfate and pentanol [17]. The phase diagram is very complex. A region. detailed description will be published elsewhere. One of the important features found for this system, at constant temperature, is a connects a critical end point
critical line which P’ with probably a critical point P’ located in the limiting ternary face of the system without oil. The critical end point PI is located in the oil rich part of the diagram (critical dodecane concentration = 80 %). At fixed temperature and pressure, the phase diagram can be represented in using three independent variables. Figure la gives a schematic representation of the phase diagram of the system investigated in a mixed density-field space. Two of the variables are densities, the alcohol (cA) and oil (co) concentrations, while the third one is a field, the water over surfactant ratio X. Experimentally, we have studied pseudoternary diagrams at constant X. In the following, these sections are referred to as an X plane. The X values (expressed in weight) corresponding to pA and PB are, respectively, 0.95 and 6.6. Therefore, any X plane defined by a X value between 0.95 and 6.6 intercepts the critical line at one critical point Pc
called Pj. The critical line is located at the boundary between a microemulsion domain (region 1) and a two-phase region where two microemulsions are in equilibrium (region 2). Gas chromatography analysis of the phases in equilibrium has shown that the tielines corresponding to the two-phase region 2 are located in the X planes [18]. This result reflects the field character of the variable X. In a given X plane, this property holds even far from the critical point. In addition, a smectic liquid crystalline phase (region 3) is found at a lower alcohol content than the microemulsion phase. This mesophase can contain a very high amount of alcohol plus oil up to 98 %. The two one-phase regions 1 and 3 are separated by a complex polyphasic domain (region 4) which includes several two-, three-, and even four-phase equilibria. In particular, in the vicinity of PI a three-phase domain is observed where the liquid crystalline phase is in equilibrium with two microemulsions. The critical end point P’ is the point where the three-phase domain disappears. In this part of the diagram,
745
the liquid crystalline phase has a composition very similar to that of the critical microemulsion phase. Figure la shows that it is possible to approach any critical point Peat fixed temperature by varying the field X (path II). Along this path, measurements are made in the single phase domain as a function of X with a constant concentration for pentanol and dodecane; these latter are fixed at their critical values. If one takes into account the temperature variation, the critical line becomes a critical surface. The section at constant X for this surface gives a critical line. Figure 1 b shows a schematic phase diagram in the temperature, pentanol and dodecane concentrations space, for fixed X. In this space, any critical point Pr can be approached by varying temperature (path I). Along this path, measurements are made in the single phase microemulsion domain as a function of temperature with a constant overall composition for all the components (pentanol, dodecane, X). 3.
Light scattering results. The phase diagram of the water-dodecane-pentanolsodium dodecyl-sulfate system shows a critical surface in the CA-co-X-temperature space. As mentioned above, any critical point can be approached in the single phase domain along two different paths, either by varying temperature at fixed X (path I) or by varying X at fixed temperature (path II). The critical points investigated are located in the oil rich region of the microemulsion phase diagram. In this region, the structure can be described as a dispersion of water in oil micelles [19]. The phase transition studied has been previously interpreted as a liquid-gas transition due to interactions between inverse micelles [17]. Therefore, the order parameter of the transition is likely the volumic micellar concentration, which is related to the concentration of the mixture water and surfactant.
In order to analyse whether the critical behaviour is the same at several distinct positions of the critical surface, we have undertaken static light scattering measurements for several critical samples. The samples were prepared in sealed cylindrical glass cells. The cell temperature was controlled within 0.01 °C. The angular dissymmetry of the total scattered intensity was obtained by measurements at five angles 0 ranging from 400 to 1400. The intensity and angular distribution of light scattered were measured as a function of temperature or X. The data for each value of T or X can be described by the Ornstein-Zernike relation, which is expected to be a good approximation in the critical region : I(q) I(0)1(1 + q2 ,2), where q is the scattering vector q 4 nnj  sin 0/2, n is the refractive index of the solution, A the wave length of the light in vacuum (5 145 Á), , is the correlation length of the concentration fluctuations, and /(0) is proportional to the osmotic compressibility of the solution. =
=
3.1 CRITICAL BEHAVIOUR AT FIXED COMPOSITION. Six critical samples defined by X 1.034, 1.207, 1.372, 1.552, 3.448 and 5.172 have been prepared. Both j and 1(0) increase as the temperature is raised and diverge at the critical point. Figure 2 shows log-log plots of 1(0) and, versus the reduced temperature c (Tc - T)jTc for the six critical mixtures. The data are well described by the power laws =
=
The t index indicates that the critical point is approached by varying temperature. The values obtained by a least square fitting procedure for Tc, yt, v, and Ço are given in table 1. The value T, deduced from the fitting of the experimental data is slightly different from the experimentally found temperature Td at which the mixture separates. The diffe-
Fig. 2. Log-log plots of the correlation length ç and the total intensity 1(0) versus the reduced temperature for the six following critical mixtures. a : X, = 1.034; b : Xr = 1.207; c : Xc = 1.372; d : X, = 1.552; e : Xc 3.448; f : X, 5.172. -
=
=
746
Table I. Critical temperature Tc and critical ratio X, for the six points measured along paths I and II. Values of the critical exponents vt, }’ t’ vx and yx and of ’the scale factors jo and Io. -
(*) Arbitrary
unit.
found between T c and Td (0.1 °C-0. 1 5 °C) is of the order of magnitude of the experimental uncertainty on the Td measurement. The values of the exponents v and y determined in using Td are very close to those obtained when temperature is set free in the fit of the experimental data. The uncertainties given in table I correspond to the variations found when the critical temperature considered is either T c or Td. The Y tl v ratio is found to be constant and close to 2. A continuous decrease of the exponents vt and yt is observed as the critical end point PI is approached. This decrease is accompanied by an increase of Ço from 30 A to more than 300 A and also an increase of Io. The ratio lolçõ is not found constant. New experiments are under progress in order to obtain more accurate values of the constant Io. In order to examine to which extent the critical exponents are depending on the determination of the critical composition, we have studied two samples d1 and d2 located in the plane X 1.55 near the critical concentration (d). The dodecane concentration difference between the samples di and d2 (1.8 %) is large in comparison with the uncertainty on the critical concentration (0.5 %). The exponent v measured for the three cases has the same value (d1 : v 0.55 ± 0.03 ; d : v 0.53 ± 0.03 ; d2 : v 0.54 ± 0.03). These results suggest that the observed behaviour cannot be related to errors in the determination of the critical point. rence
=
=
=
=
3.2 CRITICAL BEHAVIOUR AT FIXED TEMPERATURE. Three of the six critical points investigated above have also been approached in the single phase domain
-
at constant
temperature by varying X (path II).
The experimental study of each critical point requires the preparation of several samples. Each sample has the critical alcohol and oil concentrations; they differ by the value of X. Along this second path, /(0) and ç are found to follow the power laws
The
x
index indicates that the critical
approached by varying
point
is
X.
(Xc - X)/Xc ex is the reduced variable X : Ex where Xc is the value of X at the critical point. Figure 3 gives log-log plots of 1(0) and, versus ex. The values of vx and yx obtained by a least squares fit of the data for the three critical points studied (X c 3.424, 1.55 and 1.207) are given in table I. As X, decreases the values of vx and yx show a trend similar to that found for vt and yt (Fig. 4). For a given critical point Px the values of v and y obtained along the two paths are very close. =
=
4. Discussion. The continuous variation of the effective critical exponents v and y that we have evidenced is very similar to that previously reported by Corti et al. [10] for nonionic aqueous micellar solutions as the surfactant is changed. Indeed, the values of the critical exponents found for the aqueous solutions of the
polyoxyethylene amphiphiles C6E3, C8E4, C12E8 and C,4E7 are ranging between 0.63 and 0.44 for v and 1.25 and 0.87 for y, while the ’0 factor varies between 3.4 and 17.5 A. The critical phenomena
747
3. Log-log plots of the correlation length ( and the total intensity 1(0) for the three following critical points. a : X, 1.550; c : X, 1.207; b : Xc
Fig.
-
=
4. - Variation of the critical exponents vh Î’ f’ V X’ yx and of the scale factor (o versus X.
Fig.
found in these micellar solutions are not of the simple type described by the Ising model [9]. Corti et al. have suggested that a new theoretical model is needed to describe the critical behaviour of micellar solutions [10]. However, it is worth mentioning that in the ternary microemulsion system AOT-water-decane, we do not observe such a variation in critical exponents [6]. This system presents in the temperaturecomposition space a line of critical points ended by a critical end point. The critical exponents v and y measured in several distinct points of this line have
the reduced variable ex 3.424.
versus
=
=
=
(Xc - X)j X c
almost the same values, even in the vicinity of the critical end point They are found in good agreement with the Ising indices [12, 18]. Although the complex behaviour found in the quaternary mixture under study in this paper is not fully understood, several possible explanations can be considered. First, we can assume that the temperature e or X range investigated (3 x 10⁻⁴ 3 x 10⁻²) is not sufficiently close to the critical point. It is known that the range of the asymptotic simple power law depends on the thermodynamic properties considered [12]. Usually for the correlation length and the osmotic compressibility, the correction terms turn out to be unimportant for binary mixtures., In order to clarify this point, further experimental work in the range E 10-4 is required. Besides, it is known that in fluids (pure or multicomponent mixtures) the exponents depend on the path followed in approaching the critical point [19]. This possibility complicates the analysis of the results. However, the identical variation observed along the two different paths (I and II) suggests that the observed behaviour is not only due to the choice of the specific path followed. In both cases, the deviation from Ising values increases significantly in the vicinity of the critical end point The exponent variation could be due to a crossover between two sets of exponents, one of them being the Ising indices; these indices are found for the X, 3.42 and 5.2 samples. In this case, the second set of exponents does not correspond to the mean field values since the exponents measured for the lowest X values are much less than the mean field indices (v 0.5; y 1). The second set of exponents should be more likely associated with a « special » critical end point in relation with the existence of the liquid crystalline phase. With regard to this explanation is should be noted that we have observed in the vicinity of the critical end point an anomalous behaviour of viscosity =
=
=
748
similar to that previously reported for microemulsions critical point [21]. We have measured, at fixed temperature, the viscosity of mixtures located along the coexistence surface. Measurements have been done along paths defined by a fixed value of X ; the variable along each path is the dodecane and alcohol concentration. Figure 5 shows the variation of the viscosity along the two paths considered (X 1.02 and X 1.55). The data obtained for the X 1.02 plane show an anomalous behaviour in the oil concentration range around the critical point (volumic critical dodecane concentration 82 %). This anomaly disappears as X increases. Indeed, in the plane defined by X 1.55, viscosity continuously decreases as the oil concentration increases; in this case, no particular feature is observed at the critical point (volumic critical dodecane concentration 77 %). Hence, the anomalous behaviour found for the X planes close to the critical end point PI (low values of X) is not only due to the presence of a critical point. This behaviour is more likely related to the existence of the lamellar phase and could be due to precursor fluctuations of the smectic phase. Let us recall that in the vicinity of the critical end point, near a
=
=
=
=
Fig. 5. Viscosity of microemulsions (21 OC) versus the dodecane volume fraction for samples located in two X planes : + X 1.02; . X 1.55. -
=
=
the critical microemulsions and the have very similar compositions.
birefringent phase
Acknowledgments. The authors of this paper are deeply indebted to Professors B. Widom and V. Degiorgio, and to Dr. J. Prost for valuable discussions and comments.
References
[1] LANG, J. C., MORGAN, [2]
[3] [4]
[5]
[6] [7] [8] [9] [10]
[11]
R. D., J. Chem. Phys. 73 (1980) 5849. HUANG, J. S., KIM, M. W., Phys. Rev. Lett. 47 (1981) 1462. KIM, M. W., HUANG, J. S., Phys. Rev. B 26 (1982) 2703. KOTLARCHYK, M., CHEN, S. H., HUANG, J. S., Phys. Rev. A 28 (1983) 508. Roux, D., BELLOCQ, A. M., Phys. Rev. Lett. 52 (1984) 1895. ABILLON, O., CHATENAY, D., LANGEVIN, D., MEUNIER, J., J. Physique Lett. 45 (1984) L-223. HONORAT, P., ROUX, D., BELLOCQ, A. M., J. Physique Lett. 45 (1984) L-961. BELLOCQ, A. M., BOURBON, D., FOURCHE, G., LEMANCEAU, B., J. Colloid Interface Sci. 89 (1982) 427. CAZABAT, A. M., LANGEVIN, D., MEUNIER, J., POUCHELON, A., Adv. Colloid Interface Sci. 16 (1982) 175; J. Physique Lett. 43 (1982) L-89. CORTI, M., DEGIORGIO, V., ZULAUF, M., Phys. Rev. Lett. 48 (1982) 1617. CORTI, M., MINERO, C., DEGIORGIO, V., J. Phys. Chem. 88 (1984) 309. DORSHOW, R., DE BUZZACCARINI, F., BUNTON, C. A., NICOLI, D. F., Phys. Rev. Lett. 47 (1981) 1336.
[12] BEYSENS, D.,
Nato Adv.
Study
Inst. Ser. 82 72
(1982)
25.
[13] ANDERSEN, G. R., WHEELER, J. C., J. Chem. Phys. 69 (1978) 2082; J. Chem. Phys. 69 (1978) 3403. [14] WHEELER, J. C., J. Chem. Phys. 73 (1980) 5778. [15] JOHNSTON, R. G., CLARK, N. A., WILTZIUS, P., CANNELL, D. S., Phys. Rev. Lett. 54 (1985) 49. [16] GRIFFITHS, R. B., WHEELER, J. C., Phys. Rev. A 2 (1970) 1047. [17] ROUX, D., BELLOCQ, A. M., LEBLANC, M. S., Chem. Phys. Lett. 94 (1983) 156. [18] Roux, D., Thesis Bordeaux 1984, Proceedings of the International Symposium on Surfactants in Solution, Bordeaux 1984, Ed. K. L. Mittal and P. Bothorel.
[19] BRUNETTI, S., ROUX, D., BELLOCQ, A. M., FOURCHE, G., BOTHOREL, P., J. Phys. Chem. 87 (1983) 1029. [20] LEVELT, SENGERS, J. M. H., IUPAC Conference on Chemical Thermodynamics, Sept. 1982. Pure Appl. Chem. 55 (1983) 437. [21] GRIFFITHS, R. B., WHEELER, J. C., Phys. Rev. A 2 (1970) 1047. [22] CAZABAT, A. M., LANGEVIN, D., SORBA, O., J. Physique Lett. 43 (1982) L-505. ’