E3S Web of Conferences 22, 00002 (2017) ASEE17
DOI: 10.1051/e3sconf/20172200002
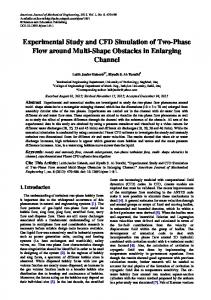
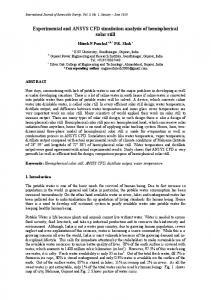
Experimental investigation and CFD simulation of multi-pipe earth-to-air heat exchangers (EAHEs) flow performance Łukasz Amanowicz1,*, and Janusz Wojtkowiak1 1Poznań University of Technology, Faculty of Civil and Environmental Engineering, ul. Berdychowo 4, 60-965 Poznan, Poland
Abstract. In this paper the experimentally obtained flow characteristics of multi-pipe earth-to-air heat exchangers (EAHEs) were used to validate the EAHE flow performance numerical model prepared by means of CFD software Ansys Fluent. The cut-cell meshing and the k- realizable turbulence model with default coefficients values and enhanced wall treatment was used. The total pressure losses and airflow in each pipe of multi-pipe exchangers was investigated both experimentally and numerically. The results show that airflow in each pipe of multi-pipe EAHE structures is not equal. The validated numerical model can be used for a proper designing of multi-pipe EAHEs from the flow characteristics point of view. The influence of EAHEs geometrical parameters on the total pressure losses and airflow division between the exchanger pipes can be also analysed. Usage of CFD for designing the EAHEs can be helpful for HVAC engineers (Heating Ventilation and Air Conditioning) for optimizing the geometrical structure of multi-pipe EAHEs in order to save the energy and decrease operational costs of low-energy buildings.
1 Introduction 1.1 Application of earth-to-air heat exchangers Earth-to-air pipe-type heat exchangers (EAHEs) are used as a part of the energy efficient ventilation systems with heat recovery, enabling additional energy recovery thanks to the accumulative properties of a ground and quite stable ground temperature at a depth of about 2 m [1]. Fresh air flows through the pipes and heats up in the winter or cools down in the summer. Its additional advantage is preventing the air-to-air heat exchanger in air-handling unit against freezing in cold and moderate climates. The simple payback time of EAHE in Italian climates can be 5–9 years [2]. Performance evaluation and life cycle cost analysis of EAHE were also done in the New Delhi (India) [3]. EAHE coupled to a photovoltaic system was investigated in Greece [4]. EAHE performance for greenhouses was investigated in Turkey [5]. The potential of EAHE for low energy cooling of buildings in Algeria was investigated in [6]. The EAHEs were also investigated in France [7]. *
Corresponding author:
[email protected]
© The Authors, published by EDP Sciences. This is an open access article distributed under the terms of the Creative Commons Attribution License 4.0 (http://creativecommons.org/licenses/by/4.0/).
E3S Web of Conferences 22, 00002 (2017) ASEE17
DOI: 10.1051/e3sconf/20172200002
1.2 Multi-pipe earth-to-air heat exchangers In buildings such as factories, markets [8], green houses [5], offices or swimming pools, for high demand of the fresh air, multi-pipe (registry type) heat exchangers are used to decrease total pressure losses and to decrease the area necessary for system installation. A proper designing of such exchangers is more complicated than single pipe structures, because much more parameters have to be taken into account. For the estimated calculations, the equal airflow division between all of parallel pipes is assumed but experimental investigations revealed the weakness of this assumption [9]. There are many papers focused on the issue of mathematical modelling of EAHEs operation [10–20]. Majority of mentioned take into account one-pipe structures of exchangers and focus attention on EAHEs thermal performance. Measuring results of pressure losses and of airflow division between parallel pipes are not presented. In this work the attention is drawn only to the EAHEs flow characteristics. Thermal performance of the EAHEs is not a field of this work. Numerical flow performance model built with CFD code (Ansys Fluent software) is validated for typical 5-pipe heat exchangers of various pipes length and various main pipes diameters.
2 Scope, experimental investigation and CFD model 2.1 Scope of investigation Both experimental and numerical investigations of earth-to-air multi-pipe heat exchanger flow performance were conducted for 5 branch-pipe exchangers having different main pipe diameters to the parallel pipe diameter ratio and different lengths of the parallel pipes: 1) dmain = d, L = 76d, 2) dmain = 2.3 d, L = 76d, 3) dmain = d, L = 271d. Those values were chosen from the typical range of use to show the influence of geometrical parameters dmain and L on the flow performance. 2.2 Experimental investigation The experimental investigations of EAHEs models in a scale 1:4 were conducted to measure the total pressure losses of EAHE and to measure the airflow in each parallel pipe. The most important data of the experimental set-up shown in Fig. 1 are summarized in Table 1. Commercial polypropylene smooth pipes were used to build the heat exchangers models.
Fig. 1. Schema of the experimental set-up.
A simple and non-invasive method for airflow measurement was implemented to avoid interaction of measuring tools with airflow in pipes. Airflow in each pipe of the exchanger
2
E3S Web of Conferences 22, 00002 (2017) ASEE17
DOI: 10.1051/e3sconf/20172200002
was calculated based on pressure losses pi at the measuring sector of each branch Li. The same method was used for total airflow Vtot calculations. Each measuring sector was located in a fully developed region produced by at least 30 diameter entrance length. Only turbulent (typical) flows were taken into account. Formula for calculation of friction factor used in this method was selected based on literature review and preliminary investigations with laboratory rotor gas-meter. Several formulas collected in [21] such as: Blasius, Walden, Haaland, Altszul, Colebrook-White, Chen, Moody, Pham, to mention only a few, were taken into account. Finally the simplest Blasius equation: = 0.3164/Re0.25 was selected. For this equation the accuracy of branch Vi (Eq. 1) and total Vtot (Eq. 2) airflow, calculated from rearranged Darcy-Weisbach formula, was estimated to be ±5% with the 95% confidence [22]. Table 1. Geometry of the experimental set-up. Symbol di dmain L [m] Lin [m] Li [m] LC-D [m] LB-D [m] L
Description internal diameter of parallel (branch) pipes internal diameter of main pipes (inflow and outflow manifolds) Length of branch pipe Length of the developing flow sector Length of measuring sector of branch pipes Length of measuring sector of main pipe Length of sector BD in case of: dmain = DN50 dmain = DN110 distance between parallel pipes 2pi d i1,25 V i 3600 0,25 0.3164 ρ Li υ
V tot
Value 0.0461 m 0.0461 m (DN50) 0.1058 m (DN110) 3.5 m 12.5 m 1.5 m 1.85 m 1.35 m 2.85 m 3.36 m 0.28 m
Dimensionless 1d 1 d (DN50) 2.3 d (DN110) 76 d 271 d 32.5 d 40.1 d 29.3 d 61.8 d 31.8 d 6d
1
1,75 π d i2 4
1,25 2p C-D d main 3600 0,25 0.3164 ρ L C- D υ
(1)
1
2 1,75 π d main 4
(2)
– air density, kg/m3,
v – air kinematic viscosity, m2/s.
The following quantities were measured during experiments (see Fig. 1): pressure losses at measuring sector for each i-branch: pi [Pa] pressure losses at measuring sector of outlet pipe: pC-D [Pa] pressure losses between A point and D point: pA-D [Pa] temperature of air: T [C] barometric pressure: p [Pa]. Total pressure losses were calculated with Eq. (3) as pressure losses between points A and D diminished by pressure losses at sector BD (Fig. 1), where a fully developed flow was assumed. Basic information about measuring equipment is presented in Table 2.
Δptot ΔpAD
3
LBD ΔpCD LCD
(3)
E3S Web of Conferences 22, 00002 (2017) ASEE17
DOI: 10.1051/e3sconf/20172200002
Table 2. Experimental apparatus and its precision. Measured value T [C] p [Pa] pi, pC-D, pA-D [Pa] L [m], Li [m], L [m]
Apparatus Laboratory thermometer Laboratory barometer Micromanometer with range 0 ÷ 50 Pa Micromanometer with range 50 ÷ 500 Pa Micromanometer with range 500 ÷ 1990 Pa Measuring tape
Precision ± 0.5 C ± 100 Pa ± 0.05 Pa ± 0.5 Pa ± 3,0 Pa ± 1.0 mm
2.3 Earth-to air multi-pipe heat exchanger CFD model The geometry of earth-to-air multi-pipe heat exchanger model was created in the ANSYS Design Modeller. Parametric run was established to generate different types of exchanger structures. The list of the parameters and the range of its variability used in numerical calculations were the same as in the experimental investigations and are given in the Table 1. The example of investigated geometry of exchanger is shown in the Fig. 2.
Fig. 2. 5-pipe heat exchanger: dmain/d = 2.3, L = 76d, L = 6d.
Geometry discretization was done with Ansys Meshing. To diminish the number of elements the “Cut Cell” method was used resulting in the most of hexahedral volumes. Tetrahedral volumes were created at the geometry intersections and in the boundary layer. The density of mesh and inflation parameters were chosen with the method of grid independent solution [23], where the mesh was improving in every next step. Automatically (program controlled) method of inflation was selected. Finally the mesh with 8 layers of inflation with fine relevance center of 50 was accepted. Further increasing of mesh elements and additional inflation layers did not change the results significantly. The k- realizable turbulence model with default coefficients values and enhanced wall treatment was used. 2.4 Effect of air heating on EAHE flow characteristics To determine the effect of air heating on the airflow division uniformity and the total pressure losses a few simulations were done. Calculations were performed for pipes with an
4
E3S Web of Conferences 22, 00002 (2017) ASEE17
DOI: 10.1051/e3sconf/20172200002
external diameter D = 50 mm, wall thickness 1.95 mm (internal diameter d = 46.1 mm), length of 76d, dmain/d = 1 and 3. Air heating was simulated assuming constant temperature of the outer surface of the pipe wall 8C and various external air temperature. Thermal conductivity of the pipe material: k = 0.22 W/(mK). The percentage differences between adiabatic (constant temperature of +20C assumed) and non-adiabatic (air heated from 20C to about 5C) CFD simulation are not higher than 7% and confirm that the effect of air heating on the airflow division and total pressure losses is negligible. Thanks to that it is possible to investigate the flow characteristics of the EAHEs without taking into consideration changes of air temperature in the exchanger.
3 CFD model validation and discussion 3.1 Pressure losses In Figs. 4 and 5, a comparison of experimental and numerical results is presented in the form of ∆p = f(Vtot). As it is seen the results are in good agreement and in general, the discrepancies are smaller than 10%. 800
p [Pa]
600 400 200 0
40
60
80
100
exp
120
140
160
Vtot [m 3 /h]
CFD
Fig. 4. Comparison of experimental and numerical investigation of total pressure losses for EAHE: 5 pipes, d = 0,0461 m, dmain = d, L = 76d, L = 6d. 800
p [Pa]
600
400 200 0
40
60
80
100
exp
120 CFD
140
160
Vtot [m 3 /h]
Fig. 5. Comparison of experimental and numerical investigation of total pressure losses for EAHE: 5 pipes, d = 0,0461 m, dmain = d, L = 271d, L = 6d.
5
E3S Web of Conferences 22, 00002 (2017) ASEE17
DOI: 10.1051/e3sconf/20172200002
3.2 Airflow division A comparison of the numerically and experimentally obtained values of airflow in the exchanger parallel pipes is shown in the Figs. 6 to 9. The results are presented in form of graphs: Vi = f(Vtot). The average difference between results of airflow calculations and airflow measurements for small flow rates is not higher than 15%. For larger flow rates the agreement of experimental and numerical results is much better. The analysis of airflow division in multi-pipe EAHEs leads to the conclusion, that the percentage share of airflow in the given branch pipe in the total airflow is approximately constant [9] within a wide range of flow rates. It should be noticed that in some structures the maximum airflow can be almost 5 times higher than the minimum one. It is a significant airflow division non-uniformity that should be taken into account in the thermal performance analysis. 30 25
Vi [m 3 /h]
20 15 10 5 0
60
80
pipe 1 (exp) pipe 1 (CFD)
100
120
pipe 2 (exp) pipe 2 (CFD)
140
160
pipe 3 (exp) pipe 3 (CFD)
180
Vtot
[m 3 /h]
Fig. 6. Comparison of experimental and numerical investigation of airflow division for EAHE: 5 pipes, d = 0,0461 m, dmain = d, L = 6d, L = 271d, pipes 1 to 3. 80
Vi [m 3 /h]
60 40 20 0
60
80
pipe 3 (exp) pipe 3 (CFD)
100
120
pipe 4 (exp) pipe 4 (CFD)
140
160
pipe 5 (exp) pipe 5 (CFD)
180
Vtot [m 3 /h]
Fig. 7. Comparison of experimental and numerical investigation of airflow division for EAHE: 5 pipes, d = 0,0461 m, dmain = d, L = 6d, L = 271d, pipes 3 to 5.
6
E3S Web of Conferences 22, 00002 (2017) ASEE17
DOI: 10.1051/e3sconf/20172200002
50
Vi [m 3 /h]
40 30 20 10 0
50
100
pipe 1 (exp) pipe 1 (CFD)
150
pipe 2 (exp) pipe 2 (CFD)
200
250
pipe 3 (exp) pipe 3 (CFD)
[m 3 /h]
Vtot
Fig. 8. Comparison of experimental and numerical investigation of airflow division for EAHE: 5 pipes, d = 0,0461 m, dmain = 2.3d, L = 6d, L = 76d, pipes 1 to 3. 60 50
Vi [m 3 /h]
40
30 20 10 0
50
100
pipe 3 (exp) pipe 3 (CFD)
150
pipe 4 (exp) pipe 4 (CFD)
200
pipe 5 (exp) pipe 5 (CFD)
250
Vtot [m 3 /h]
Fig. 9. Comparison of experimental and numerical investigation of airflow division for EAHE: 5 pipes, d = 0,0461 m, dmain = 2.3d, L = 6d, L = 76d, pipes 3 to 5.
4 Engineering application and conclusion In the designing process of EAHEs it is not only important to know the heating or cooling capacity of the device but also to predict the cost of its operation which depends on the total pressure losses. There are many geometrical parameters of EAHEs that influence both the total pressure losses and airflow division between parallel pipes. In practice the airflow division between parallel pipes is ignored in the design process although it can influence the total pressure losses, thermal performance and acoustics. The total pressure losses of different structures can differ considerably and the airflows in pipes of multi-pipe EAHE are not equal. It was shown that for the EAHEs having the
7
E3S Web of Conferences 22, 00002 (2017) ASEE17
DOI: 10.1051/e3sconf/20172200002
same diameter of the main and parallel pipes the airflow in the parallel pipe located nearest to the EAHE outflow can be more than 5 times larger than airflow in the pipe nearest to the EAHE inflow. The reason of that is the unfavorable static pressure distribution over the length of the exchanger with manifolds of constant and relatively small diameter. It means that the assumption of uniform airflow distribution among the parallel pipes is not always justified and has to be make very carefully. Validated in this paper CFD model of multi-pipe EAHE can be used for designing and optimization of the EHAE structures. The model should be especially useful in untypical cases for which simplified methods are useless.
References 1. 2. 3. 4. 5. 6. 7. 8. 9. 10. 11. 12. 13. 14. 15. 16. 17. 18. 19. 20. 21. 22. 23.
C.O. Popiel, J. Wojtkowiak, B. Biernacka, Exp. Therm. Fluid Sci. 25, 301–309 (2001) F. Ascione, L. Bellia, F. Minichiello, Renew. Energ. 36, 2177–2188 (2011) A. Chel A, G.N. Tiwari, Energ. Buildings 41, 56–66 (2009) A. Argiriou, S. Lykoudis, C. Balaras, D. Asimakopoulos, J. Sol. Energ.-T. ASME, 126, 620–625 (2004) O. Ozenger, L. Ozenger, Energ. Policy 38, 5141–5150 (2010) A. Sehil A, A. Hasni, M. Tamali, Energy Procedia 18, 496–506 (2012) S. Thiers, P. Peuportier, Sol. Energy 82, 820–831 (2008) A. Gorka, M. Szymanski, T. Mroz, Proceedings of the 34th AIVC Conference, Athens (2013) Ł. Amanowicz, J. Wojtkowiak, Central Heating, Heating, Ventilation 41, 208–212, 220 (2010) (in Polish) V. Badescu, Renew. Energ. 32, 845–855 (2007) V. Badescu, D. Isvoranu, Appl. Energ. 88, 1266–1280 (2011) V. Bansal, R. Misra, A. D. Ghansyan, J. Mathur, Energ. Buildings 42, 645–648 (2010) M. Bojić, N. Trifunovic, G. Papadakis, S. Kyritsis, Energy 22, 1151–1158 (1997) M. Cucumo, S. Cucumo, L. Montoro, A. Vulcano, Heat Mass Transfer 51, 506–516 (2008) M. De Paepe, A. Janssens, Energ. Buildings 35, 389–397 (2003) G. Florides, S. Kalogirou, Renew. Energ. 32, 2461–2478 (2007) P. Hollmuller, B. Lachal, Energ. Buildings 33, 509–518 (2001) J. Pfafferott, Energ. Buildings 35, 971–983 (2003) A. Trząski, B. Zawada, Build. Environ. 46, 1436–1444 (2011) T. Tzaferis, D. Liparakis, M. Santamouris, A. Argirion, Energ. Buildings 18, 35–43 (1992) D.C. Rennels, H.M. Hudson HM, Pipe Flow. A practical and comprehensive Guide, (John Wiley & Sons, Hoboken, New Jersey, 2012) H.W. Coleman, W.G. Steele, Experimentation and Uncertainty Analysis for Engineers (2nd Ed.), New York, John Wiley & Sons, Inc. (1999) J.H. Ferziger, M. Perić, Computational Methods for Fluid Dynamics, (Springer-Verlag second edition, 1999)
8