International Journal of Applied Science and Engineering 2011. 9, 2: 65-81
Experimental Investigation and Modeling of PMEDM Process with Chromium Powder Suspended Dielectric Kuldeep Ojha a,*, R. K. Garg a, K. K. Singh b a
Department of Industrial and Production Engineering, Dr B. R. Ambedkar National Institute of Technology, Jalandhar-144011, Punjab, India b
Department of Mechanical Engineering & Mining Machinery Engineering, Indian School of Mines (ISM), Dhanbad-826004, Jharkhand, India
Abstract: In this article, a material removal rate (MRR) and tool wear rate (TWR) study on the powder mixed electrical discharge machining (PMEDM) of EN-8 steel has been carried out. Response surface methodology (RSM) has been used to plan and analyze the experiments. Peak current, pulse on time, diameter of electrode and concentration of chromium powder added into dielectric fluid of EDM were chosen as process parameters to study the PMEDM performance in terms of MRR and TWR. Experiments have been performed on newly designed experimental setup developed in laboratory. Most important parameters affecting selected performance measures have been identified and optimum process conditions have been found. Also recommended optimal conditions have been verified by conducting confirmation experiments. Keywords: EDM; PMEDM; RSM; MRR; TWR. 1. Introduction Electrical discharge machining is an important manufacturing process for tool mould and die industries. This process is finding an increasing application for because of its ability to produce geometrically complex shapes and its ability to machine materials irrespective to their hardness. However, poor surface finish and low machining efficiency limits its further applications [5]. Powder mixed electrical discharge machining (PMEDM) is a relatively new material removal process applied to improve the machining efficiency and surface finish in presence of powder mixed dielectric fluid [2, 3, 9, 10, 19, 20, 22, 24, 27, 33, 34, 44]. Researchers have explained the working *
principle of powder mixed electrical discharge machining process [11, 44]. When a voltage is applied between the electrode and the work piece facing each other with a gap, an electric field in the range of 105–107 V/m is created. The powder particles in the spark gap get energized. These charged particles are accelerated by the developed electric field and act as conductors. The conductive particles promote breakdown in the gap and also increase the spark gap between tool and the workpiece. Under the sparking area, the particles come closer and arrange themselves in chain like structures between both the electrodes. The interlocking between the different powder particles takes place in the direction
Corresponding author; e-mail:
[email protected]
Accepted for Publication: March 21, 2010
© 2011 Chaoyang University of Technology, ISSN 1727-2394
Int. J. Appl. Sci. Eng., 2011. 9, 2
65
Kuldeep Ojha, R. K. Garg, K. K. Singh
of current flow. This chain formation helps in bridging the discharge gap between electrodes and also results in decreasing the insulating strength of the dielectric fluid. The easy short circuit takes place, causing early explosion in the gap resulting in series discharges under the electrode area. The faster sparking within a discharge occur causing faster erosion from the workpiece surface and hence the material removal rate (MRR) increases. At the same time, the added powder also modifies the plasma channel making it enlarged and widened. The sparking is uniformly distributed among the powder particles, hence electric density of the spark decreases. Due to uniform distribution of sparking among the powder particles, shallow craters are produced on the workpiece surface resulting in improvement in surface finish. 2. Literature Review Erden and Bilgin [2] has investigated the effect of abrasive powder mixed into the dielectric fluid and proposed that the machining rate increased with an increase of the powder concentration due to decreasing the time lag. Jeswani [9] have investigated the effect of addition of graphite powder to kerosene and proposed that the material removal rate was improved around 60% and electrode wear ratio was reduced about 15% by using the kerosene oil mixed with 4 g/l graphite powder. Mohri et al. [22-24], Yan and Chen [41-43], and Uno and Okada [35] have investigated the influence of silicon powder addition on machining rate and surface roughness in EDM. Wong et al. [38], Furutani et al. [3], and Yan et al. [40] have proposed that the machined surface properties, including hardness, wear resistance, and corrosion resistance could be significantly improved by using the PMEDM process. Wu [39] have discussed the improvement of the machined surface by adding aluminum powder and surfactant into dielectric fluid. Narumiya et al. [27] concluded that 66
Int. J. Appl. Sci. Eng., 2011. 9, 2
Al and Si powders yield better surface finish under specific work conditions. Kobayashi et al. [17] investigated the effects of suspended powder in dielectric fluid on MRR and SR of SKD-61 material. Uno et al. [17] have Studied the effect of nickel powder mixed working fluid modifies the surface of aluminum bronze components. Okada et al. [36] have proposed a new method for forming hard layer containing titanium carbide by EDM with carbon powder mixed fluid using titanium electrode. Chow et al. [8] have studied the EDM process by adding SiC and aluminum powders into kerosene for the micro-slit machining of titanium alloy. Wang et al. [37] have investigated the effect of Al and Cr powder mixture in kerosene. Tzeng and Lee [34] have reported the effect of various powder characteristics on EDM of SKD-11 material. Furutani and Shiraki [4] have proposed a deposition method of lubricant layer during finishing EDM process to produce parts for ultra high vacuum. Zhao et al. [44] investigated PMEDM process for rough machining. Simao [29] have explored the role of PMEDM in modifying the surface properties of the workpiece by application of Taguchi method. Pecas and Henriques [31] have Investigated the influence of silicon powder mixed dielectric on conventional EDM. The relationship between the roughness and pulse energy was roughly investigated under a few sets of the conditions in the removal process. However, the effect of the energy was not systematically analyzed. Kansal [11] worked to optimize the process parameters of PMEDM by using the response surface methodology. Çogun et al. [1] have made an experimental investigation on the effect of powder mixed dielectric on machining performance. Kansal et al. [12] have studied the effect of Silicon powder mixed EDM on machining Rate of AISI D2 Die Steel. P. Pecas and Henriques [30, 32] have investigated the effect of the electrode area in the surface roughness and topography and also the influence of the powder concentration and dielec-
Experimental Investigation and Modeling of PMEDM Process with Chromium Powder Suspended Dielectric
tric flow in the surface morphology. Prihandana et al. [6] have investigated the effect of micro-powder suspension and ultrasonic vibration of dielectric fluid in micro-EDM processes by applying the Taguchi approach. Furutani et al. [16] have investigated the influence of electrical conditions on performance of electrical discharge machining with powder suspended in working oil for titanium carbide deposition process. Kung et al. [18] have studied the influence of MRR and electrode wear ratio in the PMEDM of cobalt-bonded tungsten carbide. Kojha et al. [13] have investigated the effect of Nickel Micro Powder Suspended Dielectric on EDM Performance Measures of EN-19 Steel. Elaborate scrutiny of the literature reveals that material removal mechanism of PMEDM process is very complex and theoretical modeling of the process is very difficult. Regarding empirical results, much research work is required with more work-tool-powder-parametric combinations to make the process commercially applicable. Also, most of the research work is with Al, Si, and graphite powders. Much investigation is needed regarding other types of powder like Cr, Ni, Mo, etc. Also, EDM performance measures are influenced by electrode design [13, 15]. There is a literature gap regarding investigation of influence of electrode profile parameters on PMEDM performance measures. In present research work, different parametric combinations of peak current, duty cycle, Dia of electrode, and powder concentration of chromium in dielectric has been explored for EN- 8 steel. Literature review reveals that this combination has not been explored yet. EN-8 steel finds wide applications in fabrication of components of small cross section, requiring low tensile strength, as well as heavy forging in the normalized condition for automotive & general engineering such as axles, clutch, shafts, presses & Punches Parts, Piston rods & gear rods. Investigation of EN-8 steel with promising emerging area of PMEDM is useful in research field.
3. Description of Experiment 3.1. Experimental set-up Figure 1 Shows line diagram of experimental setup used for experimentation. The experiments have been performed on T- 3822 EDM machine manufactured by Electronica. The points considered in designing PMEDM set-up are(a) The powder should not enter the main dielectric tank to avoid filtering of powder particles (b) The dielectric should be continuously stirred or circulated to prevent settling of the powder and to maintain uniform concentration. The main dielectric sump has been disconnected from dielectric tank by valve arrangements. To obtain even and homogeneous distribution of powder particles in suspended form in dielectric, a flush mixing was provided in the tank by means of 25mm diameter plastic pipe with 03mm diameter holes in it. The dielectric was sucked from bottom level of tank by means of a pump (power- 1.5 W, and maximum discharge-5500 LPH) and was pumped into plastic pipe frame. The output from pump is divided into two parts and from one part flushing nozzle is connected. Flow through flushing nozzle is adjusted to 500 lit /hour through 4 mm opening nozzle by adjusting valve opening. 3.2.Materials used in experiments The work piece material used in this study is EN-8 steel. The chemical composition of steel as determined by optical emission spectrophotometer analysis is summarized in table 1. Other specifications of material given by manufacturer are given in table 2.
Int. J. Appl. Sci. Eng., 2011. 9, 2
67
Kuldeep Ojha, R. K. Garg, K. K. Singh
Figure 1. Line diagram of experimental setup Table 1. Chemical composition of steel C% 0.35
Si% 0.09
Mn% 0.67
S% 0.20%
P% 0.015%
Iron Rest
Table 2. Specifications of work piece material Hardening Quenching Tempering Temp Medium Temperature 750-900 Oil 150-200 Commercial copper with 99% purity (having electrical conductivity 5.69 × 10⁷ S/M) has been applied as tool electrode. By spectrophotometer analysis the composition of electrode material has been determined. Commercial kerosene has been used as dielectric fluid. The specifications have been summarized in table 3. Table 3. Pecifications of kerosene oil Dielectric Electrical Density Dynamic constant conductivity viscosity -14 1.8 1.6×10 730 0.94 m S/m Pas Also, the properties of chromium powder suspended in dielectric have been summarized in table 4.
68
Int. J. Appl. Sci. Eng., 2011. 9, 2
Experimental Investigation and Modeling of PMEDM Process with Chromium Powder Suspended Dielectric
Table 4. Specifications of powder used Particle Cr% C% size 45-55 µm
S%
P%
Si%
Al% Fe% Sieve Electrical Analysis Conductivity -325 Mesh 99% 0.01 0.015% 0.015% 0.090 0.08 0.01 97% 7.9 x 10⁶ S m-1
3.3. Experimental settings Following experimental settings has been applied in study. The selection of experimental settings is based on machine specifications, literature review and personal experience gained by trial runs. Table 5. Experimental settings Polarity
Supply Volt
Dielectric flow rate
Power factor
Machining time
Positive
415, 3phase,50 Hz
500 Lit/hr
0.3
15 minutes
3.4. Selection of response variables The status of chromium powder particles mixed into the dielectric fluid has a significant role in determining and evaluating the EDM characteristics of a product. There are many design factors to be considered concerning the effects of nickel powder particles, but in this study concentration of suspended powder particles has been taken as variable. In addition, the discharge current (IP, A) and Duty cycle (τP, %) were only taken into account as design factors. The reason why these two factors have been chosen is that they are the most general and frequently used among EDM researchers. Electrode diameter has also been selected as design factor as electrode shape parameter. 3.5. Selection of response variables The response variables selected in this study were MRR and TWR. Both MRR and TWR refer to the machining efficiency of the
PMEDM process and the wear of copper electrode, respectively, and are defined as follows. MRR (mm3/min) = (Wear weight of work piece)/ (time of machining× density of work piece material) TWR (mm3/min) = (Wear weight of tool electrode)/ (time of machining× density of electrode material) The work piece and electrode were weighed before and after each experiment using an electric balance with a resolution of 0.001 mg to determine the value of MRR and TWR. For efficient evaluation of the PMEDM process, the larger MRR and the smaller TWR are regarded as the best machining performance. Therefore, the MRR is considered as a “the larger-the-better characteristic” and the TWR is considered as “the smaller-the-better characteristic” in this experimentation. 3.6. Experimental Design
Response surface methodology (RSM) is
Int. J. Appl. Sci. Eng., 2011. 9, 2
69
Kuldeep Ojha, R. K. Garg, K. K. Singh
used in design matrix formation which is an empirical modeling approach using polynomials as the local approximations to obtain true input/output relationships . The experimental plans were designed on the basis of the central composite design (CCD) technique of RSM. The factorial portion of CCD is a full factorial design with all combinations of the factors at two levels (high, +1 and low, −1) and composed of the eight star points and six central points (coded level 0). Central points are the midpoint between the high and low levels. The star points are at the face of the cube portion on the design that corresponds to an α value of 1, and this type of design is commonly called the “face-centered CCD”. In this study, the experimental plan was conducted using the stipulated conditions according to the face-centered CCD and in-
volved a total of 30 experimental observations at four independent input variables. The machining time for each experimental specimen is 15 min. This was set up before the operation of the machine reached the stable state. The levels of design factors have been selected in accordance with literature consulted, specifications of machine as well as by personal experience gained by trial runs on machine. The design factors selected for study with their low and high levels are summarized in table 6. Design Expert 8.0.4 software was used for design of experiments, and regression and graphical analysis of data obtained. The optimum conditions have been obtained by solving the regression equations and by analyzing response surface contours.
Table 6. Process parameters and their levels Parameters Current Duty cycle (%) Powder concentration Tool Diameter
Notation Natural Coded I X1 B (%) X2 C
X3
g/l
2
4
6
D
X4
mm
8
12
16
4. Response surface modeling In this study, RSM was used to assess the relationship between responses and independent variables, in order to predict the best value of responses. RSM is useful for modeling and analysis of problems in which response of interest is influenced by several variables (Kansal et al., 2005). Central Composite Design (CCD), the most widely used approach of RSM, has been employed to determine the effect of operational variables. According to Guven et al. (2008) CCD is an effective design that is ideal for sequential 70
A %
Range and Levels -1 0 +1 4 6 8 54 63 72
Unit
Int. J. Appl. Sci. Eng., 2011. 9, 2
experimentation, as it allows reasonable amount of information to test lack of fit when a sufficient number of experimental values exist. The quantitative relationship between desired responses and independent process variables can be represented as Y= f (X1, X2, X3, ……………. Xn)
(1)
Where Y is the desired response, f is the response function and X1, X2... are independent parameters. By plotting the expected responses, a surface known as Response surface is obtained. RSM aims at approximating f by
Experimental Investigation and Modeling of PMEDM Process with Chromium Powder Suspended Dielectric
using the fitted second order polynomial regression model which is called the quadratic model. The model can be represented as follows: n Y=C0+
n
∑ C X +∑ d X i
n
i
i
2
±€
(2)
I=1 i=1 C0, Ci, di are constant coefficients and € is experimental error. 5. Discussions 30 experimental runs have been conducted and values of MRR, TWR, and SR along with design matrix are given in Table 7 to avoid any systematic error creeping into system. Analysis of variance (ANOVA) is performed on collected data for testing significance of regression model and model coefficients. 5.1. Analysis of MRR
The fit summery table formed recommended quadratic model as statically significant for MRR analysis. The results of quadratic model in form of ANOVA are given in Table 8. The Model F-value of 4.08 implies the model is significant. There is only a 0.53% chance that a "Model F-Value" this large could occur due to noise. Values of "Prob > F" less than 0.0500 indicate model terms are significant. In this case A (current), and C (concentration) are significant model terms. Values greater than 0.1000 indicate the model terms are not significant. The result shows that the current and powder concentration are the most significant factor affecting the MRR. The "Lack of Fit F-value" of 74.85 implies the Lack of Fit is significant. There is a 0.01% chance that a "Lack of Fit F-value" this large could occur due to noise. Significant lack of fit is not good -- we want the model to fit. The "Pred R-Squared" is -0.2136. A negative
"Pred R-Squared" implies that the overall mean is a better predictor of response than the current model. "Adeq Precision" measures the signal to noise ratio. A ratio greater than 4 is desirable. Model ratio of 7.261 indicates an adequate signal. This model can be used to navigate the design space. If there are many insignificant model terms (not counting those required to support hierarchy), model reduction may improve the model. To fit the quadratic model for MRR appropriate, the non significant terms are eliminated by backward elimination process. The ANOVA Table for the reduced quadratic model for MRR is shown in table 9. The Model F-value of 14.61 implies the model is significant. There is only 0.01% chance that a "Model F-Value" this large could occur due to noise. Values of "Prob > F" less than 0.0500 indicate model terms are significant. In this case A, C, D2 are significant model terms. P-Values greater than 0.1000 indicate the model terms are not significant. If there are many insignificant model terms (not counting those required to support hierarchy), model reduction may improve the model. The "Lack of Fit F-value" of 46.88 implies the Lack of Fit is significant. There is a 0.02% chance that a "Lack of Fit F-value" this large could occur due to noise. Significant lack of fit is good -- we want the model to fit. The "Pred R-Squared" of 0.5933 is in reasonable agreement with the "Adj R-Squared" of 0.7012. "Adeq Precision" measures the signal to noise ratio. A ratio greater than 4 is desirable. The ratio of 11.390 indicates an adequate signal. This model can be used to navigate the design space. It is noticed that the residuals are falling on a straight line, which means that the errors are normally distributed as shown in Figure 2. Further, each observed value is compared with the predicted value calculated from the model in Figure 3. The plot is randomly scattered (constant range of residuals across the Int. J. Appl. Sci. Eng., 2011. 9, 2
71
Kuldeep Ojha, R. K. Garg, K. K. Singh
graph.) as desired. Thus the regression model is fairly well fitted with the observed values. After eliminating the non-significant terms, the final response equation for MRR is given as follows: Final Equation in Terms of Coded Factors: Final Equation in Terms of Coded Factors: MRR =+9.19+2.61A+1.16 C+0.35
D+0.75 A C-2.54 D2 (3) Final Equation in Terms of Actual Factors: MRR = -20.35264+0.55840× Current0.53809× Powder concentration+3.89139 × Tool Diameter+0.18672 × Current × Powder concentration-0.15854 × Tool Diameter2 (4)
Table 7. Experimental design matrix and collected data Run No
X1
1 2 3 4 5 6 7 8 9 10 11 12 13 14 15 16 17 18 19 20 21 22 23 24 25 26 27 28 29 30
0 +1 0 -1 0 0 -1 +1 +1 0 +1 +1 -1 -1 +1 +1 0 +1 +1 0 0 -1 -1 0 -1 0 -1 0 0 -1
72
Coded values X2 X3 X4 0 0 0 -1 0 0 0 +1 +1 0 +1 -1 -1 -1 -1 +1 0 -1 -1 -1 +1 +1 +1 0 +1 0 -1 0 0 +1
0 0 0 -1 0 -1 0 -1 -1 0 +1 -1 +1 -1 -1 +1 0 +1 +1 -1 -1 -1 +1 +1 +1 0 +1 0 0 -1
0 0 +1 -1 0 0 0 +1 -1 0 +1 +1 +1 +1 -1 -1 0 -1 +1 0 0 -1 +1 +1 -1 0 -1 0 -1 +1
I (A) 6 8 6 4 6 6 4 8 8 6 8 8 4 4 8 8 6 8 8 6 6 4 4 6 4 6 4 6 6 4
Int. J. Appl. Sci. Eng., 2011. 9, 2
Natural Values B C D (%) (g/l) (mm) 63 4 12 63 4 12 63 4 16 54 2 8 63 4 12 63 2 12 63 4 12 72 2 16 72 2 8 63 4 12 72 6 16 54 2 16 54 6 16 54 2 16 54 2 8 72 6 8 63 4 12 54 6 8 54 6 16 54 4 12 72 4 12 72 2 8 72 6 16 63 6 12 72 6 8 63 4 12 54 6 8 63 4 12 63 4 8 72 2 16
Responses MRR TWR 3 (mm /min) (mm3/min) 9.07 0.041 8.13 0.038 6.62 0.031 2.19 0.033 9.43 0.035 8.69 0.025 9.87 0.034 8.94 0.029 7.4 0.039 9.69 0.033 15.01 0.035 5.04 0.038 4.98 0.014 4.94 0.015 8.84 0.044 9.65 0.037 9.67 0.035 10.59 0.035 11.78 0.031 9.79 0.032 8.58 0.034 2.68 0.014 3.69 0.019 7.98 0.028 4.24 0.028 9.86 0.031 3.78 0.027 9.56 0.036 7.43 0.037 2.02 0.024
Experimental Investigation and Modeling of PMEDM Process with Chromium Powder Suspended Dielectric
Table 8. ANOVA table for MRR (before backward elimination)
Source Model A-Current B-Duty cycle (%) C-Powder concentraD-Tool Diameter AB AC AD BC BD CD A^2 B^2 C^2 D^2 Residual Lack of Fit Pure Error Cor Total Std. Dev. 1.94 Mean 7.67 C.V. % 5.30 PRESS 329.66
Sum of Mean Squares df Square 215.13 14 15.366 122.67 1 122.670 0.004 1 0.00435 24.40 1 24.406 2.149 1 2.149 4.010 1 4.010 8.925 1 8.925 0.150 1 0.150 0.127 1 0.127 1.182 1 1.182 3.394 1 3.394 0.0119 1 0.011 0.035 1 0.035 1.391 1 1.391 10.81 1 10.81 56.50 15 3.769 56.130 10 5.6134 0.374 5 0.074 271.642 29 R-Squared 0.7920 Adj R-Squared 0.5978 Pred R-Squared -0.2136 Adeq Precision 7.261
F-Value 4.079 32.564 0.0011 6.479 0.570 1.064 2.369 0.0398 0.0339 0.313 0.901 0.0031 0.0094 0.369 2.870
Prob > F 0.0053 < 0.0001 0.9733 0.0224 0.4617 0.3185 0.1446 0.8444 0.8563 0.5835 0.3575 0.9558 0.9239 0.5524 0.1109
74.854
< 0.0001
significant
significant
Table 9. ANOVA table for MRR (after backward elimination) Sum of Mean F Source Squares df Square Value Model 204.480 5 40.896 14.614 A-Current 122.676 1 122.670 43.835 C-Powder concentra- 24.406 1 24.406 8.721 D-Tool Diameter 2.149 1 2.149 0.768 AC 8.925 1 8.925 3.189 D^2 46.329 1 46.329 16.555 Residual 67.161 24 2.798 Lack of Fit 66.786 19 3.515 46.876 Pure Error 0.374 5 0.0749 Cor Total 271.642 29 Std. Dev. 1.67 R-Squared 0.7528 Mean 7.67 Adj R-Squared 0.7012 C.V. % 21.81 Pred R-Squared 0.5933 PRESS 110.47 Adeq Precision 11.390
p-value Prob > F < 0.0001 < 0.0001 0.0069 0.3895 0.0868 0.0004 0.0002
significant
significant
Int. J. Appl. Sci. Eng., 2011. 9, 2
73
Kuldeep Ojha, R. K. Garg, K. K. Singh
Figure 2. Normal probability plot residuals for MRR.
Figure 4. Response surface for MRR showing current and tool diameter
Figure 6. Response surface for MRR showing effect of current and duty cycle 74
Int. J. Appl. Sci. Eng., 2011. 9, 2
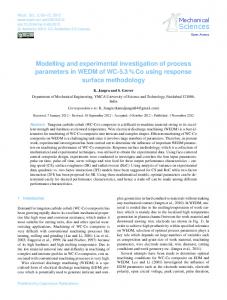
Figure 3. Plot of actual vs. predicted response of MRR data.
Figure 5. Response surface for MRR showing effect of effect of current and powder concentration Figure 4, Figure 5 and Figure 6 shows the estimated response surface for MRR in relation to the design parameters of peak current with tool diameter, powder concentration and duty cycle. As can be seen from these figures, the MRR tends to increase, considerably with increase in current for any value of other factors. Hence, maximum MRR is obtained at high current. The MRR increases with increase in tool diameter owing to increase in current. After certain level of range of 12 mm, the MRR tends to decrease due to inefficient
Experimental Investigation and Modeling of PMEDM Process with Chromium Powder Suspended Dielectric
flushing. MRR is found to increase with duty cycle and powder concentration. Powder concentration has much significant effect on TWR. 5.2. Analysis of TWR The fit summery table formed for TWR recommends quadratic model as statically significant analysis. The results of quadratic model in form of ANOVA are given in Table 10. The Model F-value of 4.88 implies the model is significant. There is only a 0.21% chance that a "Model F-Value" this large could occur due to noise. Values of "Prob > F" less than 0.0500 indicate model terms are significant. In this case A, D, C2 are significant model terms. P-values greater than 0.1000 indicate the model terms are not significant. The "Lack of Fit F-value" of 2.22 implies the Lack of Fit is not significant relative to the pure error. There is a 19.55% chance that a "Lack of Fit F-value" this large could occur due to noise. Non-significant lack of fit is good as we want the model to fit. A negative "Pred R-Squared" implies that the overall mean is a better predictor of your response than the current model. "Adeq Precision" measures the signal to noise ratio. A ratio greater than 4 is desirable. The ratio of 9.054 indicates an adequate signal. This model can be used to navigate the design space. Again, if there are many insignificant model terms, model reduction may improve the model. To fit the quadratic model for TWR appropriate, the non significant terms are eliminated by backward elimination process. The ANOVA Table for the reduced quadratic model for TWR is shown in table 11. The final TWR Model F-value of 12.64 implies the model is significant. There is only a 0.01% chance that a "Model F-Value" this large could occur due to noise. Values of "Prob > F" less than 0.0500 indicate model
terms are significant. In this case A, D, BC, C2 are significant model terms. Values greater than 0.1000 indicate the model terms are not significant. The "Lack of Fit F-value" of 1.48 implies the Lack of Fit is not significant relative to the pure error. There is a 35.28% chance that a "Lack of Fit F-value" this large could occur due to noise. Non-significant lack of fit is good since we want the model to fit. The "Pred R-Squared" of 0.5583 is in reasonable agreement with the "Adj R-Squared" of 0.7375. "Adeq Precision" measures the signal to noise ratio. A ratio greater than 4 is desirable. The ratio of 14.027 indicates an adequate signal. The model for TWR can be used to navigate the design space. It is again noticed that the residuals are falling on a straight line for same model, which means that the errors are normally distributed as shown in Figure 7. Further, each observed value is compared with the predicted value calculated from the model in Figure 8. The plot is randomly scattered as desired. Thus the regression model is fairly well fitted with the observed values. After eliminating the non-significant terms, the final response equation for MRR is given as follows: Final Equation in Terms of Coded Factors: TWR=+0.035+6.556E-003A-5.556E-004B-3. 889E-004C-3.222E-003D+2.250E-003BC -6.139E-003C2 (5) Final Equation in Terms of Actual Factors: TWR=+0.075736+3.27778E-003×Current-1 .18673E-003×Dutycycle(%)+4.20833E-003× Powder concentration-4.08681E-003×Tool Diameter+1.25000E-004×Duty cycle (%)× Powder concentration+5.20833E-005× Duty cycle(%) × ToolDiameter - 1.53472E- 003× (6) Powder-concentration2 Figure 9, Figure 10 and Figure 11 shows the estimated response surface for TWR in relation to the design parameters of peak current with tool diameter, powder concentration and duty cycle. As can be seen from these figures, the TWR tends to increase, considerably with increase in current for any value Int. J. Appl. Sci. Eng., 2011. 9, 2
75
+
Kuldeep Ojha, R. K. Garg, K. K. Singh
of other factors. Hence, maximum TWR is obtained at high current. The TWR decreases with increase in tool diameter however tool diameter has not so significant effect on TWR. TWR is found to increase with duty cycle. Long duty cycle results in less time for removal of gases produced and accumulated resulting in reduced TWR. Increase in powder
concentration results in higher TWR but after certain level TWR starts reducing. The error between experimental and predicted values for MRR and TWR are lie within ±8.5%. This confirms excellent reproducibility of the experimental conclusions.
Table 11. ANOVA table for TRR (after backward elimination)
Source Model A-Current B-Duty cycle (%) C-Powder concentration D-Tool Diameter BC BD C^2 Residual
Sum of Squares 0.001377 0.000774 5.56E-06
df 7 1 1
Mean Square 0.000196759 0.000773556 5.55556E-06
F Value 12.63647 49.68018 0.356795
p-value Prob > F < 0.0001 < 0.0001 0.5564
2.72E-06 0.000187 0.000081 5.63E-05 0.000271 0.000343
1 1 1 1 1 22
2.72222E-06 0.000186889 0.000081 0.00005625 0.000271339 1.55707E-05
0.17483 12.00259 5.202076 3.612553 17.42624
0.6799 0.0022 0.0326 0.0705 0.0004
Lack of Fit 0.000286 Pure Error 5.68E-05 Cor Total 0.00172 Std. Dev. 3.946 E-003 Mean 0.031 C.V. % 12.70 PRESS 7.597 E-004
17 1.68072E-05 5 1.13667E-05 29 R-Squared Adj R-Squared Pred R-Squared Adeq Precision
1.478638
0.3528
significant
not significant
0.8008 0.7375 0.5583 14.027
Table 12. Data for confirmation tests Exp . No
Parameter settings MRR TWR CurDuty Powder Tool rent cycle conDiameExp. Pred. ErExp. Pred. Ercentrater ror% ror tion % 1 4 54 6 12 6.87 7.00 -1.89 0.018 0.019 -5.55 2 8 72 2 8 7.46 7.01 6.03 0.037 0.034 8.10 3 6 63 4 12 9.29 9.19 1.08 0.033 0.034 3.03 4 4 54 2 16 3.77 3.974 -5.41 0.021 0.020 4.76 5 6 63 4 8 6.39 6.31 1.25 0.037 0.037 0.00 5 confirmation experiments have been conducted to check the validity of developed models. Results are given in table 12. It can be observed that the calculated error is small and tolerable. 76
Int. J. Appl. Sci. Eng., 2011. 9, 2
Experimental Investigation and Modeling of PMEDM Process with Chromium Powder Suspended Dielectric
Figure 7. Normal probability plot residuals for TWR
Figure 8. Plot of actual vs. predicted response of TWR data
Figure 9. Response surface for TWR showing effect of current and powder concentration
Figure 10. Response surface for TWR showing effect of current and duty cycle
Int. J. Appl. Sci. Eng., 2011. 9, 2
77
Kuldeep Ojha, R. K. Garg, K. K. Singh
Figure 11. Response surface for TWR showing effect of current and tool diameter 6. Conclusions In this article quantitative analysis of machinability of EN-8 steel has been carried out. The quadratic models of MRR and TWR have been evaluated to correlate the selected design factors. The experimental research work has been carried out intended to the generation of knowledge related to PMEDM process. Chromium powder particles are mixed in EDM dielectric fluid. Empirical modeling with the help of RSM led to following conclusions(a) Current, powder concentration and electrode diameter are significant factors affecting both MRR and TWR. Both the performance measures were observed an increasing trend with increase in current for any other settings of parameters. (b) MRR shows increasing trend for increase in powder concentration. The trend shows that MRR will increase further with further increase in concentration. (c) TWR increase with lower range of powder concentration but than decrease. (d) The influence of duty cycle is insignificant on MRR for the range of parameters selected for experimentation. 78
Int. J. Appl. Sci. Eng., 2011. 9, 2
(e) Maximum MRR is observed for a tool diameter of 12 mm. MRR shows decreasing trend both below and above 12 mm tool diameter range. (f) Increase in tool diameter results in decreasing tool wear. (g) The confirmation tests showed that the error between experimental and predicted values of MRR and SR are within permissible range. (h) Empirical modeling of the process led to development of quadratic equations for both performance measures. The research work adds valuable data regarding PMEDM process. However more workpiece/ powder/ electrode materials/ experimental settings combinations are needed to be investigated further for much validation of the process. References [ 1] Cogun, C., Ozerkan, B., Karacay, T. 2006. An experimental investigation on the effect of powder mixed dielectric on machining performance in electrical discharge machining. Proceedings of the Institution of Mechanical Engineers, Part B: Journal of Engineering Manufacture 220 Part B, 220: 1035-1050.
Experimental Investigation and Modeling of PMEDM Process with Chromium Powder Suspended Dielectric
[ 2] Erden, A. and Bilgin, S. 1980. Role of impurities in electric discharge machining. in: Proceedings of the 21st International Machine Tool Design and Research Conference, Macmillan, London, 345-350. [ 3] Furutani, K., Saneto, A., Takezawa, H., Mohri, N., and Miyake, H. 2001. Accertation of titanium carbide by electrical discharge machining with powder suspended in working fluid. Precision Engineering, 25: 138-144. [ 4] Furutani, K. and Shiraki, K. 2002. Deposition of lubricant layer during finishing process by electrical discharge machining with molybdenum disulphide powder suspended in working fluid. in: JSME/ ASME International Conference on Materials and Processing, 468-473. [ 5] Garg, R. K., Singh, K. K., Sachdeva, A., Sharma, V., and Ojha, K. 2010. Review of research work in sinking EDM and WEDM on metal matrix composite materials. The International Journal of Advanced Manufacturing Technology, 50, 5-8, 611-624. [ 6] Prihandana, G. S., Mahardika, M., Hamdi, M., Wong, Y. S., and Mitsui, K. 2009. Effect of micro-powder suspension and ultrasonic vibration of dielectric fluid in micro-EDM processes-Taguchi approach. International Journal of Machine Tools and Manufacture, 49, 10351041. [ 7] Guven, G., Perendeci, A., Tanyolac, A., and Hazard, J. 2008. Mater. 151, 69-78. [ 8] Chow, H. M., Yan, B. H., Huang, F. Y. and Hung, J., C. 2000. Study of added powder in kerosene for the micro-slit machining of titanium alloy using electro-discharge machining. Journal of Materials Processing Technology, 101: 95103. [ 9] Jeswani, M. L. 1981. Effects of the addition of graphite powder to kerosene used as the dielectric fluid in electrical discharge machining. Wear, 70: 133-139.
[10] Kansal, H. K., Singh, S., and Kumar, P., 2003. State of the art concerning powder mixed EDM. in: Proceedings of the International Conference on Emerging Technology (ICET-2003) KIIT, Bhubansewar, India. [11] Kansal, H. K., Singh, S., and Kumar, P. 2005. Parametric optimization of powder mixed electrical discharge machining by response surface methodology. Journal of Materials Processing Technology, 169, 427-436. [12] Kansal, H. K., Singh, S., and Kumar, P. 2007. Effect of Silicon powder mixed EDM on machining rate of AISI D2 die Steel. Journal of Manufacturing Processes, 9, 1: 13-22. [13] Ojha, K., Garg, R. K., and Singh, K. K. 2011. The Effect of Nickel Micro Powder Suspended Dielectric on EDM Performance Measures of EN-19 Steel. Journal of Engineering and Applied Sciences, 6, 1: 27-37. [14] Ojha, K., Garg, R. K., and Singh, K. K. 2011. An overview of technology and research in electrode design and manufacturing in sinking electrical discharge machining. Journal of Engineering science and Technology review (Accepted for publication-In press) [15] Ojha, K., Garg, R. K., and Singh, K. K., 2010. MRR Improvement in Sinking Electrical Discharge Machining: A Review. Journal of Minerals and Materials Characterization and Engineering, 9, 8: 709-739. [16] Furutani, K., Sato, H., and Suzuki, M. 2009. Influence of electrical conditions on performance of electrical discharge machining with powder suspended in working oil for titanium carbide deposition process. International Journal of Advanced Manufacturing Technology, 40: 1093-1101. [17] Kobayashi, K., Magara, T., Ozaki, Y., and Yatomi, T., 1992. The present and future developments of electrical disInt. J. Appl. Sci. Eng., 2011. 9, 2
79
Kuldeep Ojha, R. K. Garg, K. K. Singh
[18]
[19]
[20]
[21]
[22]
[23]
[24]
[25] [26] [27]
80
charge machining, in: Proceedings of 2nd International Conference on Die and Mould Technology, Singapore, 35-47. Kung, K. Y., Horng, J. T., and Chiang, K. T., 2009. Material removal rate and electrode wear ratio study on the powder mixed electrical discharge machining of cobalt-bonded tungsten carbide, Journal of Advanced Manufacturing Technology, 40: 95-104. Kunieda, M. and Yanatori, K. 1997. Study on debris movement in EDM gap. International Journal of Electrical Machining, 2, 43-49. Luo, Y. F. 1997. The dependence of interspace discharge transitivity upon the gap debris in precision electro-discharge machining. Journal of Materials Processing Technology, 68: 127-131. Mohri, N. 1985. Mirror-like finishing by EDM. in: Proceedings of the 25th International Symposium on Machine Tool Design and Research: 329-336. Mohri, N., Tsukamoto, J., Fujino, M. and 1985. Mirror-like finishing by EDM. in: Proceedings of the 25th International Symposium on Machine Tool Design and Research: 329-336. Mohri, N., Tsukamoto, J., and Fujino, M. 1988. Surface modification by EDM-an innovation in EDM with semi-conductive electrodes. in: Proceedings of Winter Annual Meet ASME, 34: 21-30. Mohri, N., Saito, N., and Higashi, M. A. 1991. A new process of finish machining on free surface by EDM methods. CIRP Annals - Manufacturing Technology, 40, 1: 207-210. Montgomery, D. C. 1997. Design and Analysis of Experiments. fourth ed., Wiley, New York. Narumiya, H. 1989. EDM by powder suspended working fluid, in: Proceedings of the 9th ISEM, 5-8. Narumiya, H., Mohri, N., Saito, N., Otake, H., Tsnekawa, Y., Takawashi, T., and Kobayashi, K., 1989. EDM by powInt. J. Appl. Sci. Eng., 2011. 9, 2
[28]
[29]
[30]
[31]
[32]
[33]
[34]
[35]
der suspended working fluid, in: Proceedings of 9th ISEM, 5-8. Okada, A., Uno, Y., Hirao, K. 2000. Formation of hard layer by EDM with carbon powder mixed fluid using titanium electrode, in: Proceedings of 5th International Conference on Progress of Machining Technology, 464-469. Simao, J. 2003. Work piece surface modification using electrical discharge machining, International Journal of Machine Tools and Manufacture, 43: 121-128. Peças, P. and Henriques,E. 2008. Effect of the powder concentration and dielectric flow in the surface morphology in electrical discharge machining with powder-mixed dielectric (PMD-EDM). Journal of Advanced Manufacturing Technology, 37: 1120-1132. Pecas, P. and Henriques, E. A. 2003. Influence of silicon powder mixed dielectric on conventional electrical discharge machining. International Journal of Machine Tools and Manufacture, 43: 1465- 1471. Peças, P. and Henriques, E. 2008. Electrical discharge machining using simple and powder-mixed dielectric: The effect of the electrode area in the surface roughness and topography. Journal of materials processing technology, 200: 250-258. Tzeng, F. Y. and Chen, F. 2003. A simple approach for robust design of high speed electrical-discharge machining technology. International Journal of Machine Tools and Manufacture, 43, 217-227. Tzeng, Y. F. and Lee, C. Y. 2001 Effects of powder characteristics on electro discharge machining efficiency. Journal of Advanced Manufacturing Technology, 17, 586-592. Uno, Y. and Okada, A. 1997. Surface generation mechanism in electrical discharge machining with silicon powder mixed fluid. International Journal of
Experimental Investigation and Modeling of PMEDM Process with Chromium Powder Suspended Dielectric
[36]
[37]
[38]
[39]
[40]
[41]
[42]
[43]
Electrical Machining, 2, 13-18. Uno, Y., Okada, A., Hayashi, Y., and Tabuchi, Y. 1998. Surface integrity in EDM of aluminum bronze with nickel powder mixed fluid. Journal of the Japan Society of Mechanical Engineers, 32, 70: 24-31 (in Japanese). Wang, C. H., Lin, Y. C., Yan, B. H., and Huang, F. Y. 2001. Effect of characteristics of added powder on electrical discharge machining. Journal of Japan Institute of Light Metals, 42, 12: 2597-2604. Wong, Y. S., Lim, L. C., Rahuman, I., and Tee, W. M. 1998. Near-mirror-finish phenomenon in EDM using powder-mixed dielectric. Journal of Advanced Manufacturing Technology, 79: 30-40. Wu, K. L., Yan, B. H., Huang, F. Y., and Chen, S. C. 2005. Improvement of surface finish on SKD steel using electro-discharge machining with aluminum and surfactant added dielectric. Journal of Machine Tools and Manufacture, 45: 1195-1201. Yan, B. H., Lin, Y. C., Huang, F. Y., and Wang, C. H. 2004. Surface modification of SKD 61 during EDM with metal powder in the dielectric. Materials Transactions, 42, 12: 2597-2604. Yan, B. H. and Chen, S. L. 1993. Effects of dielectric with suspended aluminum powder on EDM, Journal of the Chinese Society Mechanical Engineers, 14, 3: 307-312. Yan, B. H. and Chen, S. L. 1994. Characteristics of SKD11 by complex process of electric discharge machining using liquid suspended with aluminum powder. Journal of Japan Institute of Light Metals, 58, 9: 1067-1072. Yan, B. H. and Chen, S. L. 1994. Effect of ultrasonic vibration on electrical discharge machining characteristics of Ti–6Al–4V alloy. Journal of Japan Institute of Light Metals, 44, 5: 281-285.
[44] Zhao, W. S., Meng, Q. G., and Wang, Z. L. 2002. The application of research on powder mixed EDM in rough machining”, Journal of Materials Processing Technology, 129: 30-33.
Int. J. Appl. Sci. Eng., 2011. 9, 2
81