JOURNAL OF APPLIED PHYSICS
VOLUME 92, NUMBER 7
1 OCTOBER 2002
Experimental observation of scaling laws for alternating current and direct current conductivity in polymer-carbon nanotube composite thin films B. E. Kilbride and J. N. Colemana) Department of Physics, Trinity College Dublin, Dublin 2, Ireland
J. Fraysse Max-Planck Institut fu¨r Festko¨rperforschung, Heisenbergstrasse 1, D-70569 Stuttgart, Germany
P. Fournet, M. Cadek, A. Drury, and S. Hutzler Department of Physics, Trinity College Dublin, Dublin 2, Ireland
S. Roth Max-Planck Institut fu¨r Festko¨rperforschung, Heisenbergstrasse 1, D-70569 Stuttgart, Germany
W. J. Blau Department of Physics, Trinity College Dublin, Dublin 2, Ireland
共Received 7 May 2002; accepted for publication 19 July 2002兲 Alternating current 共ac兲 and direct current 共dc兲 conductivities have been measured in polymer-nanotube composite thin films. This was carried out for a range of concentrations of multiwall nanotubes in two polymer hosts, poly共m-phenylenevinylene-co-2,5-dioctyloxyp-phenylenevinylene兲 共PmPV兲 and polyvinylalcohol 共PVA兲. In all cases the dc conductivity DC was ohmic in the voltage range studied. In general the ac conductivity displayed two distinct regions, a frequency independent region of magnitude 0 at low frequency and a frequency dependent region at higher frequency. Both DC and 0 followed a percolation scaling law of the form ⬀( p⫺p c ) t with p c ⫽0.055% by mass and t⫽1.36. This extrapolates to a conductivity of 1⫻10⫺3 S/m for 100% nanotube content. Such a low value reflects the presence of a thick polymer coating, resulting in poor electrical connection between tubes. This leads to the suggestion that charge transport is controlled by fluctuation induced tunneling. In the high frequency regime the conductivity increases with frequency according to an approximate power law with exponent s⬇0.92, indicative of hopping transport. The onset of this frequency independent conductivity scales with mass fraction for the PmPV composite due to the variation of correlation length with nanotube content. This behavior is discussed in terms of a biased random walk in three dimensions. In addition ac universality is demonstrated by the construction of a mastercurve. © 2002 American Institute of Physics. 关DOI: 10.1063/1.1506397兴
I. INTRODUCTION
traditional organic electronic devices such as light emitting diodes.5,6 Additionally the possibility of producing highly conductive thin films suggests nanotubes may be useful as passive components such as electromagnetic interference shielding materials or antistatic coatings. In recent years blends of conducting materials in insulating hosts have been extensively studied because of their importance in both basic and applied science.7–9 Most of this work has focused on polymer hosts such as poly共methyl methacrylate兲 or polyvinylalcohol 共PVA兲 filled with materials such as carbon black, carbon fibers, and conductive polymers such as polyaniline. In these systems electronic conductivity can be increased by up to 10 orders of magnitude with relatively low filler concentrations. This is significant as it allows the retention of the intrinsic matrix properties such as flexibility. The lowest filler concentration needed for macroscopic conductivity increase 共i.e., formation of an electrical pathway through the sample兲 is described by the percolation threshold, which has been observed to be as low as 0.035% by volume for some polymer blends.10 For economic reasons, the achievement of extremely low percolation thresholds is important and has been a driving force behind much
Over the last 10 yr carbon nanotubes1 have generated much interest, partly due to their electronic properties. Single walled nanotubes have been shown, both theoretically and experimentally, to display either semiconducting or metallic properties, depending on how they are rolled up.2 In comparison multiwalled nanotubes 共MWNTs兲 have a more complex structure, but are expected to be good conductors as their large external diameter suggests the existence of a very small band gap for the semiconducting variety. While nanotube purity and processability have been a problem in the past, these issues have recently been addressed with some success.3,4 Self-purifying polymer nanotube composite solutions can now be routinely made, allowing thin films to be fabricated using traditional techniques such as spin coating.5 This has allowed the characterization of the electronic properties of the composite films themselves and the study of their potential as field injection and charge transport layers in a兲
Author to whom correspondence should be addressed; electronic mail:
[email protected]
0021-8979/2002/92(7)/4024/7/$19.00
4024
© 2002 American Institute of Physics
Downloaded 01 Jul 2010 to 134.226.1.229. Redistribution subject to AIP license or copyright; see http://jap.aip.org/jap/copyright.jsp
Kilbride et al.
J. Appl. Phys., Vol. 92, No. 7, 1 October 2002
of this research. To this end, it has been shown both experimentally and theoretically that percolation thresholds decrease significantly as the aspect ratio of the filler particles increases.11 Thus fibril shaped filler particles such as conductive polymers have been an attractive choice in recent years. This fact suggests that carbon nanotubes, with their high conductivity and high aspect ratio, are ideal candidates as conductive fillers in percolative systems. In this work we have studied the electrical properties of two composite systems formed from a conjugated polymer poly共m-phenylenevinylene-co-2,5-dioctyloxy-p-phenylenevinylene兲 共PmPV兲 and a nonconjugated polymer PVA, both filled with various concentrations p of multiwalled nanotubes in the range 0.037%⬍p⬍4.3% by mass. We have measured the dc conductivity of these composites as a function of nanotube content, allowing us to determine the percolation threshold p c and the conductivity exponent t. The increase in conductivity is discussed in relation to the fluctuation induced tunneling model. Finally we have measured the conductivity of these composites as a function of frequency. These data are discussed in terms of hopping conductivity in the form of a biased random walk. Scaling was applied to construct a master curve suggesting universal ac conductivity in these materials. II. EXPERIMENTAL PROCEDURE
The polymers used in this study were PmPV, which was synthesized here in Trinity College Dublin12 and PVA which was purchased from Aldrich and used as supplied. The multiwalled carbon nanotubes were produced in Trinity by the Kraetschmer arc discharge method13,14 and used without further treatment. Composite solutions were prepared by adding this Kraetschmer generated powder to 20 g/l solutions of PmPV and PVA in their respective solvents, toluene and water. These were then sonicated with a high power sonic tip for 1 min and then subsequently in a low power sonic bath for 1 h. The solutions were then allowed to stand undisturbed for 24 h to let any non-nanotube impurities sediment out. Decantation then yielded composite solutions free from graphitic impurities as described by Coleman et al.3,4 Electron paramagnetic resonance was then used to show that only polymer and MWNTs remained in solution after settling and decantation.3,4 Various lower mass fraction solutions were prepared by blending these composite solutions with pure polymer solutions in the required ratios. Thermogravimetric analysis was used to calculate the nanotube concentration in each composite solution.3 This technique also established that the PmPV decanted solution held significantly more nanotube material 共⬃7.5 times兲 than PVA. The substrates used were 12⫻12⫻1 mm glass squares which had been thoroughly cleaned by a process of sonication in decon 90, rinsing in de-ionized water, sonication in acetone followed by boiling in isopropanol. Substrates were dried by blowing compressed air across them. Aluminum bottom electrodes were evaporated onto these substrates under high vacuum conditions 共⬃5⫻10⫺6 mbar). Films were spin coated onto these contacts using a Convac 1001 spin coater and subsequently dried in a vacuum oven at 40 °C.
4025
Six aluminum top finger contacts were then evaporated onto the films yielding six sandwich structure devices with an active area of 5 mm2 . It should be noted that while sample preparation conditions were identical for both PmPV and PVA samples, morphological differences are expected due to the different nature of host polymer and solvent. Average film thicknesses for PmPV and PVA devices were 83 and 80 nm, respectively, as determined by Dektak surface profilometry. Contact was made to the electrodes using pressure probes and conductive silver paint. Devices were tested under a dynamic vacuum of ⬃10⫺2 mbar. dc measurements were made using a Keithley Model 2400 sourcemeter. ac measurements were made using a Zahner IM6e impedance spectrometer over a frequency range 10 Hz-1 MHz with applied alternating voltage of 50 mV. For both ac and dc testing for all samples, measurements were made on all six devices and subsequently averaged. III. RESULTS AND DISCUSSION A. dc and frequency independent ac conductivity
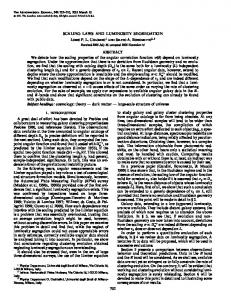
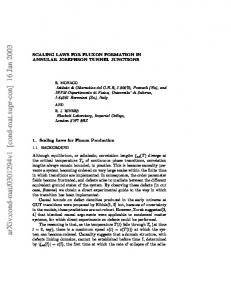
For all composite samples, both dc and ac conductivity measurements were carried out. All dc current–voltage 共I–V兲 characteristics were ohmic in the voltage range studied 共⫺0.15→0.15 V兲 and the conductivities DC were calculated from the slope of the I–V curves. The real part of the ac conductivities 共as calculated from the real part of the admittance兲 for selected nanotube concentrations are presented in Fig. 1共a兲 as a function of angular frequency for both PmPV and PVA composites. The frequency dependent conductivity for the PmPV composites can be more clearly seen in Fig. 1共b兲. Two cases must be distinguished: those with low nanotube mass fraction 共p⭐0.037%兲 and those with higher mass fraction. In the former case conductivity is frequency dependent in the frequency range studied with a slope of unity on a log–log scale. This is in good agreement with the expression ⫽ ⬙ 0 , valid for dielectric materials where is the conductivity, ⬙ is the imaginary part of the dielectric constant, is the angular frequency, and 0 is the vacuum permittivity. The higher mass fraction curves are characterized by a frequency independent conductivity 0 up to a critical frequency 0 , followed by a region of increasing conductivity. This frequency independent conductivity is indicative of nonzero dc conductivity, i.e., nondielectric behavior. This second region will be discussed later in the article. Shown in Fig. 2共a兲 are the dc conductivity DC and the frequency independent ac conductivity 0 as a function of nanotube mass fraction p for both PmPV and higher mass fraction 共nondielectric兲 PVA composites. In general, good agreement is observed between the dc and ac data with the conductivities of both composite types appearing to fall on the same curve. As the mass fraction is increased, the conductivity increases from approximately 10⫺12 S/m for the host material to over 10⫺5 S/m for the 4.3% PmPV sample, with most of the increase occurring below p⫽0.5%. Extrapolation to p⫽100% using the scaling law described below gives an approximate conductivity of 10⫺3 S/m, which is 6 orders of magnitude lower than the conductivity expected for a mat of multiwalled nanotubes.15 This discrepancy may be
Downloaded 01 Jul 2010 to 134.226.1.229. Redistribution subject to AIP license or copyright; see http://jap.aip.org/jap/copyright.jsp
4026
Kilbride et al.
J. Appl. Phys., Vol. 92, No. 7, 1 October 2002
FIG. 1. 共a兲 Frequency dependent conductivity for some of the samples studied in this work. Filled symbols represent PmPV based composites while unfilled symbols represent PVA based composites. 共b兲 Frequency dependent conductivity results for three of the PmPV composites. The shift to frequency dependent conductivity can clearly be seen above 105 rad/s. In the interest of clarity these data have been normalized to the 0 value and two of the curves shifted by 10%.
partly due to the fact that as the film thickness 共⬇80 nm兲 is much less than the length of the nanotubes 共length ⬃1–2 m, diameter ⬃15–20 nm兲, they are constrained to lie in the plain of the film, resulting in a larger effective film thickness. However this explanation cannot explain a discrepancy of 6 orders of magnitude. Alternatively, previous studies have shown that individual nanotubes in PmPV based composites tend to be coated by a thick polymer layer.16,17 This layer is thought to form in the solution phase and is responsible for the solubility of nanotubes in composite solutions. This is expected to result in poor electrical contact between individual nanotubes, resulting in lower effective conductivity. This is because the highest resistance sections in the electrical pathway, manifested by the internanotube connections, dominate the macroscopic conductivity. The second explanation seems more likely as further measurements of conductivity in the plane of the film 共not shown兲 were observed to be only marginally higher than these measurements perpendicular to the plane of the film. It should be pointed out that in plane conductivity measurements could only be carried out for high conductivity samples due to limited detection sensitivity. According to classical percolation theory the conductivity of composite materials as conductive filler content is increased can be described by a scaling law of the form
⬀ 共 p⫺p c 兲 t ,
共1兲 18
where p c is the percolation threshold. This equation is valid when p⬎ p c and 共p⫺p c ) is small. As the mass fraction increases beyond the percolation threshold the conductivity in-
FIG. 2. 共a兲 dc and frequency independent ac conductivity for all samples studied in this work. Note that conductivity increases by approximately 7 orders of magnitude up to 4.3% nanotube loading level. 共b兲 Logarithmic plot of conductivity vs reduced mass fraction. The solid line is a fit of the dc data to the percolation scaling law 关Eq. 共1兲兴 giving p c ⫽0.055% and t⫽1.36. 共c兲 Plot of the log of conductivity against p ⫺1/3. The solid line is a fit of the dc data to Eq. 3共b兲. This type of plot is indicative of fluctuation induced tunneling.
creases sharply as conductive paths begin to form. The exponent t is expected to depend on sample dimensionality with calculated values of t⬃1.33 and t⬃2.0 in two and three dimensions, respectively. It should be noted however that these values vary depending on the authors and the type of simulation used. Both ac and dc conductivities for each host polymer have been plotted logarithmically and are shown in Fig. 2. The solid line is a fit of Eq. 共1兲 to the dc data for both composites and gives p c ⫽0.055⫾0.01% by mass 共p c ⫽0.029⫾0.01% by volume兲 and t⫽1.36⫾0.13. This fit was found by incrementally varying p c until the best linear fit to the equation was found. As might be expected the percolation threshold falls in the middle of the mass fraction range between the dielectric like composite 共p⫽0.037%, PVA兲 and the p⫽0.074%, PVA composite which exhibits a frequency independent conductivity at low frequencies. This extremely low percolation threshold compares with values for fibular filler particles found in the literature of 0.035% by volume for polyaniline–polyvinylalcohol composites10 to 1.1% by volume for polymer–carbon black composites.19 It also com-
Downloaded 01 Jul 2010 to 134.226.1.229. Redistribution subject to AIP license or copyright; see http://jap.aip.org/jap/copyright.jsp
Kilbride et al.
J. Appl. Phys., Vol. 92, No. 7, 1 October 2002
pares well with previous values found for polymer–nanotube composites of 8% by mass for low purity MWNT–polymer composites20 and 1.1% by mass for low purity single walled nanotube–polymer composites.21 This value is, however, rather low compared with percolation thresholds calculated by Munson–McGee for cylindrical conductors in a insulating matrix. In this study statistical analysis was used to show that a percolation threshold in the region of 1%–5% is expected for a system of conductive fillers of aspect ratio between 50 and 130 共consistent with the nanotubes used in this study兲.11 However, it should be pointed out that the value presented here may be artificially reduced by individual nanotubes shorting through the thin film in the sandwiched structure configuration. While the low value of t⫽1.36 suggests charge transport through a two dimensional object this seems unlikely as the charge must flow through the film and not along any surface or interface. Values of t in the region of 1.3 have, in fact, been observed in a number of bulk systems. These include t⫽1.33 and t⫽1.42 in separate polyaniline-PMMA networks22,23 and t⫽1.3 in polyethelene–carbon black composites.24 One possible explanation for this is that the charge must flow solely through the conductive network which itself may be a fractal object of fractal dimension in the region of 2. An alternative suggestion has been made by Reghu et al. in a study of percolation in polyaniline–PMMA networks.22 They observed the critical exponent t⫽1.99 at 10 K indicating transport in three dimensions. However on return to room temperature the exponent decreased to t⫽1.33. This was suggested to arise from thermally induced hopping transport between disconnected 共or weakly connected兲 parts of the network. This latter description seems plausible and supports the suggestion that the nanotubes are separated by a thick polymer barrier. Alternatively it is possible that t can be reduced below the three-dimensional value by the reduction in the number of ‘‘dead arms’’ present, as would be expected for a thin film sample. While the data for the dc conductivity for all samples agrees well with Eq. 共1兲, the ac data at low mass fraction diverges from the dc data and is approximately 1 order of magnitude higher for the 0.074% mass fraction PVA sample. It is well known for hopping conduction that the dc conductivity is limited by the maximum of the range of activation energies25 as a carrier hops through the sample. In contrast, ac conduction is limited by the highest barrier experienced as the carrier travels for one half period of the field. It is possible for low mass fraction, just above the percolation threshold, that ac transport in a small fraction of the network is more favorable than dc conduction through the entire incipient network as large energy barriers can be avoided. This may result in AC⬎ DC . As the mass fraction is increased, the number of internanotube connections increases and many conductive paths become available. In this situation, substantial numbers of carriers traveling through the entire network follow paths which avoid the larger barriers and the dc conductivity approaches the ac conductivity. Alternatively at mass fractions just above the percolation threshold, relatively large networks may exist which are not connected to the main network linking the electrodes. These networks could
4027
contribute a significant component of the ac conductivity which would not appear in the dc conductivity, again resulting in AC⬎ DC . Given that each nanotube is probably coated with polymer which acts as a potential barrier to internanotube hopping, it is likely that electrical conductivity in this system is limited by tunneling between conductive regions 共nanotubes兲. This behavior is described by the fluctuation induced tunneling model26 which takes into account tunneling through potential barriers of varying height due to local temperature fluctuations, predicting a conductivity described by
DC⬀exp关 ⫺T 1 / 共 T⫹T 0 兲兴 ,
共2兲
where T is the temperature, k is Boltzmans constant, T 1 ⫽wA 2 /8 k and T 0 ⫽2T 1 / w , with ⫽(2 mV 0 /h2 ) 1/2, ⫽4V 0 /ew, m and e the electron charge and mass, V 0 the potential barrier height, w the internanotube gap width, and A the area of capacitance formed at the junction. It can easily be seen that for constant temperature this equation can be written in the form19 ln DC⬀⫺w.
共3a兲
If we assume that the nanotube content in the polymer host is homogenous, the composite conductivity at a given temperature can be described by the behavior of a single tunnel junction where the gap width is w⬀ p ⫺1/3 due to spatial considerations. This suggests the dc conductivity should follow the following rule ln DC⬀⫺p ⫺1/3.
共3b兲
In Fig. 2共c兲, both the dc and ac conductivity data presented in Fig. 2共b兲 are shown on a semilogarithmic scale versus p ⫺1/3. The expected linear relationship is observed, with the solid line as a fit to the dc conductivity data. This plot further supports the idea that the current is limited by potential barriers between nanotubes due to the polymer coating. Temperature dependent studies are currently underway to further investigate these results. B. Frequency dependent ac conductivity
Figure 1 has already been discussed in terms of the frequency independent conductivity observed at low frequency. Now we will turn to the frequency dependent conductivity component observed at higher frequencies. This strong dispersion of conductivity is in fact one of the most characteristic properties of electrical conduction in disordered solids.27 Typically, as discussed previously, a frequency independent region is observed at low frequencies switching, at a characteristic frequency 0 , to a region of conductivity increasing approximately as the power of the frequency. This can be expressed as a power law
共 兲⬀ s.
共4兲
This behavior can clearly be seen in Fig. 1 but is most obvious for the PVA composites. In all materials 0 was measured as the frequency at which the ac conductivity reached 110% of 0 , i.e., ( 0 )⫽1.1 0 . For the PVA based composites the exponent s was measured as the slope of the high frequency region in Fig. 1. In the PVA based composites
Downloaded 01 Jul 2010 to 134.226.1.229. Redistribution subject to AIP license or copyright; see http://jap.aip.org/jap/copyright.jsp
4028
Kilbride et al.
J. Appl. Phys., Vol. 92, No. 7, 1 October 2002
TABLE I. Summary of the numerical values measured in this work, column 1 gives mass fraction, columns 2 and 3 give dc and frequency independent conductivity, respectively. Shown in column 4 is the critical frequency while the frequency dependent conductivity exponent s is given in column 4 for the PVA composites only. p(%)
DC(S/m)
4.30 2.15 1.08 0.54 0.27 0.00
1.39⫻10⫺5 5.82⫻10⫺6 3.13⫻10⫺6 1.14⫻10⫺6 1.18⫻10⫺6 3.62⫻10⫺13
0.590 0.295 0.148 0.074 0.037 0.00
8.25⫻10⫺7 3.30⫻10⫺7 5.78⫻10⫺8 8.63⫻10⫺8 2.31⫻10⫺11 6.95⫻10⫺12
0 (S/m) PmPV 1.18⫻10⫺5 4.88⫻10⫺6 2.32⫻10⫺6 1.44⫻10⫺6 9.42⫻10⫺7 — PVA 9.68⫻10⫺7 4.01⫻10⫺7 4.46⫻10⫺7 2.41⫻10⫺7 — —
0 (rad/s)
s
5.63⫻106 3.01⫻106 1.02⫻106 3.45⫻105 1.99⫻105 —
— — — — — —
1.76⫻104 6.56⫻103 2.63⫻104 9.68⫻103 — —
0.93 0.91 0.91 0.94 — —
0 occurs between approximately 6⫻103 and 3 ⫻104 rad/s, with s ranging between 0.91 and 0.94. It has been shown25 that an approximate power law of this form with 0.8⬍s⬍1.0 is characteristic of hopping in a disordered material where hopping charge carriers are subject to spatially randomly varying energy barriers. This agrees well with the fluctuation induced tunneling model where the nanotube–nanotube barriers vary due to local random temperature fluctuations. This is not quite as easy to see for the PmPV composites as the conductivity only begins to become frequency dependent at frequencies in the range 2⫻105 to 6⫻106 rad/s. As this is close to the maximum experimental frequency, the exponential region was not observed for the PmPV composites, but they are expected to behave similarly to the PVA based materials. However the critical frequency 0 could be measured, albeit within a significant error margin, and in general was observed to increase with increasing mass fraction. The results for 0 and s 共PVA only兲 are given in Table I, while 0 is plotted against the reduced mass fraction 共p ⫺p c ) for both composites in Fig. 3.
FIG. 3. Graph of the critical frequency 0 against reduced mass fraction. Note that while for the PVA based composites 0 depends only weakly on frequency, for the PmPV based composite it scales as a power law as predicted by Eq. 共7兲.
In all network systems described by percolation theory, a characteristic length scale known as the correlation length , can be defined. This correlation length can be associated with the distance between connections in the system, i.e., the distance between junctions or nodes.22,27,28 When an alternating voltage is applied to a material, the charge carriers scan a distance that scales with the period of the perturbing wave. Thus if a carrier travels a distance at a frequency , it follows that the mean distance traveled at frequencies smaller that will be larger than and vice versa. In our case at frequencies lower than , we would expect carriers to have to tunnel through at least one nanotube–nanotube barrier 共because is associated with the distance between these barriers兲 while for frequencies greater than , some carriers would be expected to travel within single nanotubes. Thus we would expect a conductivity approaching the dc value at low frequencies with higher conductivity at higher frequencies as is observed experimentally. The transition frequency would then be expected to be that where carriers scan an average distance of order of the correlation length. Therefore it seems reasonable to associate 0 with . At low frequencies 共or long time scales兲 the carriers travel long distances through the long range Euclidean 共nonfractal兲 structure of the network. In the absence of an applied electric field these carriers undertake random walks and so scan a mean distance along the network of L⬀ 1/2 or L ⬀ ⫺1/2, where is the walk time and is the associated 共angular兲 frequency. Connor et al.19 have used this idea to explain the behavior of 0 as a function of filler concentration 共in this case carbon black兲 by looking at the relationship between the applied frequency and the distance scanned by a random walker on a fractal object for different filler concentrations. Their method seems slightly implausible for two reasons. First, they modified the equation L⬀ 1/2 to describe a random walk on a fractal object, i.e., L⬀ 1/␦ , where ␦ is the fractal dimension of a random walker on the fractal object. The problem here is that this length describes the average straight line spatial distance traveled from the starting point to the finishing point on the random walk. The distance scanned by the charge carrier, however, is not this distance but the distance traveled on the trail of the random walk29 which, as described earlier, is given by L⬀ 1/2. Second, on application of a small voltage we would expect the random nature of the walk to be compromised, with the walk becoming biased. At high applied voltages the trajectory will become completely nonrandom with L⬀ or L⬀ ⫺1 for a system where charge carrier scattering applies. We suggest that charge carriers undergo a biased random walk along the conducting network with the relevant distance L being that traveled through the network. In the two extreme cases, L⬀ ⫺1/2 for a completely random walk 共infinitesimally small electric field兲 and L⬀ ⫺1 for a completely nonrandom trajectory, under the influence of a strong electric field. It should be pointed out that while L⬀ ⫺1 only applies for systems with carrier scattering, this is expected to be the case for nanotubes interacting strongly with their environment, in this case the polymer coating. Thus, in general we can consider L⬀ ⫺a with 0.5⬍a⬍1. Conversely the frequency required for a carrier to travel, on average, a
Downloaded 01 Jul 2010 to 134.226.1.229. Redistribution subject to AIP license or copyright; see http://jap.aip.org/jap/copyright.jsp
Kilbride et al.
J. Appl. Phys., Vol. 92, No. 7, 1 October 2002
4029
distance L in one half period is given by ⬀L ⫺1/a for transport within the network. Therefore the parameter a describes the level of bias imposed on the walk by the application of an external field. If this is the case, at the high frequency limit of this behavior the carrier scans the correlation length at a frequency given by
⬀ ⫺1/a .
共5兲
It should be pointed out that electrical transport properties based on biased random walks have been modeled previously.29 While this work suggested an exponential relationship between distance and frequency, this result was strongly influenced by the presence of loops in the fractal system modeled. This resulted in significant carrier waiting times, leading to reduced transport properties in the presence of a field. This situation is not expected to exist in a system of rigid cylindrical conducting inclusions. Thus Eq. 共5兲 is expected to be valid in our system. In any network system the correlation length decreases as the mass fraction of filler particles is increased. This can be expressed as a scaling law of the form
⬀ 共 p⫺p c 兲 ⫺ ,
共6兲
where the exponent has the value ⫽4/3 in two dimensions and ⬇0.9 in three dimensions.18,28 Thus by combining Eqs. 共5兲 and 共6兲 and assuming 0 ⫽ , the critical frequency can be expressed as
0 ⬀ 共 p⫺p c 兲 /a .
共7兲
This critical frequency for both PVA and PmPV composites is plotted against 共 p⫺p c ) in Fig. 3. From this graph it is clear that the PVA based composites behave quite differently from their PmPV based counterparts. For the PVA samples the critical frequency varies little with mass fraction. Conversely the PmPV based materials display power law behavior as predicted by Eq. 共7兲. As the critical frequency is controlled by the microscopic structure it is probable that the PVA based materials have different local morphology to the PmPV based samples. This may indicate differences between the nanotube dispersal properties of the two host polymers. The critical frequency is related to the correlation length, which in turn can be associated with the distance between connections in the system. In this case these distances are likely to be linked to the length scale over which the nanotubes themselves are connected. A higher critical frequency in the case of the PmPV based composites would suggest shorter distances between nanotube connections. This effect could easily be caused by a higher level of nanotube aggregation in this host compared with PVA. This is in contrast to the data in Fig. 2 which showed only minimal differences in dc behavior for the two types of composites. As the total dc current flow would be expected to be less sensitive to aggregation effects than ac current flow this result is not surprising. This shows that the frequency dependent ac properties are more sensitive to local structural differences than dc properties. The exponent relating the critical frequency to the reduced mass fraction was measured from Fig. 3 to be 1.18 ⫾0.15. By comparison with Eq. 共7兲, this means 1.18⫽/a. In
FIG. 4. Master curve showing the ac conductivity for selected PVA composites. The solid line is a fit to the extended pair approximation model.
three dimensions ⫽0.9, giving a⫽0.76, well within our criteria for a. However in two dimensions ⫽4/3, giving a⫽1.13. As a has been defined as being between 0.5 and 1 this suggests that in this system charge transport must be through a three dimensional structure. This strongly supports the suggestion that the low value of the conductivity exponent t⫽1.36 reported earlier is due to tunneling between nanotubes and not the dimensionality of the system. Additionally, a⫽0.76 confirms that the path traveled by the carrier in our system is partially biased. As discussed previously, Connor et al. assumed that the distance scanned by the carriers scaled as L⬀ 1/␦ . Using Eq. 共6兲 they obtained an equation of the form ⬀(p⫺p c ) v ␦ . As and ␦ are known, with values of 0.9 共in three dimensions兲 and 3.5,30 respectively, this gives an exponent relating to 共 p⫺ p c ) of 3.1. This contrasts with their experimentally determined value of 1.5. This was explained by assuming a scaling relation of the form ⬀ 0 2. However if one applies the biased random walk theory to this data, a⫽0.9/1.5⫽0.6 is obtained, suggesting a weakly biased random walk. This explanation is preferable for reasons stated earlier and as it incorporates Occams razor by removing the need to assume a scaling relation between and 0 . Finally it has been known for over 40 yr that universality of ac conduction is common in many disordered materials.25,27,31 This is manifested by the ability to plot the ac conductivity data from a range of experiments on the same plot by the appropriate scaling of conductivity and frequency. In general the conductivity and frequency scaling factors are taken as 0 and 0 , respectively. Shown in Fig. 4 is the ac conductivity data for the PVA samples scaled using the 0 and 0 values given in Table I. These data do in fact exhibit universal behavior, with all data sets falling on the same master curve. It has been reported that the extended pair approximation model10,32 can describe this type of data using the equation
共 兲 / 0 ⫽1⫹k 共 / 0 兲 s ,
共8兲
where k has been added to take into account our rather arbitrary criterion for measuring 0 . The solid line in Fig. 4 is a fit to the master curve using Eq. 共8兲 with k⫽0.175 and s⫽0.92 in accord with the values of s obtained from Eq. 共4兲. Good agreement is observed between fit and data at low to mid frequencies. However, at high frequencies the data begin
Downloaded 01 Jul 2010 to 134.226.1.229. Redistribution subject to AIP license or copyright; see http://jap.aip.org/jap/copyright.jsp
4030
Kilbride et al.
J. Appl. Phys., Vol. 92, No. 7, 1 October 2002
to deviate from this power law dependence. While this can possibly be described by the antenna effect a more plausible explanation is given by Dyre’s25 view that frequency dependent conductivity is actually described by approximate power laws. He points out that for hopping in a regime of randomly varying potential barriers, a natural consequence is an s value which increases weakly with frequency, as is observed experimentally. This suggests that the extended pair approximation model is too simple to describe the behavior in this system and that a more complicated hopping based model compatible with fluctuation induced tunneling is needed. IV. CONCLUSIONS
Both dc and ac conductivities were measured for a series of polymer nanotube composite thin films with varying nanotube mass fraction. The host polymers used were PmPV and PVA. In all cases dc I–V characteristics were ohmic, while in general the ac conductivities displayed two regions: a low frequency region of constant conductivity and a high frequency region of increasing conductivity. All dc conductivities followed the percolation scaling law with percolation threshold p c ⫽0.055% by mass and exponent t⫽1.36. While ac conductivities for higher mass fraction composites fell on the same curve as the dc measurements, those for the lower mass fraction samples exhibited significantly higher conductivity. The extrapolated conductivity for a nanotube film was significantly lower than expected with NT⫽1⫻10⫺3 S/m. This is due to a thick coating of polymer, resulting in poor electrical connection between tubes. This suggests that conduction in this system is due to fluctuation induced tunneling. This is strongly supported by the linearity of ln as a function of ⫺p ⫺1/3, suggesting that conductivity is limited by tunneling through potential barriers between conductive regions. The high frequency conductivity increases with frequency according to an approximate power law with exponent s⬇0.92, indicative of hopping conductivity. The critical frequency for the onset of frequency dependent conductivity was measured for all samples. This varied only weakly with frequency for the PVA composites but scaled as a power law with exponent 1.18 for the PmPV composites. This is due to the variation of correlation length with nanotube concentration. This behavior has been modeled using a biased random walk approach. This approach explains the data well for a partially biased random walk in three dimensions. Finally universal ac conductivity in these materials was demonstrated by the construction of a master curve. This curve was fitted using the extended pair approximation model. While a good fit was observed at low to mid frequencies, the ac data diverged at high frequencies, suggesting that a more complicated hopping based model is needed.
ACKNOWLEDGMENTS
The authors wish to acknowledge the Irish Higher Educational Authority 共HEA兲, as well as EU TMR Project COMELCAN for financial support.
S. Iijima, Nature 共London兲 354, 56 共1991兲. M. S. Dresselhaus, G. Dresselhaus, and P. C. Eklund, Science of Fullerenes and Carbon Nanotubes 共Academic, New York, 1995兲. 3 J. N. Coleman, D. F. O’ Brien, A. B. Dalton, B. McCarthy, B. Lahr, A. Drury, R. C. Barklie, and W. J. Blau, Chem. Commun. 共Cambridge兲 20, 2000 共2000兲. 4 J. N. Coleman, D. F. O’ Brien, A. B. Dalton, B. McCarthy, B. Lahr, R. C. Barklie, and W. J. Blau, J. Chem. Phys. 113, 9788 共2000兲. 5 P. Fournet, J. N. Coleman, B. Lahr, A. Drury, D. F. O’Brien, H. -H. Hoerhold, and W. J. Blau, J. Appl. Phys. 90, 969 共2001兲. 6 B. E. Kilbride, J. N. Coleman, D. F. O’ Brien, and W. J. Blau, Synth. Met. 121, 1227 共2001兲. 7 D. S. McLachlan and M. B. Heaney, Phys. Rev. B 60, 12746 共1999兲. 8 X. Lafosse, Synth. Met. 68, 227 共1995兲. 9 F. A. T. Ramdeen and R. M. Hill, Phys. Status Solidi B 213, 391 共1999兲. 10 P. Dutta, S. Biswas, M. Ghosh, S. K. De, and S. Chatterjee, Synth. Met. 122, 455 共2001兲. 11 S. H. Munson-McGee, Phys. Rev. B 43, 3331 共1991兲. 12 A. Drury, S. Maier, A. P. Davey, A. B. Dalton, J. N. Coleman, H. J. Byrne, and W. J. Blau, Synth. Met. 119, 151 共2001兲. 13 W. Kraetschmer, L. D. Lamb, K. Fostiropoulos, and D. R. Huffman, Nature 共London兲 347, 354 共1990兲. 14 M. Cadek, R. Murphy, B. McCarthy, A. Drury, B. Lahr, R. C. Barklie, M. Panhuis, J. N. Coleman, and W. J. Blau, Carbon 40, 923 共2001兲. 15 O. Chauvet, L. Forro, W. Basca, D. Ugarte, B. Doudin, and W. A. de Heer, Phys. Rev. B 52, R6963 共1995兲. 16 B. McCarthy et al., J. Phys. Chem. B 106, 3087 共2002兲. 17 B. McCarthy, J. N. Coleman, S. A. Curran, A. B. Dalton, A. P. Davey, Z. Konya, A. Fonseca, J. B. Nagy and W. J. Blau, J. Mater. Sci. Lett. 19, 2239 共2000兲. 18 D. Stauffer and A. Aharony, Introduction to Percolation Theory 共Taylor and Francis, London, 1994兲. 19 M. T. Connor, S. Roy, T. A. Ezquerra, and F. J. Balta Calleja, Phys. Rev. B 57, 2286 共1998兲. 20 J. N. Coleman, S. Curran, A. B. Dalton, A. P. Davey, B. McCarthy, W. Blau, and R. C. Barklie, Phys. Rev. B 58, 7492 共1998兲. 21 J.-M. Benoit, B. Corraze, S. Lefrant, W. J. Blau, P. Bernier, and O. Chauvet, Synth. Met. 121, 1215 共2001兲. 22 M. Reghu, C. O. Yoon, C. Y. Yang, D. Moses, P. Smith, and A. J. Heeger, Phys. Rev. B 50, 13931 共1994兲. 23 J. Fraysse and J. Planes, Phys. Status Solidi B 218, 273 共2000兲. 24 F. Gubbels, R. Jerome, P. Teyssie, E. Vanlathem, R. Deltour, A. Calderone, V. Parente, and J. L. Bredas, Macromolecules 27, 1972 共1994兲. 25 J. C. Dyre, J. Appl. Phys. 64, 2456 共1988兲. 26 P. Sheng, E. K. Sichel, and J. I. Gittleman, Phys. Rev. Lett. 40, 1197 共1978兲. 27 J. C. Dyre and T. B. Schroder, Rev. Mod. Phys. 72, 873 共2000兲. 28 A. L. Efros and B. I. Shklovskii, Electronic Properties of Doped Semiconductors 共Springer, Berlin, 1984兲. 29 A. Bunde, J. Drager, and M. Porto, in Computational Physics, edited by K. H. Hoffman and M. Schreiber 共Springer, Berlin, 1996兲, pp. 121–146. 30 Y. Gefen, A. Aharony, and S. Alexander, Phys. Rev. Lett. 50, 77 共1983兲. 31 H. E. Taylor, Trans. Faraday Soc. 52, 873 共1956兲. 32 S. Summerfield, Philos. Mag. B 52, 9 共1985兲. 1 2
Downloaded 01 Jul 2010 to 134.226.1.229. Redistribution subject to AIP license or copyright; see http://jap.aip.org/jap/copyright.jsp