RoI Euclidean Distance. Video Information. Trajectory History. Video Combined ... Training. Feature Vector. Logistic. Re
Train Your TV Zhi Li and Borja Peleato Term Project for CS229 Machine Learning, Stanford University Experimental Results Abstract
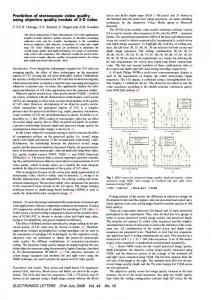
10
Prediction Using Video
9 8
RoI Euclidean Distance
We study the problem of predicting the users’ viewing behavior in an Interactive TV application, using soccer match as an example. Based on the information extracted from the video frames and the user’s Region of Interest (RoI) trajectory history, we make the prediction of user’s RoI in the frames ahead of time. We start with a generic probabilistic model, make simplifications and develop a tractable system. Lastly, we verify its performance through a set of experimental results and a live demo.
7 6 5 4 3 2
� t+n We discretize each video frame into blocks and for each block p we compute Pr It+n(p) | f , where It+n(p) is the indicator function of block p being in RoI in frame (t + n). We further make the following simplifications:
High-resolution video is available at the server. Both a low-resolution overview video and an enhancementlayer video of the RoI predicted by the system are streamed to the user. Accurate prediction of the RoI will lead to higher video quality (or less distortion) at the user side. We will allow some streaming start-up delay and send some number of frames of the thumbnail video ahead of time. Hence, the inputs to our module are the trajectory of the user’s RoI history and the thumbnail video up to the frame of prediction. The performance will be evaluated based on the Euclidean distance between the predicted RoI trajectory and the actual one.
The second equation makes the assumption that It+n(p) depends only on a local patch ξt+n around p and the actual location p. To compute Pr(It+n(p) | ξt+n(p), p), we select features to reflect ξt+n(p) and p, and use a logistic regression model. The features we select include: DIST BALL(p), M OV (p), N U M P LAY ERS(p) and LOCAL LABEL(p).
Prediction Using Trajectory The available information is the user’s recent RoI trajectory and his behavior from watching previous matches Φ1, Φ2, Φ3, ..., ΦN . We believe that there exist “typical trajectories” that users very commonly follow which would be difficult to capture under a single set of parameters. Hence, we divide the trajectories into clusters and perform an independent regression within each cluster. Parameters and cluster centroids are computed in an offline training phase and stored to be used at prediction time. While the user is watching the match, his behavior is periodically classified into one of the clusters and his future RoI center is predicted using the corresponding coefficients. His RoI window is modeled as a Gaussian convolved with the current window.
...
1 0
Ball
Audience
Players
Mixed
Distance between predictions and correct RoI centers for different user behaviors and prediction schemes. Users can follow the ball, scan the audience, look at the players or switch randomly. Predictions respectively use video features (good for well localized behaviors), recent trajectory (good for changing behaviors), a smart combination of the previous two, and linear extrapolation (comparison benchmark). 8 7 RoI Euclidean Distance
Pr(It+n(p) | f t+n) = Pr(It+n(p) | ft+n) = Pr(It+n(p) | ξt+n(p), p)
Environment Setup
Video Information Trajectory History Video Combined with Trajectory Simple Extrapolation
Video Frame Partioned Into Blocks (Frame #182)
6
Video Information Trajectory History Video Combined with Trajectory Simple Extrapolation
5 4 3 2 1
Trajectory
Current Time
Look-ahead Window
0 0
Time of Prediction Region Map Ceiling Scoreboard
2
Ball 4 Detection
Probabilistic Model Suppose we have a sequence of overview video frames {fi}. On each frame the user can indicate a RoI φi. Suppose currently we are at time t, we want to make a prediction of the user’s RoI at n steps ahead, i.e., φt+n. The information available for our prediction includes: 1) the overview video up to frame (t + n), i.e., f t+n = {. . . , ft+n−2, ft+n−1, ft+n}, and 2) the user’s RoI trajectory history up to frame t, i.e., φt = {. . . , φt−2, φt−1, φt}. Based on all the information available, we make a prediction using: � � φˆt+n = arg max p φt+n | f t+n, φt φt+n � � � � = arg max p φt+n | f t+n p φt+n | φt . φt+n
We assume Markovity (f t+n ↔ φt+n ↔ φt) and uniform prior probability p(φt+n).
Player Detection
Audience
Ceiling Scoreboard
Audience
4
Goalmouth
6 Field
8 10
6
Goalmouth 5 10 15
Ads 20
25
30
35
Segment
40
2
3
4 5 lookahead time
6
7
8
Field
8 10
Distance To Ball
Region Map
2
1
Error vs. lookahead time. For short times, trajectory predictions are better, but as we try to predict further in time, the video features offer a very reliable source of information. We used a lookahead of 3 seconds.
5
Movement 10 15 Intensity
Ads Number of 20 25
Players
Minimum Distance
35 Local 40
30
Labels
4
Centroids
K-Means Clustering
Video Information Trajectory History Video Combined with Trajectory Simple Extrapolation
3.5 Training Feature Vector
Least Squares
Label
Least Squares
Linear Regression
. . .
Logistic Regression
LSE Coeffs
Least Squares Least Squares
Training Offline
Query Feature Vector Probability Map
Prediction Using Trajectory History Prediction Using Trajectory History
2
2
4
4
6
6
8
8
10
10
10
15
20
3
2.5
2
Prediction Using Video
5
RoI Euclidean Distance
Training Window
25
30
35
40
Combining Information
5
10
15
20
25
30
35
2 4 6 8 10 5
10
15
20
25
30
35
40
40
1.5 3
4
5
6
7
8 9 history length
10
11
12
13
Error vs. training window duration. Longer training times slightly improve the accuracy of trajectory predictions, but at the cost of increased complexity and feature degradation. We decided to base our predictions on the past 4 seconds.