6th International Conference on CFD in Oil & Gas, Metallurgical and Process Industries SINTEF/NTNU, Trondheim NORWAY 10-12 June 2008
CFD2008-073
Experimental study on solids circulation patterns and bubble behavior using Particle Image Velocimetry combined with Digital Image Analysis J.A. LAVERMAN1,2, I. ROGHAIR1, M. van SINT ANNALAND1,2, J.A.M. KUIPERS1,2 1 2
University of Twente, P.O. Box 217, 7500 AE, Enschede, the Netherlands
Dutch Polymer institute (DPI), P.O.Box 902, 5600 AX Eindhoven, the Netherlands * E-mail:
[email protected]
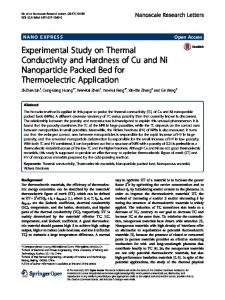
y
y-position
m, px
ABSTRACT Greek Symbols ε Relative particle number-density ψ Visible bubble flow
The hydrodynamics, viz. the solids circulation patterns and bubble behavior, of a freely bubbling gas-solid fluidized bed has been investigated experimentally using Particle Image Velocimetry (PIV) combined with Digital Image Analysis (DIA). Coupling of these non-invasive measuring techniques allows us to obtain information on both the bubble behavior and emulsion phase circulation patterns simultaneously, in order to study in detail their intricate interaction. In particular, the combination of DIA with PIV allows correcting for the influence of particle raining through the roof of the bubbles on the time-averaged emulsion phase velocity profiles. Because of the required visual access, this technique can only be applied for pseudo-2D fluidized beds. The bubble rise velocity as a function of the equivalent bubble diameter and the average bubble diameter as a function of the position above the distributor were determined with DIA and compared with literature correlations. Subsequently, the importance was demonstrated of filtering the instantaneous emulsion phase velocity profiles obtained with PIV for particle raining, using DIA, to obtain the time-averaged emulsion phase velocity profiles. The timeaveraged solids circulation patterns have been studied as a function of the superficial gas velocity and bed aspect ratio.
Subscripts b bubble bed bed mf minimum velocity p particle f frame
INTRODUCTION In many industrial applications of bubbling gas-solid fluidized bed reactors, the reactor performance is determined by the macro-scale solids circulation patterns. For example, in gas-phase polymerization reactors, the overall heat removal rate and consequently the overall production capacity is dominated by the solids convection. Unfortunately, a profound understanding of the prevailing mechanisms is still lacking and especially quantitative information on the macroscale circulation patterns in large fluidized bed reactors is still quite scarce. To investigate in detail the hydrodynamics of bubbling fluidized reactors more and more Computational Fluid Dynamics (CFD) is used in both the academic world and in industry, especially due to the increase in capabilities of computer hardware and CFD models. However, the multiphase CFD models need to be validated and further improved, for which good and reliable experimental techniques need to be developed to measure the properties of complex multiphase flows in detail. In this work two optical non-invasive measuring techniques, viz. Particle Image Velocimetry (PIV) and Digital Image Analysis (DIA) are combined.
Keywords: PIV, DIA, hydrodynamics, fluidized bed.
NOMENCLATURE A0 C d f g h i j M N Nf
Catchment area Constant Diameter frame Gravitational acceleration Height Position on digital image Position on digital image Magnification factor Interrogation zone size Number of frames
Sb Sp t u u v x
Cross-correlation Surface of bubble in a pseudo-2D bed Displacement of particles Time/depth of the column Superficial gas velocity Vector velocity Vector velocity x-position
µ R
-
m2 m m2.s-1 m px -
PIV was first applied to gas-fluidized beds by Bokkers et al. (2004), who measured the emulsion phase circulation patterns in freely bubbling gas-solid fluidized beds, in order to validate the extent of particle drift induced by rising gas bubbles predicted by Euler-Lagrange and Euler-Euler models. Link et al. (2004) used PIV to establish fluidization regime maps in spouted fluidized beds and found excellent agreement with their discrete particle simulations. Dijkhuizen et al. (2007) extended the PIV technique to enable the measurement of the granular temperature distribution simultaneously in the fluidized bed. The granular temperature is a very important parameter in the modeling of
m2 m s/m m.s-1 -1
m.s m.s-1 m, px
1
J.A. Laverman, I. Roghair, M. van Sint Annaland and J.A.M. Kuipers
measurements, to 60-70% relative humidity. experimental settings are summarized in Table 1.
fluidized beds with Euler-Euler models using closures for the solids phase rheology based on the Kinetic Theory of Granular Flow. PIV has also been applied to study particle behavior in the freeboard region (a.o. Duursma et al., 2001), and to investigate bubble eruption at the top of the bed (Muller et al., 2007). Pallares and Johnsson (2006) investigated the particle behavior using phosphorescent tracer particles. They measured the concentration, velocity and dispersion of the tracer particles in a pseudo-2D bed. Almendros-Ibanez et al. (2007) measured the particle acceleration of erupting bubbles in the freeboard with which they experimentally determined the gas through-flow velocity crossing the dome of erupting bubbles.
The
2.2. Measuring technique DIA DIA uses the pixel intensity to determine whether the pixel belongs to the bubble or the emulsion phase. When the pixel intensity is below a predefined threshold value, the pixel area is assigned to the bubble phase, and otherwise to the emulsion phase. The threshold was an image independent threshold of 0.9 times the average image intensity. In Figure 2 a typical result from the DIA algorithm is shown: a) original image, b) detected bubbles and c) the equivalent bubble diameter.
Lim et al. (1990) were the first to perform DIA measurements to a pseudo 2D fluidized bed studying the bubble size and velocity distribution and bubble hold-up distribution. Agarwal et al. (1997) used DIA to investigate the bubblewake acceleration in a pseudo-2D bed. Goldschmidt et al. (2003) measured the bed expansion and segregation rates of a binary particle mixture using a high speed color camera. Shen et al. (2004) used DIA to derive relations for the bubble growth and bubble rise velocity in a pseudo 2D bubbling fluidized bed filled with Geldart B particles. Mudde et al. (1994) used DIA to measure the local hold-up, and bubble size, shape and velocity in a bubbling fluidized bed, while Utikar and Ranade (2007) used DIA to validate their EulerEuler model for a single jet fluidized bed. Finally, Lim et al. (2007) investigated the bubble distribution and behavior in bubbling fluidized beds.
Table 1: Experimental settings
In this work, PIV and DIA are combined to measure the emulsion phase velocity profiles. Using DIA, the instantaneous particle velocity profiles obtained by PIV can be filtered for particles raining through the roof of the bubbles (see also Laverman et al., 2007). With this novel approach the entire emulsion phase flow field is obtained instantaneously, contrary to e.g. particle tracking techniques, which allows investigating the interaction between the bubble and the emulsion phases directly. However, because of the required visual access, this technique can only be applied for pseudo-2D fluidized beds.
Bed Width [m] Depth [m] Height [m] Initial bed height [m] Front plate [-] Back plate [-] Right and left wall [-] Distributor pore size [µm]
0.30 0.015 1.0 0.30 – 0.45 Glass Glass Aluminium 19
Particles Material [m] Density [kg.m-3] Diameter [µm] Minimum fluidization velocity [m.s-1]
Glass 2500 400-600 0.18*
*
measured experimentally using the pressure drop versus velocity method (see Kunii and Levenspiel, 1991).
The paper is outlined as follows: First, the experimental setup and the two non-invasive measuring techniques DIA and PIV are described, followed by a discussion on how the PIV and DIA results are combined. Subsequently, the results on the averaged bubble size and velocity as a function of the height in the bed for different bed aspect ratios and fluidization velocities are discussed and compared with literature correlations. Finally, the influence of the bed aspect ratio and fluidization velocity on the time-averaged emulsion phase velocity profiles is presented and discussed.
2. EXPERIMENTAL 2.1. Experimental setup For the experiments, a pseudo-2D fluidized bed with a width of 0.30 m, with a height of 1.0 m and a depth of 0.015 m was constructed. The front and the back wall of the bed were both made of glass. The side walls of both beds consisted of aluminium strips.
Figure 1: Schematic drawing of the experimental PIVDIA setup. The sensitivity of the relative threshold value (constant 0.9) has been investigated, and it was found that the results were not significantly influenced when a constant of 0.85 or 0.95 was used, see Figure 3 where the equivalent bubble diameter is investigated as function of the axial position, using
The bed was filled with glass beads with a narrow particle size distribution in the range of 400-600 µm (Geldart B). Air was used as fluidization gas, which was introduced via a porous plate distributor. To prevent electrostatic build-up, the air was humidified, using steam during the PIV-DIA 2
Novel experimental technique to validate CFD using combined Particle Image Velocimetry and Digital Image Analysis/ CFD08073 different thresholds. However, to be sure that the correct threshold was used, visual inspection of the phase separation was performed for every measurement.
to obtain the average displacement of the particles Sp. Note that the average image intensity 〈I〉 is subtracted from both images before cross-correlation is carried out in order to reduce the background correlation. I′ [i,j] is the intensity of pixel (i,j) in the first image and I″ is the intensity of pixel (i+x,j+y) in the second image. With the known time ∆t between the two images and the displacement of the particles Sp inside the interrogation area, the average velocity vp of the particles inside this particular interrogation area can be calculated with
The equivalent bubble diameter is determined by summing the adjacent bubble pixels with: 4Sb db = (1) π The bubble velocities were determined by dividing the displacement of the centre of mass of the equivalent spherical bubbles by the time-step between two recorded images.
v p ( x, t ) =
S p ( x, t )
(3)
M ∆t
where M represents the magnification of the image. Careful selection of the time between two consecutive images is required to minimize the influence of out-of plane movement of particles (see e.g. Westerweel (1997) for further details). By combining the velocities of all interrogation areas, the instantaneous velocity profile is obtained.
(a)
(b)
Combining PIV-DIA Even though PIV measures the instantaneous average particle velocity in every interrogation zone, PIV does not account for the difference in particle number density (i.e. porosity) in different interrogation zones. To obtain the emulsion phase mass fluxes from the particle velocity, one needs to correct of differences in particle number density, especially because of particle raining through the bubbles, where a small number of particles have a very high velocity, while the particle mass flux is small. The presented DIA algorithm assumes that there are no particles inside a bubble ( ε i*, j = 0 ) and that the
(c)
Figure 2: A typical bubble plot obtained with DIA from a freely bubbling fluidized bed. a) original image; b) detected bubbles; c) equivalent bubble diameters.
emulsion phase density is constant ( ε i*, j = 1 ), the average *
relative particle number-density ε i , j was determined for every interrogation area. The number-averaged velocity field u*i , j is obtained from the original PIV velocity field ui,j via *
u*i, j = u i, j ε i , j
(4)
Where ε Figure 3: Influence of the relative threshold value on the equivalent bubble diameter as a function of its position above the distributor.
* i, j
1 = 2 N
i+
N 2
j+
N 2
∑ ∑
ε *p, q
(5)
N N p =i − q = j − 2 2
Note that the time-averaged velocity field is obtained by normalizing over the average emulsion phase fraction: * i, j
PIV Particle Image Velocimetry (PIV) is a non-invasive measuring technique developed originally to investigate liquid or gas-liquid systems, but recently extended to gassolid dispersed flows. The basic principle of PIV is to divide the recorded images into Nx×Ny interrogation areas and use a spatial cross-correlation on two consecutive images
u
=
1 Nf
Nf
∑ε
* f ,i, j
f =1 Nf
1 Nf
∑ε
u f ,i , j (6)
* f , i, j
f =1
where f denotes the image number of the PIV images. In (b) Figure 4(a) a typical instantaneous PIV result is shown for a test case where a single bubble was injected into a fluidized µ [ x, y ] = bed at incipient fluidization conditions. The figure clearly R shows the large particle velocities associated with particles Nx N y 1 (b) − + + − I ' i , j I I '' i x , j y I ] raining ) through the bubble. ∑∑ ( [ ] ) ( [ N x N y i =1 j =1 Figure 4(b) shows the instantaneous velocity profile of the emulsion phase after disregarding particle velocities inside bubbles, using the combined PIV and DIA algorithm. (2) The large influence of filtering out of particle velocities of particles inside bubbles on the time-averaged emulsion phase 3
J.A. Laverman, I. Roghair, M. van Sint Annaland and J.A.M. Kuipers
velocity profiles can be observed in Figure 5, in which the time-averaged emulsion phase velocities are shown before (a) and after (b) filtering making use of DIA. The figure clearly shows that without filtering the up-flow of the emulsion phase in the centre of the fluidized bed is strongly underestimated. Since most bubbles move through the fluidized bed at the centre of the bed, the effect of the filtering procedure is most pronounced at the centre, while the extent of down-flow is hardly affected by the filtering.
(a)
(a)
(b) (b)
Figure 5: Time-averaged emulsion phase velocity profiles for 2.5 u/umf in the 0.30 m fluidized bed filled with 0.30 m of glass beads. a) before filtering using DIA, b) after filtering using DIA.
Figure 4: Instantaneous PIV image with velocity vectors, where in the background one of the images is given on which this particular PIV image in based, (a) purely PIV image, (b) combined PIV and DIA image.
PIV-DIA settings The images were recorded with a LaVision ImagerPro HS CCD, which had a resolution of 1024x1280 pixels and an internal memory of 2 GB. The bubble size and velocity distributions were determined by performing DIA on images of the entire bed in order to avoid problems associated with bubbles that are captured only partially in the image. This allowed measuring for approximately 30 s using a constant time delay of 10 ms between the images. The DIA program was validated thoroughly using ‘synthetic’ images (user created images where the size and position of the bubbles were known exactly). For the PIV measurements, the camera was located at such a distance, that a single particle was represented by at least 2-3
4
Novel experimental technique to validate CFD using combined Particle Image Velocimetry and Digital Image Analysis/ CFD08073
3. RESULTS
pixels in diameter in order to make sure that the desired resolution was obtained. This allowed a measurement area of the bed of approximately 11.8 cm x 15 cm. The timeaveraged emulsion phase velocity profiles of the entire bed were determined by repositioning the camera 9 to 15 times, depending on the bed width and height, therefore the data of the different measurements had to be combined using bilinear interpolation to yield the entire time-average emulsion phase flow field. The bottom 1.5 cm of the fluidized bed could not be studied due to lack of visual accessibility. The frequency with which the PIV image pairs were recorded was 4 Hz. The exposure time was set to 1 ms with an effective time delay of 5.003 ms between the images in a pair. With this scheme, the camera was able to record for 3 minutes. The PIV calculations were performed using the multiple-pass mode, during the first pass, the interrogation area was 128x128 pixels, during the second pass the interrogation was 32x32 pixels with an overlap of 50%. To measure the time-averaged emulsion phase velocity profile more than 700 PIV image pairs were taken. It had been found that the average standard deviation with the long-term average (measured with a separate independent experiment over a long time) was always less than 1% when using 200 image pairs.
In this paragraph, the results from the combined PIV-DIA and DIA measurements are presented and discussed. First, the average bubble diameter as function of the axial position and the average bubble rise velocity as function of the average bubble diameter for different fluidization velocities and bed aspect ratios are presented and compared with literature correlations where available. Then, the time-averaged emulsion phase velocity profiles are presented and discussed, again as function of the fluidization velocity and bed aspect ratio.
3.1 Bubble dynamics Equivalent bubble diameter and bubble rise velocity First, it was investigated how the laterally averaged equivalent bubble diameter varies as a function of the height in the bed for different fluidization velocities and bed aspect ratios (see Figure 6). The figure show that the laterally averaged bubble diameter increases less than proportional with the distance to the distributor and that larger equivalent bubble diameters are found for higher fluidization velocities, as expected.
Figure 6: Equivalent bubble diameter as a function of the position in the bed above the distributor for different bed aspect ratios and fluidization velocities: 1.5 u/umf, 2.0 u/umf, 2.5 u/umf and 3.5 u/umf
5
J.A. Laverman, I. Roghair, M. van Sint Annaland and J.A.M. Kuipers
Figure 7: Bubble diameter as a function of the axial position in the bed for different fluidization velocities: 1.5 u/umf, 2.0 u/umf, 2.5 u/umf and 3.5 u/umf. The dashed lines represent predictions using equation (7), proposed by Shen et al. (2004). For different fluidization velocities
Figure 8: Averaged bubble velocity as a function of the equivalent bubble diameter at different fluidization velocities. Solid lines: DIA results; Dashed lines: predictions using Hilligart and Werther’s correlation using C = 0.5 and ψ = 0.65. For different fluidization velocities: 1.5 u/umf, 2.0 u/umf, 2.5 u/umf and 3.5 u/umf The experimental results for the laterally averaged equivalent bubble diameter as a function of the height in the bed are presented in Figure 7 together with a correlation suggested by Shen et al. (2004), given in equation (7). They fitted a Darton-like equation for the average bubble size db
based on DIA experiments also performed in a pseudo-2D freely bubbling fluidized bed using Geldart B type solids: 2
A 3 − 1 db = 0.89 ( u0 − umf ) h + 3.0 0 g 3 t
6
(7)
Novel experimental technique to validate CFD using combined Particle Image Velocimetry and Digital Image Analysis/ CFD08073 the emulsion phase circulation patterns become much more pronounced, clearly showing two symmetric vortices with their centers located in the top half of the bed. At low fluidization velocities 2 – 2.5 u/umf, in the 0.30 m bed, two additional vortices close to the bottom of the bed can be discerned causing downflow of the emulsion phase in the centre of the bed close to the distributor. However, at fluidization velocities above 2.5 u/umf the down-flow region extends completely down to the distributor and these vortices at the bottom disappear. This corresponds well to observations by many other authors on the lateral movement of the bubbles is enhanced at higher fluidization velocities caused by the increased circulation of the emulsion phase.
where h is the height, A0 is the catchment area (for porous plate 4 A0 = 0.03 m), t is the depth of the bed and g is the gravitational acceleration. Since both the width and the depth of their fluidized bed were larger (their bed dimensions: 0.68 x 0.07 m vs. bed dimensions in this work: 0.30 x 0.015 m), their correlation overpredicts our experimental results, especially at higher superficial gas velocities. Not only can the bubbles grow to a larger maximum bubble diameter in their set-up, also the bubbles with a diameter smaller than the bed depth (0.07 m) could not be well detected in their experimental rig. Subsequently, the measured average bubble velocity as a function of the equivalent bubble diameter is plotted for different fluidization velocities in Figure 8 and compared with literature findings. The bubble rise velocity ub in a freely bubbling fluidized bed is usually correlated to the bubble diameter and fluidization velocity via a correlation proposed by Werther (1978): ub = ψ ( u0 − u mf ) + C gd b (8)
In Figure 10 the lateral profiles of the filtered time-averaged axial emulsion phase velocity are compared at different heights in the bed for different fluidization velocities. The effect of the lateral movement of the bubbles from the wall region towards the centre as they rise through the bed can also be observed in this figure. The two maxima in the emulsion phase velocity shift towards the centre at larger distances from the distributor and at higher fluidization velocities. This figure clearly show the strong increase in the downward emulsion phase velocities at the wall and the upward emulsion phase velocities at the centre at higher fluidization velocities. Moreover, the zone in which the emulsion phase moves downward also increases. Finally, the effect of the bed aspect ratio on the filtered time-averaged emulsion phase velocity profiles was investigated for the 0.30 m bed (see Figure 11 and Figure 12). Note that the large downward velocities at the top of the bed are caused by the erupting bubbles into the freeboard. Figure 11 shows that at higher bed aspect ratios the vortices at the top of the bed become much more elongated, while the emulsion phase velocity profiles at the bottom of the bed are hardly affected. This can also be clearly observed in Figure 12 showing the lateral profiles of the filtered timeaveraged emulsion phase velocity at different heights in the bed at different fluidization velocities. The absence of the influence of the bed aspect ratio on the emulsion phase velocity profiles when compared at the same height in the bed corresponds to the absence of the influence of the bed aspect ratio on the bubble rise velocity as a function of the equivalent bubble diameter. This was also verified at different heights in the bed.
where different values ranging between 0.5 and 1 have been proposed for the constant C. Using C = 0.5 as suggested by a.o. Mudde et al. (1994) for a single isolated bubble, the measured bubble velocities agree reasonably well with this correlation. The visual bubble flow rate ψ has been experimentally determined by Hilligart and Werther (1986) to be approximately 0.65 for Geldart B powders for a bed aspect ratio up to 2. The bubble rise velocities are strongly overestimated by their correlation for very small bubbles, where experimental errors (e.g. due to the selected relative threshold value) and wall effects may play an important role.
3.2 Emulsion phase behavior Time-averaged emulsion phase velocity profiles In Figure 9 the filtered time-averaged emulsion phase velocity profiles are given for different fluidization velocities in the 0.30 m width fluidized bed. Note that only one out of three measured vectors is shown for clarity and that the lateral movement of the emulsion phase just above the distributor could not be measured in our set-up because of lack of visual accessibility. At very low fluidization velocities below 1.5 u/umf asymmetric flow patterns were obtained, probably caused by an inhomogeneous gas distribution at the bottom of the bed at these low gas velocities. At higher fluidization velocities,
7
J.A. Laverman, I. Roghair, M. van Sint Annaland and J.A.M. Kuipers
(a)
(b)
(c)
(d)
Figure 9: Time-averaged filtered emulsion phase velocity profiles measured in the bed with a width of 0.30 m and a packed bed aspect ratio of 1 for different fluidization velocities: a) 1.5 u/umf, b) 2.0 u/umf, c) 2.5 u/umf, d) 3.5 u/umf.
(a)
(b)
8
Novel experimental technique to validate CFD using combined Particle Image Velocimetry and Digital Image Analysis/ CFD08073 Figure 10: Time-averaged lateral profiles of the emulsion phase velocity for the 0.30 m fluidized bed at 100 mm (a) and 300 mm (b) above the distributor at different fluidization velocities: 1.5 u/umf, 2.0 u/umf, 2.5 u/umf and 3.5 u/umf.
(a)
(b)
Figure 11: Time-averaged filtered emulsion phase velocity profiles for the 0.3 m fluidized bed for two different bed aspect ratios at 2.5 u/umf: (a) packed bed height = 0.30 m; (b) packed bed height = 0.45 m.
(a)
(b)
Figure 12: Influence of the bed aspect ratio on the lateral profiles of the emulsion phase velocity measured in the 0.30 m bed at two different heights in the bed: (a) 100 mm above the distributor;( b) 100 mm above the distributor; (Solid lines: packed bed height = 0.30 m; Dashed lines: packed bed height = 0.45 m) and different fluidization velocities: 1.5 u/umf, 2.0 u/umf and 2.5 u/umf. 2D bed because of the required visual accessibility) together with detailed information on the bubble phase (local bubble size and velocity distribution and bubble fraction), which allows investigating the mutual interaction between the bubble and emulsion phase in detail. Moreover, the combination of PIV with DIA allows correcting for the large
4. CONCLUSION Two non-invasive, optical measuring techniques, namely Particle Image Velocimetry (PIV) and Digital Image Analysis (DIA), have been combined to obtain the instantaneous emulsion phase velocity profiles (in a pseudo-
9
J.A. Laverman, I. Roghair, M. van Sint Annaland and J.A.M. Kuipers
Goldschmidt, M.J.V., J.A.M. Kuipers and W.P.M. van Swaaij, ‘Digital image analysis measurements of bed expansion and segregation dynamics in dense gas fluidised beds’, Powder Technology 138, p. 135 (2003).
influence of particle raining through the roof of the bubbles on the time-averaged emulsion phase velocity profiles. The DIA results for the average bubble diameter as a function of the height in the bed and the average bubble rise velocity as a function of the equivalent bubble diameter were found to compare reasonably well with literature correlations, considering the differences in experimental setups. The results showed that the correlation between the bubble rise velocity and the equivalent bubble diameter does not depend on the bed height. The filtered time-averaged emulsion phase velocity profiles were measured as a function of the fluidization velocity and bed height. The time-averaged emulsion phase velocity profiles show two symmetric vortices with their centers located at the top half of the bed, becoming more pronounced at higher fluidization velocities. Two additional smaller vortices were observed close to the bottom of the bed at lower velocities, which disappear at higher fluidization velocities when the down flow region extends completely to the bottom the bed. It was found that the time-averaged emulsion phase velocity profiles do not depend on the bed height, when compared at the same distance from the distributor at the same fluidization velocity.
Hilligardt, K. and J. Werther, ‘Local Bubble Gas Hold-up and Expansion of Gas/Solid Fluidized Beds’ German Chemical Engineering 9, p. 215 (1986). Kunii, D. and O. Levenspiel, ‘Fluidization engineering’, Butterworth-Heinemann, 2nd edition (1991). Lim, C.N., M.A. Gilbertson, A.J.L. Harrison, ‘Bubble distribution and behaviour in bubbling fluidised beds’, Chemical Engineering Science, 62, p. 56, (2007). Lim, K.S., P.K. Agarwal and B.K. O’Niell, ‘Measurement and modelling of bubble parameters in a two-dimensional gas-fluidized bed using image analysis’, Powder Technology, 60, p. 159 (1990). Laverman, J.A., I. Roghair, M. van Sint Annaland, J.A.M. Kuipers, “Experimental study on solids mixing and bubble behaviour in a pseudo-2D freely bubbling, gas solid fluidized bed using PIV and DIA”, International Conference on Multiphase Flow, ICMF2007, Leipzig, Germany, July 9 – 13 2007.
The experimental data provide a basis for further development and validation of CFD models to describe the solids motion in gas-solid fluidized beds. In the future, the correlation between the bubble behavior and the solids mixing will be examined in more detail, also using the developed experimental technique to elucidate and quantify the interaction forces between the bubbles (bubble wake acceleration forces) and their influence on the emulsion phase circulation patterns, and extending the experimental work to different types of particles.
Link, J., C. Zeilstra, N.G. Deen and J.A.M. Kuipers,‘Validation of a Discrete Particle Model in a 2D Spout-Fluid Bed using non-intrusive optical measuring techniques’, The Canadian Journal of Chemical Engineering, 82, p. 30 (2004). Mudde, R.F., H.B.M. Schulte, H.E.A. van den Akker, ‘Analysis of a bubbling 2-D gas-fluidized bed using image processing’, Powder Technology, 81, p. 149 (1994).
ACKNOWLEDGEMENTS This work is part of the Research Program of the Dutch Polymer (DPI) Institute under project number #354.
Muller, C.R., J.F. Davidson, J.S. Dennis and A.N. Hayhurst, ‘A study of the motion and eruption of a bubble at the surface of a two-dimensional fluidized bed using particle image velocimetry (PIV)’, Ind. Eng. Chem. Res. 46(5), p. 1642 (2007).
REFERENCES Almendros-Ibanez, J.A., C. Sobrino, S. Sanchez-Delgado, D. Santana. M. de Vega and U. Ruiz-Rivas, ‘Througflow velocity crossing the dome of erupting bubbles in 2-D fluidized beds’, Fluidization XII, Vancouver (2007), p. 169.
Pallares, D. and F. Johnsson, ‘A novel technique for particle tracking in cold 2-dimensional fluidized beds – simulating fuel dispersion’ Chemical Engineering Science, 61, p. 2710 (2006).
Agarwal, P.K., A.S. Hull and K.S. Lim, ‘Digital Image Analysis Techniques for the Study of Bubbling Fluidized Beds’, in ‘Non-Invasive monitoring of multiphase flows’, J. Chaouki, F. Larachi, M.P. Dudukovic, Elsevier Science B.V., Amsterdam, The Netherlands (1997), p. 407-454.
Shen, L., F. Johnsson and B. Leckner, ‘Digital image analysis of hydrodynamics two-dimensional bubbling fluidized beds’, Chemical Engineering Science, 48, p. 2607 (2004).
Bokkers, G.A., M. van Sint Annaland and J.A.M. Kuipers,‘Mixing and segregation in a bidisperse gas-solid fluidised bed: a numerical and experimental study’, Powder Technology 140, p. 176 (2004).
Utikar, R.P. and V. V. Randade, ‘Single jet fluidized beds: Experiments and CFD simulations with glass and polypropylene particles’, Chemical Engineering Science, 62, p. 167 (2007).
Dijkhuizen, W., G.A. Bokkers, N.G. Deen, M. van Sint Annaland and J.A.M. Kuipers, ‘Extension of PIV for measuring granular temperature field in dense fluidized beds’, AIChE Journal 53(1), p. 108 (2007).
Werther, J., ‘Effect of Gas Distributor on the Hydrodynamics of Gas Fluidized Beds‘, German Chemical Engineering, 1, p. 166 (1978)
Duursma, G.R., D.H. Glass, S. Rix and M.I. YorquezRamirez, ‘PIV investigations of flow structures in the fluidised bed freeboard region’, Powder Technology 138, p. 2 (2001).
Westerweel, J., ‘Fundamentals of digital particle image velocimetry’, Meas. Sci. Technol., 8, p. 1379 (1997).
10