Finally, the practical usefulness of such tools for operational security monitoring .... For a Trojan horse attack, the effort can be assessed as the competence ...
Experimenting with Quantitative Evaluation Tools for Monitoring Operational Security* Rodolphe Ortalo, Yves Deswarte, Mohamed Kaâniche LAAS-CNRS & INRIA Abstract: This paper presents the results of an experiment of security evaluation. The evaluation method used is based on previous work involving modeling the system as a privilege graph exhibiting the security vulnerabilities and on the computation of measures representing the difficulty for a possible attacker to exploit these vulnerabilities and defeat the security objectives of the system. A set of tools has been developed to compute such measures and has been experimented to monitor a large real system during more than a year. The experiment results are presented and the validity of the measures is discussed. Finally, the practical usefulness of such tools for operational security monitoring is shown and a comparison with other existing approaches is given.
1
Introduction
Security is an increasing worry for most computing system administrators: computing systems are more and more vital for most companies and organizations, while these systems are made more and more vulnerable by new user requirements and new services (groupware and other information sharing facilities; interconnection to insecure networks; powerful applications whose complexity may hide serious security flaws; etc.). On the other side, for most users of current computing systems, security is not a main concern and they are not prepared, for the sake of security, to waive their system ease of use or to give up information sharing facilities. In such conditions, it is difficult to reach an acceptable degree of security, since users play an important role in the computing system security: even the best system, designed for the highest security, would be insecure if badly operated by casual users and a lax use of the most efficient protection mechanisms would introduce flaws that could be exploited by possible attackers. Thus, one of the main tasks of most computing system administrators is to negotiate with system users to make them change their careless behavior and improve the system security. And this is not an easy job: why would a user renounce his bad habits, if he considers that he does not own sensitive data or applications? It may be difficult for him to understand that the flaws he introduces in the system are endangering other user accounts, possibly with more sensitive information. The set of tools here presented aims at facilitating this administrator’s *
To appear in Proc. of the 6th IFIP Working Conf. on Dependable Computing for Critical Applications (DCCA-6), Garmish-Partenkirchen, Germany, March 5-7 1997, IEEE Computer Society Press.
task: by providing a quantitative assessment of the current system security level, these tools can help him to identify those security flaws which can be eliminated for the best security improvement with the least incidence to users. Such quantitative evaluation tools should also enable him to monitor the evolution of the global system security with respect to modifications of the environment, of the configurations, of the applications or of the user behavior. The measurements delivered by the evaluation tools should represent as accurately as possible the security of the system in operation, i.e. its ability to resist possible attacks, or equivalently, the difficulty for an attacker to exploit the vulnerabilities present in the system and defeat the security objectives. Several characteristics can be deduced from these definitions: •
The security measure characterizes the security of the system itself, independently of the threats it has to face up to: the system is the same (and its security measure should be the same) whether there are many or few potential attackers with high or low competence and tenacity. But of course, a given system (with a given security measure) will be more probably defeated by many competent, tenacious attackers than by few lazy ones!
•
The security measure is directly related to security objectives: a system is secure as long as its main security objectives are respected, even if it is easy to perform illegitimate actions which do not defeat the objectives. For instance, a system can be secure even if it is easy for an intruder to read some public information.
•
The security measure should evolve according to system modifications influencing its security: any modification can bring new vulnerabilities and/or correct previous ones and the security measure should be sensitive to such modifications. The main use of such measures is to monitor security evolution of a given system rather than rate absolutely the security of different systems: it is more important to know if the security of a given system is improving or decaying than to compare the security of independent systems, with different objectives, applications, users, environments, etc.
A theoretical framework has been developed at LAAS to identify and compute such measures [Dacier, Deswarte et al. 1996a, Dacier 1994]. This framework is based on: 1) a theoretical model, the privilege graph, exhibiting the system vulnerabilities, 2) a definition of the security objectives, 3) a mathematical model based on Markov chains to compute the security measures. To demonstrate the practical feasibility of the approach, this theoretical framework has been implemented by a set of software tools which can compute the security measures of large Unix systems. But a major question is raised by such an approach: what is the validity of the obtained measures to represent accurately the system security? In this domain, no direct validation is expected: real attacks on real systems are too rare for a precise correlation to be obtained between the computed measures and a success rate of attacks; even a tiger team approach would probably be inefficient since such attacks are not necessarily representative of real attacks, and because for a good accuracy, tiger team attacks must be numerous on a stable system [Olovsson, Jonsson et al. 1995] while our measures are intended to rate the dynamic evolution of the system security. So the only practical validation is experimental: we have chosen to observe the security measures computed on a real full-scale system during a long period and to analyze each significant measure change with respect to the events triggering these changes.
This paper presents this experiment. Section 2 presents a short description of the theoretical framework. Section 3 presents the experiment itself and discusses the results. Finally, Section 4 draws a conclusion.
2
Presentation of the approach
2.1
Formal description of operational system vulnerabilities
It has been shown in [Dacier and Deswarte 1994] that the vulnerabilities exhibited by an operational computing system can be represented in a privilege graph. In such a graph, a node X represents a set of privileges owned by a user or a set of users (e.g., a Unix group). An arc from node X to node Y indicates that a method exists for a user owning X privileges to obtain those of node Y. Three classes of vulnerabilities may be identified: •
A vulnerability represented by an arc can be a direct security flaw, such as an easily guessed password or bad directory and file protections enabling the implantation of a Trojan horse.
•
But a vulnerability is not necessarily a security flaw. Instead, it can result from the use of a feature designed to improve security. For instance, in Unix, the .rhosts file enables a user U1 to grant most of his privileges to another user U2 without disclosing his password. This is not a security flaw if U1 trusts U2 and needs U2 to undertake some tasks for him (less secure solutions would be to give his password or reduce his protection). But if U2 grants some privilege to U3 (U2 is trusting U3), then by transitivity, U3 can reach U1’s privileges, even if U1 does not trust U3.
•
A third class of arcs is the representation of privilege subsets directly issued from the protection scheme. For instance, with Unix groups, there is an arc from each node representing the privilege set of a group member to the node representing the privilege set of the group.
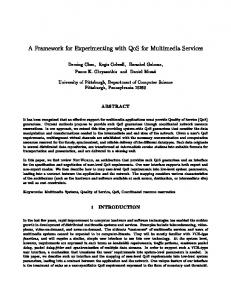
Figure 1 gives an example of such a privilege graph with arcs being labeled by vulnerability classes. 3
P1
7
A B
6
Xadmin
5
1 insider
4 2
F
1) X can guess Y's password; 2) X is in Y's .rhosts; 3) Y is a subset of X; 4) X can attack Y via Email; 5) Y uses a program owned by X; 6) X can modify a setuid program owned by Y.
Fig. 1: Example of a privilege graph Some sets of privileges are highly sensitive (e.g., the superuser privileges). These nodes are called “target” nodes since they are the most likely targets of attacks. On the other hand, it is possible to identify some nodes as the privileges of possible attackers; these nodes will be
called “attacker” nodes. For example, we can define a node called “insider” which represents the minimal privileges of any registered user (e.g., the privilege to execute login, to change his own password, etc.). If a path exists between an attacker node and a target node, then a security breach can potentially occur since, by transitivity, a possible attacker can exploit system vulnerabilities to obtain the target privileges. In most real systems, such paths exist because a lot of possible vulnerabilities exist, even if most of them cannot be exploited by an attacker. For instance, all passwords can be guessed with some luck, but some passwords can be easily obtained by all “insiders” because they are in a dictionary and automatic tools such as crack [Muffet 1992] can identify them in a short time, while other passwords are much more complex and the only practical means to get them is by exhaustive searching. This is true for each class of arcs: some vulnerabilities are easily exploitable by an attacker (e.g., the arc corresponding to a group membership), while others may request knowledge, competence, tenacity or luck. This means that even if a path exists between an attacker node and a target node, the system security has a low probability to be defeated if an attacker needs a lot of cleverness, competence or time to run through all the arcs composing the path. With the definition given in Section 1, a measure of the difficulty for the attackers to reach the targets would be a good measure of the security of the system. To assess this measure, each arc in the privilege graph can be assigned a weight corresponding to the “effort” needed for a potential attacker to perform the privilege transfer corresponding to this arc. This notion of effort is encompassing several characteristics of the attack process such as pre-existing attack tools, time needed to perform the attack, computing power available for the attacker, etc. [Littlewood, Brocklehurst et al. 1993]. For example, the effort needed to obtain a password can be assessed by the computing power and the time needed by crack to identify the password. For a Trojan horse attack, the effort can be assessed as the competence needed to design the Trojan horse, the time needed to implant it in a program which can be executed by the target user, and the time needed for the target user to activate it (the latter does not depend on the attack process, but only on the user behavior). The effort weight assigned to an arc is thus a compound parameter, which can be represented as a rate of success for the corresponding elementary attack. The following section presents a model to compute the global privilege graph security measure from the elementary arc weights.
2.2
Assumptions
In order to evaluate quantitative measures characterizing the operational security based on the privilege graph, it is necessary to identify the scenarios of attacks that may be attempted by a potential attacker to reach the target. First, we assume that the attacker is sensible and he will not attempt an attack which would give him privileges he already possesses. Additional assumptions are required to characterize the progress of the attacker towards the target. Different models can be defined depending on the assumptions considered about the behavior of the attacker. The first model that can be considered is to assume that the attacker chooses the shortest path leading to the target (denoted as SP in the following), i.e. the one which has the lowest mean value of cumulated effort. The shortest path can be evaluated directly from the privilege graph taking into account the rates assigned to the arcs. However, this assumption implicitly
means that the attacker knows in advance the whole topology of the privilege graph. But, to build the whole privilege graph the attacker needs all the sets of privileges described in the graph. If the attacker already has these privileges, he does not need to build the graph! Clearly, the shortest path assumption is not satisfactory. In the following, we will introduce two alternative assumptions and show that the corresponding security measures are more instructive for the security administrators than measure SP. The attacker’s privileges increase as a result of his progress towards the target can be characterized by a state-transition graph where each state identifies the set of privileges that he has already gained and transitions between states occur when the attacker succeeds in an attack allowing him to acquire new privileges. In order to fully characterize the attack process state graph, we need to specify an additional assumption which defines which attacks will be attempted by the attacker at each step of the attack process. Two different assumptions are discussed hereafter, each of them corresponding to a specific attack process model (i.e. attacker profile): Total memory (TM) assumption: at each step of the attack process, all the possibilities of attacks are considered (i.e. those from the newly visited node of the privilege graph and those from the already visited nodes that he did not apply previously). At each step, the attacker may choose one attack among the set of possible attacks. Memoryless (ML) assumption: at each newly visited node of the privilege graph, the attacker chooses one of the attacks that can be issued from that node only (without considering the other attacks from the already visited nodes that he did not apply previously). For both assumptions, it is assumed that the attack process stops when the target is reached. We do not consider situations where attackers may give up or interrupt their process. Figure 2 plots the state graph attack process associated with the example given in Figure 1 when assumptions TM and ML are considered. It is assumed that “insider” is the attacker node and “A” is the target node. To improve the clarity of the figure, Xadmin and insider are respectively referred to as X and I. It can be seen that the scenarios of attacks represented in Figure 2-b correspond to a subset of those identified in Figure 2-a.
2.3
Mathematical model
In order to be able to compare the evolution of the security measures corresponding to assumptions TM, ML and SP, we need to specify the mathematical model that is used to evaluate the mean effort for an attacker to reach the target. Our investigations led us to choose a Markovian model which satisfies some intuitive properties regarding security evolution (see [Dacier, Deswarte et al. 1996a, Dacier, Deswarte et al. 1996b] for further details). The Markov model is based on the assumption that the probability to succeed in a given elementary attack before an amount of effort “e” is spent is described by an exponential distribution given by:
I 1
2
IP1 3 AIP1 3 AFIP1
I
FI 1
2 FIP1
4 FIP1 X
FIX 1 FIP1X
5 BFIX
3 3 6 6 AFIP1X AFIP1 X AFIP1X AFIP1X
5 BFIP1 X 6 ABFIP1 X 3 ABFIP1X
4
FIP1
3 4 FIP1X AFIP1
3 6 AFIP1X AFIP1X
1
5 BFIP1X 6 ABFIP1 X 3 ABFIP1 X
AFIX ABFIX
1 7 BFIP1X BFIP1 X
6 ABFIP1 X 3 ABFIP1 X
IP1
6 ABFIP1 X
3 ABFIP1X
FI
6 6
5 BFIP1X
2
6 ABFIP1 X
3 ABFIP1 X
4
3 AIP1
FIX 6 AFIX
5 BFIX 7 BFIP1X 3 ABFIP1 X
(a) TM assumption (b) ML assumption Fig. 2: Attack process state graph associated to the example of Figure 1 P(e) = 1- exp(-λe), where λ is the rate assigned to the attack. Practical considerations derived from the use of this distribution are the following: •
The potential attacker will eventually succeed in reaching the target, if a path leading to the target exists, provided that he spends enough effort.
•
The mean effort to succeed in a given attack is given by 1/λ.
The last point is particularly valuable since the knowledge of the attack rates is sufficient to characterize the whole distribution. The first point deserves some clarifications. In fact, as our aim is to evaluate system resiliency to successful attacks with respect to a specified target, we only consider scenarios of attacks that eventually lead to the target and not the scenarios which may be aborted during the attack process. Based on the Markovian assumption, each transition in the state transition attack process is rated with the success rate of the corresponding vulnerability. Various probabilistic measures can be derived from the model, among these, the mean effort for a potential attacker to reach the specified target, denoted as METF (Mean Effort To security Failure, by analogy with Mean Time To Failure). This metric allows easy physical interpretation of the results: the higher the METF the better the security. Moreover, simple analytical expressions can be easily obtained and analyzed in order to check the plausibility of model results. The METF is given by the sum of the mean efforts spent in the states leading to the target which are weighted by the probability of visiting these states. The mean effort spent in state j, denoted as Ej, is given by the inverse of the sum of state j's output transition rates: E j= 1 ⁄
∑ λ ji
(1)
i ∈ out( j)
out(j) is the set of states reachable in a single transition from state j and λji is the transition rate from state j to state i.
Let us denote by METFk the mean effort when state k is the initial state and Pki the conditional probability transition from state k to state i, then: METF k = E k +
∑
i ∈ out(k)
P ki × MET F i
P ki = λ ki × E k
(2)
According to this model, the highest output conditional probabilities values correspond to the transitions with the highest success rates. Clearly, the complexity of the METF computation algorithm is related to the size of the attack process state graph associated to the assumption adopted: for assumption TM, the number of paths leading to the target to be considered is higher than the number of paths corresponding to assumption ML.
2.4
Assumptions TM, ML and SP: expected behaviors
In the following, we analyze the expected behaviors of the METF when assumptions TM, ML and SP are considered. 2.4.1
Single path
Let us consider first the example of a privilege graph containing a single path between the attacker node and the target node (see Figure 3). In this case, the METF is given by ∑ 1 ⁄ λ j where k is the number of arcs in the path and λj is the success rate associated to the j = 1…k
elementary attack j. The same value of the METF is obtained when either assumption TM, ML or SP is considered. Clearly, as the number of arcs increases, the METF increases and the security improves. Also, when the values of λj increase, the METF decreases and the security degrades. X
λ1
Y
λ2
Z
λk
W
Fig. 3: Markov model corresponding to a single path 2.4.2
Multiple paths
As regards the SP assumption, the shortest path is obtained by identifying in the privilege graph all the direct paths from the attacker node to the target node and evaluating the minimum value of the METF among the values computed for each direct path. A direct path from the attacker to the target is such that each node that belongs to this path is visited only once. The expression of METFSP is: METFSP = min {U1, …, Un} where Uk = ∑ 1 ⁄ λi , λi is the rate assigned to the arc i that belongs to direct path k, n is the number of direct paths. The METF values corresponding to assumptions TM or ML can be obtained by processing the corresponding state transition attack process. Let us consider the example of Figure 4 where A is the attacker and D is the target. The privilege graph (Figure 4-a) indicates the pre-
sence of two paths leading to the target. The Markov models corresponding to assumptions ML and TM are given in Figure 4-b and 4-c respectively. Application of relations (1) and (2) leads to the following expressions. λ3 λ1 1 1 1 METF ML = ----------------- + ----------------- × ----- + ------------ × ----λ1 + λ3 λ1 + λ3 λ2 λ + λ λ4 λ3 λ1 1 1 1 METF TM = ----------------- + ----------------- × ----------------- + ----------------- × ----------------- λ 1 + λ 3 λ 1 + λ 3 λ 2 + λ 3 λ 2 + λ 3 λ 2 + λ 4 λ1 λ3 1 1 + ----------------- × ----------------- + ----------------- × ----------------- λ 1 + λ 3 λ 1 + λ 4 λ 1 + λ 4 λ 2 + λ 4
B
λ1
2
1
λ2
D C
4
(a) Privilege graph
λ1
λ3 ABC
A
λ3
AC
λ4
λ2
AB
ABD
A
A 3
AB
ACD
(b) Assumption ML
λ3
λ 2+λ4
ABD
ABCD
λ1 AC
λ4
ACD
(c) Assumption TM
Fig. 4: Multiple paths—example It could be seen that, for any value of λ1, λ2 and λ3, the expression of METFTM is always lower than 1 ⁄ λ1 + 1 ⁄ λ2 (which corresponds to the case where only the first path exists), and to 1 ⁄ λ 3 + 1 ⁄ λ 4 (which corresponds to the case where only the second path exists). This result illustrates the fact that the addition of new paths leading to the target in the privilege graph surely leads to a decrease of METFTM which indicates security degradation. This result can be easily generalized, further details can be found in [Dacier 1994]. However, assumption ML leads to a different behavior since METFML may increase or decrease depending on the values of the parameters. For instance, METFML is lower than 1 ⁄ λ 1 + 1 ⁄ λ 2 only if 1 ⁄ λ 4 < 1 ⁄ λ 1 + 1 ⁄ λ 2 , i.e., when the mean effort spent in obtaining the privileges of node D from node C is lower than the mean effort corresponding to the initial path. This is due to the fact that, with assumption ML and contrarily to assumption TM, when the attacker chooses a given path he never backtracks until he reaches the target. If the modifications introduced in the privilege graph lead to some additional paths which are shorter than those derived from the initial privilege graph then METFML decreases, otherwise the METFML increases. From the previous discussion, it can be concluded that METFTM is always lower than the mean effort calculated based on the shortest path only (METFTM ≤ METFSP). For assumption ML, METFML may be lower or higher than METFSP depending on the values of the parameters and the structure of the privilege graph. The last property that is worth mentioning concerns the comparison of METFML with METFTM. Since the attack scenarios corresponding to assumption ML are a subset of those obtained with assumption TM, it can be proved that, for the same privilege graph, assumption ML leads to higher METF values than assumption TM: METFML ≥ METFTM.
2.5
Discussion
Based on the results of the previous section, Table 1 summarizes the expected behavior for measures METFML and METFTM when the number of paths between the attacker and the target set of privileges increases. It is noteworthy that we do not consider the simultaneous occurrence of several modifications of the privilege graph (addition or deletion of vulnerabilities, or modification of the rates assigned to the vulnerabilities). Different simultaneous modifications may influence diversely the system security and thus it is difficult to predict the type of behavior to be observed for the security measures. In operational systems, it is frequent that only one modification of the privilege graph occurs at a time. If the privilege graph is constructed each time a modification occurs, then it is likely that the typical behaviors reported in Table 1 will be always satisfied. When only one modification of the privilege graph occurs, we should expect that: •
if the number of paths increases because of the addition of a new vulnerability, METFTM decreases since this new path weakens the security of the target,
•
when the shortest path between the attacker and the target decreases, METFTM decreases and shows a degradation of security.
•
as discussed in the previous section, two kinds of behavior may be observed for METFML: •
if the new path decreases the probability of taking another relatively easy path to the benefit of a longer new one, METFTM may increase (indicated as behavior 2 in Table 1).
•
otherwise, METFML should have the same evolution as METFTM: it should decrease as the number of paths increases and reveal a degradation of security (behavior 1). METFTM
METFML
Behavior
Number of Paths
↑
↓
↓
1
Number of Paths
↑
↓
↑
2
Table 1: Typical behaviors Clearly, assumption TM allows easier interpretation of security evolution. By analyzing the variation of this measure together with the modifications introduced in the privilege graph, the security administrators can assess whether these modifications have a significant impact on security. Based on these results, they can identify the most critical paths in the privilege graph and take appropriate decisions: either correct some system weaknesses (when security decreases) or keep the system configuration unchanged if the risks induced by the modifications are not significant (either security increases or only a small decrease in the METF is observed). As regards assumption ML, the increase of METFML when the number of paths increases may be considered as unrealistic as it could mean that the security increases when additional vulnerabilities are introduced. This kind of measure behavior is due to the ML attacker profile
which assumes that when the attacker chooses a given path he never leaves it. If the top events appearing in the selected path correspond to easy attacks, then the attacker is inclined to choose this path. Then, if the following attacks require too much effort to succeed, the mean effort to reach the target will increase. The main question is whether this type of attacker profile is realistic or not. It is difficult to answer this question because of lack of real data. In the experiment presented in the following section, we will show that valuable information about security evolution can be provided to security administrators even when only model ML is considered. Indeed, as we are mainly interested in METF variation rather than in the absolute values of this measure, any significant variation of the METF has to be thoroughly examined. Concerning the shortest path, it is clear that the information provided by this measure is incomplete as only one path in the privilege graph is taken into account. Therefore, the security variation due to the presence of the other paths will not be identified if only the shortest path is computed to monitor the operational security.
3
Experiment
3.1
Tools description
The experiment presented in this section has been conducted using a set of tools. The main steps of the evaluation process are: 1) Definition of the security policy: For each security objective chosen for the system, the relevant security targets (sets of privileges that must be protected), and the potential attackers (sets of privileges against which targets should be protected) are identified. Each attacker-target pair corresponds to two sets of nodes in the privilege graph for which one quantitative evaluation is needed. A tool has been developed to describe formally the security objectives from which all pairs are identified and gathered into a file. 2) Probing the system and building the privilege graph: We have developed a tool named ASA, for Automatic Security Advisor, which looks for known vulnerabilities in the Unix system under study and builds the related privilege graph. The tool runs with extended privileges in order to be able to analyze all parts of the system. So far, ASA is using many procedures included in the COPS package [Farmer and Spafford 1990]. More precisely, like in COPS, some Unix scripts scan the Unix file system, gathering information about the access permissions of several files either for each user or for specific directories. A crack program is run to guess user passwords using a standard dictionary. Each time a vulnerability is detected in the system, an arc is added to the privilege graph under construction. As we do not know at this step of the analysis if the potential vulnerability identified is a relevant security flaw, no correction is attempted. The output of the ASA tool is therefore a privilege graph describing all known vulnerabilities of the target system at the time of the snapshot. After probing the system, the privilege graph built may be recorded in an archive. This archive will be regularly augmented by using classical Unix tools such as cron to allow automatic and periodic analysis of the system. 3) Evaluation: Subsequently, another tool computes the security measures presented in Section 2 for each security objective. These computations can be applied to either a single privilege graph or a whole archive.
4) Identification of security-relevant events: Last, to ease the analysis of the security measures computed, a tool identifies for each significant variation of a measure the security events that have caused it. More precisely, it looks for the arcs involved in the paths between the attacker and target sets that changed between two consecutive privilege graphs. This helps to identify the event(s) that caused this measure evolution. An example of the output of this tool is given in Annex A.
3.2
Target system description
The system under observation in this experiment is a large distributed computer system of more than a hundred different workstations connected to a local area network. There are about 700 users sharing one global file system. During the experiment, the total number of users have changed frequently due to the arrival and departure of temporary staff (a frequent event for the target system). The probing of security vulnerabilities is made on the global file system. In this experiment, the system has been observed during 13 months on a daily basis, starting in June 1995 until the end of July 1996. The archive of privilege graphs contains 385 items (one for each day). In the target system of this experiment, security is not a main concern of the users. Since no critical information is stored in the system, it is not necessary to enforce a strong global security policy, even if sometimes some users or the system administrators might worry about it for personal reasons, or for safety reasons. This explains the important number of known vulnerabilities that will be shown hereafter. It is noteworthy that most vulnerabilities persist and are accepted because they often provide useful and convenient functionalities. Furthermore, our main objective being to validate the behavior of the security measures, we only observed the “natural” evolution of the system. We did not try to convince the users to remove the vulnerabilities we had identified to improve the system security.
3.3
Experiment settings
3.3.1
Security objectives
Evaluating security measures requires that relevant sets of target(s) and attacker(s) be defined. These pairs are related to the security objectives one would like the system to fulfill as much as possible. For a Unix system, one important target to protect against attacks is the root account, and more generally, every account allowing to obtain superuser* privileges. Another interesting target to study is the group of all system administrators, giving access to all the data they share. To select a precise attacker we choose the “insider” set of privileges defined in Section 2. Table 2 summarizes these case studies. For the analysis of the second security objective, one problem appears due to the existence of superusers in Unix. A superuser is able to get all the privileges of any other user in the system. Thus, when we consider a target set of users to protect, this mechanism implicitly leads us *
In Unix, the superuser privilege bypasses the access control mechanisms.
Objective 1 Objective 2
Attacker
Target
insider insider
root admin_group
Table 2: Security objectives to include the superuser in it (as this set of privileges includes any other set). If we had considered that, objective 2 would have included objective 1, as if one sequence of privilege transfer methods enables to defeat objective 1 it also defeats objective 2. In order to have completely distinct case studies, we did not consider vulnerabilities linked to superuser properties for objective 2. We then removed from the privilege graphs all the instantaneous arcs going directly from the superuser to the admin_group set of privileges. 3.3.2
Vulnerabilities
From all the known vulnerabilities in Unix, we monitored 13 among the most common, including: password checking (with crack software); user-defined privilege transfer methods (.rhosts); incorrect/exploitable permissions on setuid files, .rhosts files or initialization files (.profile, .cshrc, etc.); incorrect path search that allows Trojan horse attacks; etc. A more detailed review of all the classical Unix vulnerabilities can be found in [Garfinkel and Spafford 1995]. In addition to this, specific arcs labeled “instantaneous” correspond to inclusions of privilege sets, for example, between one user node and all the nodes of the Unix groups he belongs to. Security state modifications, or events, occur when vulnerabilities are either created or eliminated (arcs in the privilege graph are added or deleted) or when the value associated to one vulnerability (the weight assigned to an arc) changes. Such events occurred frequently during the experiment. 3.3.3
Quantification
For the experiment, we defined a four level classification scale (see Table 3), where the different levels differ from each other by one order of magnitude, to rate the different vulnerabilities: level1 corresponds to the easiest elementary attacks, and level4 to the most difficult ones. Name
Weight
level1 level2 level3 level4
10-1 10-2 10-3 10-4
Table 3: Attack success rate levels The various levels assigned to each attack are rather arbitrary. Evaluating precisely the success rate of the various attacks present in the system would have required additional tools (such as for recording user profiles) that are not currently available in our prototype. However, this is
not a serious drawback as this experiment aims primarily at validating the security measures behavior rather than precisely rate the security of the system.
3.4
Experiment results
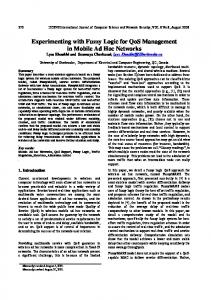
The results of this experiment corresponding to objectives 1 and 2 are presented in Figure 5 and Figure 6 respectively. The measures presented are: the number of paths found between attacker and target sets, METFSP, METFTM and METFML. The list of corresponding security events is given in Annex A. 1000
#2
#6 #7
#11
→ root
insider
#24
100
10
#13
#16
1 P 0.1 06/95
07/95 08/95 09/95 10/95 11/95 12/95 01/96 02/96
03/96 04/96 05/96 06/96 07/96
METF-ML
1000
insider
→
08/96
METF-TM
root
100
10
1
0.1 06/95
07/95 08/95
09/95 10/95
11/95 12/95
01/96 02/96 03/96
04/96 05/96
Number of paths
06/96 07/96
08/96
METF-SP
Fig. 5: Measures evolution for objective 1 METFTM can only be computed when the number of paths between the attacker and the target is relatively small. Thus, the thick line curves in the two graphics sometimes present gaps
insider
#24
→
admin_group
1000
#6 #2
#7
#11
#16
100
P
#13 10 06/95
07/95 08/95 09/95 10/95 11/95 12/95 01/96 02/96
03/96 04/96 05/96 06/96 07/96
METF-ML
insider
1000
→
08/96
METF-TM
admin_group
100
10
1 06/95
07/95 08/95 09/95 10/95 11/95 12/95 01/96 02/96
03/96 04/96 05/96 06/96 07/96
Number of paths
08/96
METF-SP
Fig. 6: Measures evolution for objective 2 due to the uncomputability of this measure (unfortunately, very large gaps appear in Figure 6). For each significant measure variation, the cause has been analyzed and a detailed description is given in Annex A.
3.5
Experiment feedback
In the following, we analyze a subset of the events included in Annex A to check the assumptions and expected behaviors discussed in Section 2.4 and Section 2.5.
3.5.1
Events #2, #7 and #11 for objective 1
For objective 1, the events #2, #7 and #11 exhibit a global behavior of type 1 (see Table 1). Each of these events satisfies the conditions in which such behavior should be observed: they add one new vulnerability to those already available to the attacker to reach the root target, therefore increasing the total number of possible paths between the attacker node and the target. Furthermore, the shortest path does not evolve because these new paths are not shorter than the previous shortest one. More precisely, the vulnerabilities corresponding to these events are described in Table 4 (extracted from Table 5): Event
Date
#2
18 Jun 95
#7
7 Sep 95
#11
18 Oct 95
Problem One user grants write permissions to everyone for his home directory (allowing to implant a Trojan horse that careless users could activate for example). Another user grants write permissions to everyone on his .login initialization file, allowing a major Trojan horse attack that would be activated at his next login. A third user grants write permission to everyone on his .rhosts file, enabling an immediate attack via the identity transfer mechanisms of Unix.
Table 4: Examples of vulnerabilities leading to behavior 1 As can be seen in Figure 5 and Figure 6 and in the detailed table of Annex A, METFTM always decreased as the result of occurence of each of these events, showing a degradation of security. The amplitude of this evolution is variable (depending on the difficulty related to the new vulnerability and on its relative position with respect to previously existing paths). In fact, this has been verified for METFTM on every single degradation of the security, but sometimes, the relative variation of this measure is very small and is not visible on the plots. Therefore, in the whole experiment, the behavior of METFTM was in agreement with the expectations. Moreover, for each of the events #2, #7 and #11, METFML evolution is similar to the evolution of METFTM. 3.5.2
Event #11 for objective 2
For objective 2, the event #11 has a different impact on the security measures that illustrates behavior 2. In this case, an increase in the number of paths between the attacker and the target has lead to a decrease of the METFTM and an increase of METFML. We expected that the METFML and METFTM measures would not always evolve in the same direction. This happens when a secondary path appears that lengthens a previous path. It influences the METFML that shows an improvement by reducing the probability of selecting a fast path, while METFTM, only affected by the fact that a new path has been created, shows a degradation. 3.5.3
Event #24 and period P for objective 1
At the beginning of March 1996, a strong decrease of the shortest path between the attacker and the target of objective 1 occurred (Event #24). Figure 5 shows that METFML and METFTM decrease as a result of this evolution.
Period P that followed event #24 also exhibits an interesting behavior. During this period, it can be seen by comparing the two curves of Figure 5, that METFTM was nearly equal to METFSP*. The influence of the shortest path is so important here that its length directly controls the value of METFTM and the behavior of METFML. We are in the case where it is possible for the attacker to reach the target in a few very easy steps. In such a situation, it is clear that the target is not well protected. Furthermore, as its security is directly affected by the vulnerabilities appearing in the shortest path, it would be mandatory to react and disable such vulnerabilities. 3.5.4
Events #6 and #13 for objectives 1 and 2
On both Figure 5 and Figure 6, we also observed a similar phenomena: sudden important increases of the number of paths (at November 1995 for objective 1, and at the end of August 1995 and November 1995 for objective 2). The problem involved was an incorrect positioning of the write permission for the others field of Unix permissions on an important initialization file. This created a path to the target for nearly every user in the system, and thus provided the “insider” user with as much intermediate initial paths as there were vulnerable users in the overall system. This phenomenon is normal, and is a very security-relevant event, but disturbs the evaluation of security for two reasons: • first, the dramatic increase in the number of paths precludes the computation of METFTM (that should have shown a decrease in security); • second, all the new paths being longer than the previous ones, METFML increases. In fact the “insider” attacker is much more likely to choose a long path and spend a lot of effort in the system before reaching the target, and the METFML is sensitive to that. This is a normal evolution of METFML, but may not be a satisfying indication of the overall security evolution. However, in these cases, the dramatic increase of the number of paths between the attacker and the target indicates directly that thorough security analysis must be performed. 3.5.5
Event #16 for objective 2
In order to validate our modeling assumptions , we need to consider the evolution of the security measures when only single events occur since the evolution cannot be predicted when several conflicting events occur. For instance, the consequence of event #16 on objective 2 seems to contradict the conclusions of Section 3.4.2.1: it shows an increase of the number of paths between the attacker and the target while both security measures METFTM and METFML increase. But this evolution is due to the occurrence of several simultaneous security events within the period of one observation of the system (1 day). Such situation occurred more than once during the experiment. *
In fact, the difference between measures TM and SP is very small (~10-3), of course, this is not direclty visible on the plot.
In fact, when looking more closely to the description of event #16 given in Table 5, it can be seen that three vulnerabilities have been disabled for two different users, and that one user has enabled a new one. The first two events should have a positive influence on security while the last one should have an opposite effect (it increases the number of paths). The evolutions of the measures seem to indicate that the last one has the least impact.
3.6
Comparison of the various measures
In addition to the results discussed in Section 3.5, we make in the following some other remarks about the comparison of the different measures shown in Figure 5 and Figure 6. 3.6.1
Shortest path
During all the period covered by the experiment, the shortest path evolved only 3 times (once for objective 1 and twice for objective 2). This measure provides an interesting information about the easiest path present in the system, however it is not dynamic enough to be useful for operational monitoring of the security evolution. As indicated in Section 2.5, in comparison with METFTM, the value of the shortest path does not take into account the fact that several equivalent paths could be available. In fact, more than its length, it is the nature of this path and of the vulnerabilities involved that can be of interest to improve the security as it is the path that seems to have the major impact on METFML and METFTM. 3.6.2
Number of paths
The number of paths between the attacker and the target is a sensitive information (it varies a lot) but it seems difficult to use alone for operational security monitoring. First, it can be noticed that a security event leading to a decrease or an increase of the number of paths between the attacker and the target does not necessarily lead to a significant variation of the other security measures (see #1, 18, 19, 20, 22 of Table 5). Theoretically, it seems possible to ignore such security events that have a minor influence on the mean effort to be spent by an attacker to reach the target. We are in the case where the impact of the addition or deletion of arcs in the privilege graph is relatively small compared to the global effort values even if the number of paths varies. On the contrary, we have identified some events that led to a significant evolution of METFML or METFTM whereas the number of paths changed slightly: see #2, 3, 4, 11, 12, 16, 17, 21, 23 in Table 5. We are therefore able to detect these particular events that have an important influence on the security of the system without significantly affecting the number of paths between the attacker and the target. Globally, we can see that the number of paths existing between the attacker and the target is a measure that would raise an important number of alarms among which some may be relatively uninteresting. Moreover, not all important security events would lead to the raise of an alarm. Consequently, this measure seems more difficult to use than METFML and METFTM and it is less reliable.
3.6.3
METFTM and METFML
These measures exhibit an interesting behavior, with stability periods separated by several variations. As can be seen in Annex A, each of these variations can be related to a security-relevant event. However, we can also see that METFTM cannot be computed all the time, which is a main drawback; and that METFML sometimes exhibit a delicate behavior in which it shows an increase of the effort needed by the attacker to reach the target when the number of paths between them increases (behavior 2). This weakens the confidence we can have in METFML, all the more when a single security event such as #6 or #13 can lead to a great increase of that measure. However, it seems possible to rely on METFML to reveal the degradation of the security of the target, and to react adequately to the most significant security events (on the contrary of the number of paths). Among all the measures, METFTM seems to exhibit the most plausible behavior. Additional work would be needed to reduce the complexity of the algorithm used to compute it and then to obtain the values that we miss here for a complete comparison with METFML.
3.7
Comparison with other security monitoring tools
Usually, tools dedicated to operational security analysis such as COPS or SATAN limit their action to a direct check of the system that ends with a list of all the known vulnerabilities present in it, possibly sorted in different classes according to their severity. As the prototype presented in this paper is heavily based on such tools (see ASA description in Section 3.1), we gathered these data and it is also interesting to compare the information provided on security at the end of this first step of the prototype and after the complete evaluation method is performed. 1200
1200 1000
1000
800
800
600
600
400
400
200
200
0 06/95
09/95
12/95
03/96
06/96
Fig. 7: Evolution of the total number of vulnerabilities
level1
0 06/95
09/95
12/95
level2
level3
03/96
level4
06/96
Fig. 8: Evolution of the distribution of vulnerabilities
Figure 7 plots the evolution of the number of known vulnerabilities in the system during the whole experiment. Figure 8 shows the same results, but details the distribution of the vulnerabilities audited among the various severity levels considered. If we were to use directly the information provided by Figure 7 or Figure 8 to monitor the security of the system, we can see that the number of alarms we would be faced to would be very important. In fact, each time a new security event occurs in the system, we would be obli-
ged to analyze it more precisely, even if it is a minor event, because we do not know exactly its influence on the security objectives. Probably, to reduce the number of alarms, one would try to take into account the severity level of the new vulnerabilities involved. However, we can see, by comparing Figure 8, Figure 5 and Figure 6, that an evolution of the number of severe vulnerabilities (level1 or level2) present in the system and a decrease of the overall security are not always correlated. Of course, our intention is not to depreciate the value of the results obtained by such automatic tools: it is an essential first step to handle operational security monitoring, and our evaluation method is mostly based on the data provided by these tools. However, and it is a well known problem, the number of alarms raised by such tools is important, and all of them cannot always be taken care of easily. The evaluation measures presented in the previous section enable the security administrator to extract from all these variations the ones that would really need reaction. Therefore, the results obtained by our evaluation method are complementary to those derived from classical security analysis tools.
4
Conclusion
In this paper, we have presented an approach aiming at the quantitative evaluation of the security of operational systems. The evaluation is based on a theoretical model, called the privilege graph, which describes the system vulnerabilities that may offer opportunities to potential attackers to defeat some security objectives. We have studied several modeling assumptions and discussed the validity of these assumptions based on an experimental study performed on a real system. Three different models are discussed corresponding to three assumptions about the attacker behavior: SP, TM and ML. The experiment results show that assumption TM is satisfactory because the behavior of the corresponding measure provides useful feedback to the security administrators in order to monitor the security of their system; i.e. evaluate the impact of the system vulnerabilities on the security objectives and identify the vulnerabilities which may lead to security degradation. Unfortunately, the security measure associated to assumption TM can not be always computed due to the complexity of the algorithm. On the other hand, the computation of the measure related to assumption ML is easier. However, it is more difficult for the security administrators to identify the appropriate actions to be done on the system based on the observed behavior of this measure only. In fact, in this case, any variation of the security measure should be carefully analyzed whereas, for assumption TM, only negative variation of the measure can be considered. Finally, it is concluded that the shortest path, the number of vulnerabilities and the number of paths are not sufficient to characterize the operational security evolution. The experimental results presented in this paper and the modeling assumptions considered constitute a preliminary investigation about the feasibility of security evaluation of operational systems taking into account their dynamic evolution, and about the benefits of these kinds of evaluations. Further work is needed to improve the accuracy of the measures considered in order to improve our confidence in them, and help the security administrators in better monitoring the security of their systems.
Acknowledgments The authors are grateful to Marc Dacier, now at IBM Zürich, for his remarks on an early version of this paper and for his pioneering work on quantitative evaluation of security. We also thank the anonymous referees for their helpful reviews. This work has been partially supported by UAP Assurances, and by the European Esprit Project n°20072 "Design for Validation" (DeVa).
References [Dacier 1994] M. Dacier, Towards Quantitative Evaluation of Computer Security, Doctoral Thesis, LAAS Report 94488 (in French), Institut National Polytechnique de Toulouse, December 1994. [Dacier and Deswarte 1994] M. Dacier and Y. Deswarte, “The Privilege Graph: an Extension to the Typed Access Matrix Model”, in European Symposium in Computer Security (ESORICS'94), (D. Gollman, Ed.), Lecture Notes in Computer Science, 875, pp.319-334, ISBN 3-540-58618-0, Springer-Verlag, Brighton, UK, November 1994. [Dacier, Deswarte et al. 1996a] M. Dacier, Y. Deswarte and M. Kaâniche, “Models and Tools for Quantitative Assessment of Operational Security”, in 12th International Information Security Conference (IFIP/SEC'96), (S.K. Katsikas and D. Gritzalis, Eds.), pp.177-186, ISBN 0-412-78120-4, Chapman & Hall, Samos (Greece), May 1996. [Dacier, Deswarte et al. 1996b] M. Dacier, Y. Deswarte and M. Kaâniche, Quantitative Assessment of Operational Security: Models and Tools, Technical Report, LAAS Report 96493, May 1996. (Extended version of [Dacier, Deswarte et al. 1996a].) [Farmer and Spafford 1990] D. Farmer and E.H. Spafford, “The COPS Security Checker System”, in the Summer Usenix Conference, Anaheim, CA, USA, 1990. [Garfinkel and Spafford 1995] S. Garfinkel and G. Spafford, Practical Unix & Internet Security, 971p., O'Reilly & Associates (Inc.), ISBN 1-56592-148-8, 1995, 2nd Edition. [Littlewood, Brocklehurst et al. 1993] B. Littlewood, S. Brocklehurst, N. Fenton, P. Mellor, S. Page, D. Wright, J. Dobson, J. McDermid, D. Gollmann, “Towards Operational Measures of Computer Security”, Journal of Computer Security, vol. 2, nos. 2-3, (S. Jajodia and J. Millen, Eds.), pp.211-229, ISSN 0926-227X, IOS Press, 1993. [Muffet 1992] A.D.E. Muffet, “Crack Version 4.1 — A Sensible Password Checker for Unix”, publicly available by ftp with the crack4.1 software at ftp.cert.org, 1992. [Olovsson, Jonsson et al. 1995] T. Olovsson, E. Jonsson, S. Brocklehurst and B. Littlewood, “Towards Operational Measures of Computer Security: Experimentation and Modelling”, in Predictably Dependable Computing Systems, Basic Research Series, (B. Randell, J.-C. Laprie, H. Kopetz and B. Littlewood, Eds.), pp.555-569, ISBN 3-540-59334-9, Springer-Verlag, Berlin, Germany, 1995.
Annex A - Detailed analysis of security state modifications A detailed description of each cause of a major security measure variation appearing in Figure 5 and Figure 6 is given in Table 5. Not all the security events that have occurred during the experiment are addressed here: we only considered those that led to a significant evolution of one of the measures. In this table, ∆NP, ∆ML and ∆TM designate the absolute variation of the number of paths, and the relative variation of METFML and METFTM respectively. “—” means that the value was not computable, and “~0” that the relative variation is less than 0.5%. Objective 1 Date
#
Users involved
Description
1995 U1’s password becomes guessable. U2’s home directory writable. Potential Trojan horse attack on U3’s .login and U4’s .tcshrc becomes less probable (change of starting shell). (Opposite of #3.) U21’s home directory becomes writable.
∆NP
17 Jun 18 Jun
1 U1 2 U2
19 Jun
3 U3, U4
20 Jun 29 Jun
4 U3, U4 0 5 U21 0 U12, and U12 provides attack means to nearly six hundred 6 many 0 other users. others Trojan horse attack on U5’s .login becomes possi- +2 7 U5 ble. U13’s password is no longer guessable. 8 U13, U14 U14 changes the false group ownership of some of 0 his initialization files. (This disabled #6). 9 U6 U6’s home directory writable. +2 10 U6 (Opposite of #9.) -2 11 U7 U7’s .rhosts becomes writable +2 12 U7 (Opposite of #11.) -2 Trojan horse attacks on some of U5’s initialization 13 U5 +46 files become possible for members of his group. U5 removed from U8’s .rhosts. (This disabled -46 14 U5,U8 #13.) 15 U9 New attack possible via a system file. +5 Some trojan horse attacks possible on U15 and U16 16 U15, 0 U16, U17 disabled. U17’s password becomes guessable.
24 Aug 7 Sep 9 Sep 14 Sep 20 Sep 18 Oct 20 Oct 25 Oct 29 Nov 1 Dec 19 Dec
on U15 and U16 are now possible again. 20 Dec 17 U15, U16 Attacks (Same vulnerability as formerly disabled in #8.) 1996 3 Jan 18 U10 U10’s password guessable. U1, U10, Objective 1: U10’s and U1’s password are no longer U15, guessable. (Opposite of #1 and #18.) Objective 2: U1, U10, U15, U16, U17, U18, U19, 5 Jan 19 U16, U17, U20 passwords are no longer guessable. (This corU18, U19, U20 rects one problem in #16.) Objective 1: U1’s password guessable. (Same vulnerability as #1.) Objective 2: U1, U10, U15, U16, U17, U18, U19, U20 passwords are again guessable. (Same problems as in #19 and #16.)
30 Jan 1 Feb
U1, U10, U15, 20 U16, U17, U18, U19, U20 21 root 22 U11
2 Feb
23 root
site of #21).
13 Jan
root becomes a member of admin_group. U11’s .mailrc init file writeable. root is no longer a member of admin_group. (Oppo-
Objective 2
∆ML (%) ∆TM (%)
∆NP
∆ML (%) ∆TM (%)
+2 +2
~0 -3
~0 -13
-1 +1
~0 +1
— —
0
+9
+22
0
-2
—
-8 0
-18 0
0 +1
+2 -7
— —
0
0
+3445
+108
—
-2
-8
+244
~0
—
0
0
-2867
-54
—
-2 +2 -8 +8
-6 +7 -27 +29
1 -2 +1 -1
+3 -2 +13 -12
-1 +1 -5 +6
+74
—
+24
+70
—
-41
—
-24
-43
—
-19
-9
0
0
0
0
0
+1
+8
+20
0
0
0
0
-8
-17
+3
~0
~0
1
~0
~0
-6
~0
~0
-6
+1
+2
+3
~0
~0
+5
-1
-2
0 +3
0 ~0
0 -1
+15 +4
-63 ~0
— —
0
0
0
-18
+170
—
Table 5: Analysis of security events for objectives 1 and 2
Objective 1 Date
#
Users involved
Description
∆NP
Objective 1: Attacks on U2, U3 or U11 disabled. U2, U3, (Opposite of #2, #3 and #22 respectively.) New attack possible via a system file for U22. U23’s pasU11, sword guessable. Several direct attacks on root are U15, possible for everyone. U16, Objective 2: Attacks on U15 and U16 are now disa- 0 21 Mar 24 U20, bled again. (Same vulnerability as formerly re-enaU22, bled in #17.) Attacks on U2, U3, U11 and U20 are U23, disabled. U20 is no longer a target. Vulnerable user U25, U23 acquires more privileges (new member of a U26, root group) and his password becomes guessable. U25 is vulnerable to a trojan horse attack made by U26. Attacks on U15 and U16 are now enabled again. 22 Mar 25 U15, U16 (Same vulnerability 0 as in #16, #17 and #24.) 28 Mar 26 U27 U27’s password becomes guessable. +3 3 Apr 27 U28 U28’s password becomes guessable. +3 Objective 1: U24’s home directory writable. One direct attack on root enabled. U32, Objective 2: U32 is no longer a target. U24’s home +3 5 Apr 28 U24, root directory writable. One direct attack on root enabled. 11 Apr 29 U15, U16 Attacks on U15 and U16 are now disabled again. 0 12 Apr 30 U1 U1’s password becomes guessable. +3 U33 and U34 are new target users. 16 Apr 31 U33, U34 U33 and U34 are vulnerable to some trojan horse at- 0 tacks on their initialisation files. 19 Apr 32 U6 U6’s home directory writable. +3 10 May 33 U6 U6’s home directory no longer writable. -3 Objective 1: U1’s password no longer guessable. 15 May 34 U1, U35 Objective 2: U35 is no longer a target user. -3 U1’s and U35’s passwords are no longer guessable. root, U9, Most direct attack on root are disabled. Neither U9, 30 May 35 U29, U22, U26, U29 nor U30 can now attack it via an -22 U30, U22, U26 (improbable) trojan horse. root, U9, 31 May 36 U29, (Opposite of #35.) +22 U30, U22, U26 3 Jun 37 root Most direct attack on root are disabled. 0 13 Jun 38 root Two direct attacks on root are disabled. 0 U32 is again a target and his home directory is now 16 Jun 39 U32 writable by member of some other group than his 0 own. 19 Jun 40 root One direct attack on root is enabled again. 0 root, Most remaining direct attack on root are disabled. 29 Jun 41 U26 0 Most attack from U26 to root are disabled. and U37 are new target users. 3 Jul 42 U36, U37 U36 0 U36’s and U37’s passwords are guessable. 4 Jul 43 U31 U31’s password becomes guessable. +3 U31’s password no longer guessable. 9 Jul 44 U31, U26 U23’s home directory becomes writable. 0 22 Jul 45 root One direct attack on root is disabled. 0
Objective 2
∆ML (%) ∆TM (%)
∆NP
∆ML (%) ∆TM (%)
-98
-98
+57
+1173
—
0
0
+120
-66
—
~0 ~0
— —
+37 +37
~0 ~0
— —
+13
~0
+30
+1
—
0 ~0
0 ~0
-194 +12
+200 ~0
— —
0
0
+2
-2
—
+16 -14
~0 ~0
+12 -12
~0 ~0
— —
~0
~0
-13
~0
—
-88
-14
—
+292 +740
-73
-87
+88
+17
—
+196 -26
+68 -28
0 0
-4 +1
— —
0
0
+7
-1
—
+15
+16
0
~0
—
+154 +129
0
-8
—
0
0
+2
~0
—
~0
~0
+13
~0
—
+13
~0
0
~0
—
+59
+76
-1
-7
—
Table 5: Analysis of security events for objectives 1 and 2 (...)